SlideShare a Scribd company logo
@tamir_dresher
Engineering tools for
making smarter decisions
Tamir Dresher
Director of Architecture @ Payoneer
@tamir_dresher
@tamir_dresher
Agenda
1. Home/Office/Freelancer
2. Choosing communication
Under uncertainty
3. Resource allocation
4. Choosing the best
library
@tamir_dresher
Head of Architecture @
Who am I
?
Software Engineering Lecturer
Ruppin Academic Center
&
My Books:
@tamir_dresher
@tamir_dresher
Example 1
Work from home or office or take Freelancer
@tamir_dresher
Example 1: Work from home or office or take
Freelancer
• We were given a project which we estimate will take 360 Man-Days to complete
• 10 people team - FTEs (Full time employees) and Freelancers each with a different
cost
• FTEs
– Can work at home or at the office
– Office has a cost and if more than 2 days, cost increase
• Freelancers
– Has lesser productivity than FTE but lower cost
– Cost increase if more than 8 freelancers
• What is the ideal combination of FTEs and Freelancers, and how many office
days?
@tamir_dresher
Brute force
=C6*(C10+C5*C8/5)+C4*IF(C4>8,C11,C9)+IF(C5>3,20,0)*C5
@tamir_dresher
Tip 1 – Name you cells
• Ctrl+F3 will open the Name Manager
@tamir_dresher
Brute force
@tamir_dresher
Brute force
• Let’s run over all the possible values of our variables
• We can run a script BUT Excel’s build-in What-If feature is much faster
@tamir_dresher
Brute force
• Let’s run over all the possible values of our variables
• We can run a script BUT Excel’s build-in What-If feature is much faster
Step 1
Write all values for
variable 1 as rows, and all
values for variable 2 as
columns
@tamir_dresher
Brute force
• Let’s run over all the possible values of our variables
• We can run a script BUT Excel’s build-in What-If feature is much faster
Step 2
Reference you target
function in the upper left
cell of the table
@tamir_dresher
Brute force
• Let’s run over all the possible values of our variables
• We can run a script BUT Excel’s build-in What-If feature is much faster
Step 3
• Mark the table
• Open What-If -> Data Table
under the Data tab in the
ribbon
• Then reference the cell of the
variable the top row represents
and
the variable the left column
represents
@tamir_dresher
Brute force
• Let’s run over all the possible values of our variables
• We can run a script BUT Excel’s build-in What-If feature is much faster
@tamir_dresher
Tip 2 – Colorize your cells
• Use Conditional Formatting to quickly find Minimal and Maximal values
@tamir_dresher
Brute force
• Let’s run over all the possible values of our variables
• We can run a script BUT Excel’s build-in What-If feature is much faster
@tamir_dresher
@tamir_dresher
Example 2
Choosing the best communication method
OR how to choose your next restaurant
@tamir_dresher
Example 2: Choosing the best communication method
• We are adding a new recommendation capability to our product and
the team has 2 candidate possible algorithms.
We are not sure which one will perform better (which one will lead to most clicks)
• Naïve A/B Testing will expose each algorithm to 50% of the users for a period of
time and then compare the results.
• But If one algorithm is clearly better, we might be losing significant revenue while
continuing to show the underperforming one during the test period
@tamir_dresher
Multi Armed Bandit
@tamir_dresher
Multi Armed Bandit
balancing exploration (trying different options) and exploitation (sticking to the best-known
option).
@tamir_dresher
My restaurant search
Corporate
headquarters
A B
C D
@tamir_dresher
My restaurant search
Corporate
headquarters
A B
C D
which one should I pick from now on?
@tamir_dresher
@tamir_dresher
My restaurant search
Corporate
headquarters
A B
C D
Even a broken clock shows the right time twice a day
@tamir_dresher
My restaurant search
Corporate
headquarters
A B
C D
Multi Armed Bandit approach (Thompson sampling)
1 2 3 4 5
0
0.05
0.1
0.15
0.2
0.25
probability
1 2 3 4 5
0
0.05
0.1
0.15
0.2
0.25
probability
1 2 3 4 5
0
0.05
0.1
0.15
0.2
0.25
probability
1 2 3 4 5
0
0.05
0.1
0.15
0.2
0.25
probability
0 1
0.2 0.4 0.6 0.8
1 2 3 4 5
random.NextDouble(); -> 0.5
@tamir_dresher
My restaurant search
Corporate
headquarters
A B
C D
Multi Armed Bandit approach (Thompson sampling)
1 2 3 4 5
0
0.05
0.1
0.15
0.2
0.25
probability
1 2 3 4 5
0
0.05
0.1
0.15
0.2
0.25
probability
1 2 3 4 5
0
0.05
0.1
0.15
0.2
0.25
probability
1 2 3 4 5
0
0.05
0.1
0.15
0.2
0.25
probability
Random sample: 3 Random sample: 2
Random sample: 4
Random sample: 1
@tamir_dresher
My restaurant search
Corporate
headquarters
A B
C D
Multi Armed Bandit approach (Thompson sampling)
1 2 3 4 5
0
0.05
0.1
0.15
0.2
0.25
probability
1 2 3 4 5
0
0.05
0.1
0.15
0.2
0.25
probability
1 2 3 4 5
0
0.05
0.1
0.15
0.2
0.25
probability
@tamir_dresher
My restaurant search
Corporate
headquarters
A B
C D
Multi Armed Bandit approach (Thompson sampling)
1 2 3 4 5
0
0.05
0.1
0.15
0.2
0.25
probability
1 2 3 4 5
0
0.05
0.1
0.15
0.2
0.25
probability
1 2 3 4 5
0
0.05
0.1
0.15
0.2
0.25
probability
1 2 3 4 5
0
0.05
0.1
0.15
0.2
0.25
0.3
0.35
0.4
probability
Random sample: 4 Random sample: 2
Random sample: 3
Random sample: 1
@tamir_dresher
My restaurant search
Corporate
headquarters
A B
C D
Multi Armed Bandit approach (Thompson sampling)
1 2 3 4 5
0
0.05
0.1
0.15
0.2
0.25
probability
1 2 3 4 5
0
0.05
0.1
0.15
0.2
0.25
probability
1 2 3 4 5
0
0.05
0.1
0.15
0.2
0.25
probability
1 2 3 4 5
0
0.05
0.1
0.15
0.2
0.25
0.3
0.35
0.4
probability
@tamir_dresher
My restaurant search
Corporate
headquarters
A B
C D
Multi Armed Bandit approach (Thompson sampling)
1 2 3 4 5
0
0.05
0.1
0.15
0.2
0.25
probability
1 2 3 4 5
0
0.05
0.1
0.15
0.2
0.25
probability
1 2 3 4 5
0
0.05
0.1
0.15
0.2
0.25
0.3
0.35
0.4
probability
@tamir_dresher
Multi Armed Bandit - summary
• Balancing exploration (trying new options) and exploitation (choosing the best-
known option) across multiple choices (e.g., restaurants, features).
• The goal is to maximize reward over time by dynamically updating the selection
process based on feedback.
• Thompson sampling – generate a random value per each item/option by using it
distribution array and select the item with the highest value
– Beta distribution is a preferred way to do so
@tamir_dresher
@tamir_dresher
Example 3
SaaS expansion in the cloud and how to
satisfy FinOps
@tamir_dresher
Example 3: SaaS expansion in the cloud
• Our SaaS product becomes massively popular and has been expanded into
multiple regions in the cloud. Each region has different load and base latency.
We want to optimize the cost while maintaining high performance and
availability to all users
• Decisions to make:
– How many instance per each resource type in each region?
– How to distribute the load between the regions?
• Constraints:
– Each region must provide at least 100,000 compute units (CU)
– Latency must stay below a certain threshold
– Some regions are critical and should have lower latency and availability
– Our budget has a limit of 15K USD
@tamir_dresher
Formalize the problem (1)
Region Critical
Base
Load
Base
latency
(ms)
Routed load to (0..1) Instances
US-East US-West
EU-
Central
Asia-
Pacific
#Smal
l #Medium
#Larg
e
US-East 1 4500 50 ? ? ? ? ? ? ?
US-West 0 3200 60 ? ? ? ? ? ? ?
EU-Central 1 3250 58 ? ? ? ? ? ? ?
Asia-Pacific 0 5500 80 ? ? ? ? ? ? ?
𝑅𝑒𝑔𝑖𝑜𝑛𝐿𝑎𝑡𝑒𝑛𝑐𝑦=
𝐵𝑎𝑠𝑒𝐿𝑎𝑡𝑒𝑛𝑐𝑦×𝑅𝑒𝑔𝑖𝑜𝑛𝐿𝑜𝑎𝑑
𝐶𝑜𝑚𝑝𝑢𝑡𝑒𝑈𝑛𝑖𝑡𝑠
×
1
𝐶𝑟𝑖𝑡𝑖𝑐𝑎𝑙𝑖𝑡𝑦𝑊𝑒𝑖𝑔h𝑡 Increase Latency to
virtually demand more
resources
Minimize Cost = (#Smallus-east+…+#SmallAsia)*Costsmall +…+ (#Largeus-east+…+#LargeAsia)*Costlarge
@tamir_dresher
Formalize the problem (1)
Region Critical
Base
Load
Base
latency
(ms)
Routed load to (0..1) Instances
US-East US-West
EU-
Central
Asia-
Pacific
#Smal
l #Medium
#Larg
e
US-East 1 4500 50 ? ? ? ? ? ? ?
US-West 0 3200 60 ? ? ? ? ? ? ?
EU-Central 1 3250 58 ? ? ? ? ? ? ?
Asia-Pacific 0 5500 80 ? ? ? ? ? ? ?
Constraints:
• Regions routed load sum to 1
• Instance count are integers
• Cost<15,000$
• Latency < MAX_LATENCY
• Each region has minimal capacity
Minimize Cost = (#Smallus-east+…+#SmallAsia)*Costsmall +…+ (#Largeus-east+…+#LargeAsia)*Costlarge
@tamir_dresher
@tamir_dresher
Linear Programming/Optimization
• Ideal for resource allocation problems
@tamir_dresher
Linear Programming/Optimization
• You can use Excel solver or use Google OR-Tools for .Net in your code
@tamir_dresher
Linear Programming/Optimization
• You can use Excel solver or use Google OR-Tools for .Net in your code
https://github.com/tamirdresher/EngineeringToolsForSmarterDecisions/tree/master/LinearProgramming
@tamir_dresher
Linear Programming - Real world scenario
• How Uber Optimizes the Timing of Push Notifications using ML and Linear Programmi
ng
Where xi,t is a binary indicator of whether to send push i at time t, and si,t is the score (value) of sending
push i at time t.
@tamir_dresher
@tamir_dresher
Example 4
Deciding which Framework/Library to use
@tamir_dresher
Example 4: Deciding which Framework/Library to use
• You're tasked with choosing a third-party library for the upcoming project.
you need to consider several factors to ensure you pick the right one from 10
potential libraries.
Each library is evaluated based on these attributes:
1. Ease of Use
2. Performance
3. Cost
4. Support and Community
5. Documentation Quality
6. Downloads/Stars
@tamir_dresher
Example 4: Deciding which Framework/Library to use
Library
Ease of use (1-
10)
Performance
(TPS)
Cost($
)
Support
(1,0)
Documentati
on
Quality (1-10)
Downloads
Library1 5 700 500 0 7 1000
Library2 7 650 1200 1 6 2000
Library3 8 699 450 0 9 500
Library4 5 520 600 1 5 900
Library5 6 200 150 1 8 250
Library6 9 600 800 0 4 740
Library7 4 320 350 1 2 800
Library8 5 875 300 1 8 600
Library9 2 900 450 1 2 700
Library1
0 10 1000 10 1 10 1
Issues:
• Scale is not comparable
• For cost, larger value should give lower score
• How should we take #Downloads into account
@tamir_dresher
Normalizing the data
• Each attribute has different scales of importance attributes like cost (which
have a wider range) have a disproportionate impact on the decision
• min-max normalization – transform to a range of [0,1]
• Z-score – transforms to a range of [-1,1]
min-max makes numbers fit between 0 and 1, while z-score shows how far each
number is from the average, using the idea of "how spread out" the numbers are.
@tamir_dresher
Normalized attributes
Library
Ease of use (1-
10)
Performance
(TPS)
Cost($
)
Support
(1,0)
Documentation
Quality (1-10)
Downloa
ds
Library
1 -0.478 0.224 0.060 -1.528 0.338 0.497
Library
2 0.391 0.015 2.255 0.655 -0.038 2.478
Library
3 0.826 0.220 -0.097 -1.528 1.089 -0.493
Library
4 -0.478 -0.529 0.373 0.655 -0.413 0.299
Library
5 -0.043 -1.868 -1.038 0.655 0.714 -0.989
Library
6 1.261 -0.194 1.001 -1.528 -0.789 -0.018
=(B2-AVERAGE(B:B))/STDEV.P(B:B)
Cost should order should be
reversed.
So we will multiply by -1
@tamir_dresher
Normalized attributes with cost order fix
Library
Ease of use (1-
10)
Performance
(TPS)
Cost($
)
Support
(1,0)
Documentation
Quality (1-10)
Downloa
ds
Library
1 -0.478 0.224 -0.060 -1.528 0.338 0.497
Library
2 0.391 0.015 -2.255 0.655 -0.038 2.478
Library
3 0.826 0.220 0.097 -1.528 1.089 -0.493
Library
4 -0.478 -0.529 -0.373 0.655 -0.413 0.299
Library
5 -0.043 -1.868 1.038 0.655 0.714 -0.989
Library
6 1.261 -0.194 -1.001 -1.528 -0.789 -0.018
@tamir_dresher
Normalized attributes with cost order fix – with avg
score
Library
Ease of use (1-
10)
Performance
(TPS)
Cost($
)
Support
(1,0)
Documentation
Quality (1-10)
Downloa
ds
Library
1 -0.478 0.224 -0.060 -1.528 0.338 0.497
Library
2 0.391 0.015 -2.255 0.655 -0.038 2.478
Library
3 0.826 0.220 0.097 -1.528 1.089 -0.493
Library
4 -0.478 -0.529 -0.373 0.655 -0.413 0.299
Library
5 -0.043 -1.868 1.038 0.655 0.714 -0.989
Library
6 1.261 -0.194 -1.001 -1.528 -0.789 -0.018
Score
-0.16769
0.20769
0.035262
-0.13999
-0.08225
-0.37801
-0.44203
0.353136
-0.26778
0.881655
@tamir_dresher
@tamir_dresher
IMDB Score
𝐼𝑀𝐷𝐵𝑆𝑐𝑜𝑟𝑒=
𝑁𝑢𝑚𝑏𝑒𝑟𝑂𝑓𝑉𝑜𝑡𝑒𝑠∗𝑀𝑜𝑣𝑖𝑒𝐴𝑣𝑔𝑅𝑎𝑡𝑖𝑛𝑔+𝑚𝑖𝑛𝑉𝑜𝑡𝑒𝑠∗ 𝐴𝑣𝑔𝑅𝑎𝑡𝑖𝑛𝑔𝑂𝑓𝐴𝑙𝑙𝑀𝑜𝑣𝑖𝑒𝑠
𝑁𝑢𝑚𝑏𝑒𝑟𝑂𝑓𝑉𝑜𝑡𝑒𝑠+𝑚𝑖𝑛𝑉𝑜𝑡𝑒𝑠
𝐿𝑖𝑏𝑟𝑎𝑟𝑦 𝑆𝑐𝑜𝑟𝑒=
𝐷𝑜𝑤𝑛𝑙𝑜𝑎𝑑𝑠∗𝐿𝑖𝑏𝐴𝑣𝑔𝑆𝑐𝑜𝑟𝑒+𝑚𝑖𝑛𝐷𝑜𝑤𝑛𝑙𝑜𝑎𝑑𝑠∗ 𝐴𝑣𝑔𝑆𝑐𝑜𝑟𝑒
𝐷𝑜𝑤𝑛𝑙𝑜𝑎𝑑𝑠+𝑚𝑖𝑛𝐷𝑜𝑤𝑛𝑙𝑜𝑎𝑑𝑠
@tamir_dresher
Example 4: Deciding which Framework/Library to use
Library
Ease of use (1-
10)
Performance
(TPS)
Cost($
)
Support
(1,0)
Documentati
on
Quality (1-10)
Downloads
Score
(Normalize
d + IMDB)
Library
1 5 700 500 0 7 1000 -0.27329
Library
2 7 650 1200 1 6 2000 -0.23461
Library
3 8 699 450 0 9 500 0.1175
Library
4 5 520 600 1 5 900 -0.20499
Library
5 6 200 150 1 8 250 0.070731
Library
Final results
@tamir_dresher
Summary
1. Home/Office/Freelancer –
Brute force & What-If
2. Choosing communication
Under uncertainty – Multi Armed Bandit
3. Resource allocation
Linear Optimization
4. Choosing the best
library – IMDB Score
https://github.com/tamirdresher/EngineeringToolsForSmarterDecisio
ns

More Related Content

PDF
Scott Clark, Software Engineer, Yelp at MLconf SF
PDF
Optimal Learning for Fun and Profit with MOE
PDF
heuristic search Techniques and game playing.pdf
PDF
Introduction to search and optimisation for the design theorist
PDF
"Optimal Learning for Fun and Profit" by Scott Clark (Presented at The Yelp E...
PPTX
Applied Data Science for monetization: pitfalls, common misconceptions, and n...
PPTX
ETCS262A-Analysis of design Algorithm.pptx
PPTX
I love the smell of data in the morning (getting started with data science) ...
Scott Clark, Software Engineer, Yelp at MLconf SF
Optimal Learning for Fun and Profit with MOE
heuristic search Techniques and game playing.pdf
Introduction to search and optimisation for the design theorist
"Optimal Learning for Fun and Profit" by Scott Clark (Presented at The Yelp E...
Applied Data Science for monetization: pitfalls, common misconceptions, and n...
ETCS262A-Analysis of design Algorithm.pptx
I love the smell of data in the morning (getting started with data science) ...

Similar to Engineering tools for making smarter decisions .pptx (20)

PDF
Backtracking & branch and bound
PDF
FADML 10 PPC Solving NP-Hard Problems.pdf
PDF
Monte Carlo Simulation for project estimates v1.0
PPT
Elak3 need of greedy for design and analysis of algorithms.ppt
PPT
Software Testing-Dynamic testing technique-Mazenet solution
PDF
My Favorite Calc Code
PPTX
Artificial Intelligence Alpha Beta pruning.pptx
PDF
Eficiency and Low Cost: Pro Tips for you to save 50% of your money with Googl...
PPTX
FAI UNIT 6FAI UNIT 7 all important questions to be noted max pass
PDF
Problem Solving Techniques For Evolutionary Design
PPTX
Algorithm and data science foundation ISC
PDF
LKCE16 - Estimation made easy by Pawel Brodzinski and Tomek Rusilko
PDF
PDF
Data Science Toolkit for Product Managers
PDF
Data science toolkit for product managers
PDF
Bandit algorithms for website optimization - A summary
PPT
Parallel_Algorithms_In_Combinatorial_Optimization_Problems.ppt
PPT
126622gghyytgggffggggggfsssssssssdff70.ppt
PPTX
Risk Management and Reliable Forecasting using Un-reliable Data (magennis) - ...
PDF
"Computational Support for Functionality Selection in Interaction Design" CHI...
Backtracking & branch and bound
FADML 10 PPC Solving NP-Hard Problems.pdf
Monte Carlo Simulation for project estimates v1.0
Elak3 need of greedy for design and analysis of algorithms.ppt
Software Testing-Dynamic testing technique-Mazenet solution
My Favorite Calc Code
Artificial Intelligence Alpha Beta pruning.pptx
Eficiency and Low Cost: Pro Tips for you to save 50% of your money with Googl...
FAI UNIT 6FAI UNIT 7 all important questions to be noted max pass
Problem Solving Techniques For Evolutionary Design
Algorithm and data science foundation ISC
LKCE16 - Estimation made easy by Pawel Brodzinski and Tomek Rusilko
Data Science Toolkit for Product Managers
Data science toolkit for product managers
Bandit algorithms for website optimization - A summary
Parallel_Algorithms_In_Combinatorial_Optimization_Problems.ppt
126622gghyytgggffggggggfsssssssssdff70.ppt
Risk Management and Reliable Forecasting using Un-reliable Data (magennis) - ...
"Computational Support for Functionality Selection in Interaction Design" CHI...
Ad

More from Tamir Dresher (20)

PDF
NET Aspire - NET Conf IL 2024 - Tamir Dresher.pdf
PPTX
Tamir Dresher - DotNet 7 What's new.pptx
PPTX
Tamir Dresher - What’s new in ASP.NET Core 6
PPTX
Tamir Dresher - Async Streams in C#
PPTX
Anatomy of a data driven architecture - Tamir Dresher
PPTX
Tamir Dresher Clarizen adventures with the wild GC during the holiday season
PDF
Debugging tricks you wish you knew Tamir Dresher - Odessa 2019
PDF
From zero to hero with the actor model - Tamir Dresher - Odessa 2019
PPTX
Tamir Dresher - Demystifying the Core of .NET Core
PPTX
Breaking the monolith to microservice with Docker and Kubernetes (k8s)
PPTX
.Net december 2017 updates - Tamir Dresher
PPTX
Testing time and concurrency Rx
PPTX
Building responsive application with Rx - confoo - tamir dresher
PPTX
.NET Debugging tricks you wish you knew tamir dresher
PPTX
From Zero to the Actor Model (With Akka.Net) - CodeMash2017 - Tamir Dresher
PPTX
Building responsive applications with Rx - CodeMash2017 - Tamir Dresher
PPTX
Debugging tricks you wish you knew - Tamir Dresher
PPTX
Rx 101 - Tamir Dresher - Copenhagen .NET User Group
PPTX
Cloud patterns - NDC Oslo 2016 - Tamir Dresher
PPTX
Reactiveness All The Way - SW Architecture 2015 Conference
NET Aspire - NET Conf IL 2024 - Tamir Dresher.pdf
Tamir Dresher - DotNet 7 What's new.pptx
Tamir Dresher - What’s new in ASP.NET Core 6
Tamir Dresher - Async Streams in C#
Anatomy of a data driven architecture - Tamir Dresher
Tamir Dresher Clarizen adventures with the wild GC during the holiday season
Debugging tricks you wish you knew Tamir Dresher - Odessa 2019
From zero to hero with the actor model - Tamir Dresher - Odessa 2019
Tamir Dresher - Demystifying the Core of .NET Core
Breaking the monolith to microservice with Docker and Kubernetes (k8s)
.Net december 2017 updates - Tamir Dresher
Testing time and concurrency Rx
Building responsive application with Rx - confoo - tamir dresher
.NET Debugging tricks you wish you knew tamir dresher
From Zero to the Actor Model (With Akka.Net) - CodeMash2017 - Tamir Dresher
Building responsive applications with Rx - CodeMash2017 - Tamir Dresher
Debugging tricks you wish you knew - Tamir Dresher
Rx 101 - Tamir Dresher - Copenhagen .NET User Group
Cloud patterns - NDC Oslo 2016 - Tamir Dresher
Reactiveness All The Way - SW Architecture 2015 Conference
Ad

Recently uploaded (20)

PPTX
Mastering-Cybersecurity-The-Crucial-Role-of-Antivirus-Support-Services.pptx
PDF
top salesforce developer skills in 2025.pdf
PDF
Why TechBuilder is the Future of Pickup and Delivery App Development (1).pdf
PPTX
Materi-Enum-and-Record-Data-Type (1).pptx
PDF
Claude Code: Everyone is a 10x Developer - A Comprehensive AI-Powered CLI Tool
PDF
Build Multi-agent using Agent Development Kit
PPTX
AIRLINE PRICE API | FLIGHT API COST |
PDF
Addressing The Cult of Project Management Tools-Why Disconnected Work is Hold...
PDF
PTS Company Brochure 2025 (1).pdf.......
PPTX
Transform Your Business with a Software ERP System
PPTX
Agentic AI : A Practical Guide. Undersating, Implementing and Scaling Autono...
PPTX
FLIGHT TICKET RESERVATION SYSTEM | FLIGHT BOOKING ENGINE API
PDF
Digital Strategies for Manufacturing Companies
PDF
Softaken Excel to vCard Converter Software.pdf
PDF
How to Confidently Manage Project Budgets
PPTX
VVF-Customer-Presentation2025-Ver1.9.pptx
PDF
How Creative Agencies Leverage Project Management Software.pdf
PDF
medical staffing services at VALiNTRY
PPTX
Odoo POS Development Services by CandidRoot Solutions
PDF
Understanding Forklifts - TECH EHS Solution
Mastering-Cybersecurity-The-Crucial-Role-of-Antivirus-Support-Services.pptx
top salesforce developer skills in 2025.pdf
Why TechBuilder is the Future of Pickup and Delivery App Development (1).pdf
Materi-Enum-and-Record-Data-Type (1).pptx
Claude Code: Everyone is a 10x Developer - A Comprehensive AI-Powered CLI Tool
Build Multi-agent using Agent Development Kit
AIRLINE PRICE API | FLIGHT API COST |
Addressing The Cult of Project Management Tools-Why Disconnected Work is Hold...
PTS Company Brochure 2025 (1).pdf.......
Transform Your Business with a Software ERP System
Agentic AI : A Practical Guide. Undersating, Implementing and Scaling Autono...
FLIGHT TICKET RESERVATION SYSTEM | FLIGHT BOOKING ENGINE API
Digital Strategies for Manufacturing Companies
Softaken Excel to vCard Converter Software.pdf
How to Confidently Manage Project Budgets
VVF-Customer-Presentation2025-Ver1.9.pptx
How Creative Agencies Leverage Project Management Software.pdf
medical staffing services at VALiNTRY
Odoo POS Development Services by CandidRoot Solutions
Understanding Forklifts - TECH EHS Solution

Engineering tools for making smarter decisions .pptx

  • 1. @tamir_dresher Engineering tools for making smarter decisions Tamir Dresher Director of Architecture @ Payoneer @tamir_dresher
  • 2. @tamir_dresher Agenda 1. Home/Office/Freelancer 2. Choosing communication Under uncertainty 3. Resource allocation 4. Choosing the best library
  • 3. @tamir_dresher Head of Architecture @ Who am I ? Software Engineering Lecturer Ruppin Academic Center & My Books:
  • 4. @tamir_dresher @tamir_dresher Example 1 Work from home or office or take Freelancer
  • 5. @tamir_dresher Example 1: Work from home or office or take Freelancer • We were given a project which we estimate will take 360 Man-Days to complete • 10 people team - FTEs (Full time employees) and Freelancers each with a different cost • FTEs – Can work at home or at the office – Office has a cost and if more than 2 days, cost increase • Freelancers – Has lesser productivity than FTE but lower cost – Cost increase if more than 8 freelancers • What is the ideal combination of FTEs and Freelancers, and how many office days?
  • 7. @tamir_dresher Tip 1 – Name you cells • Ctrl+F3 will open the Name Manager
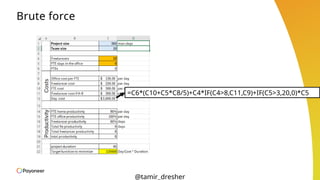
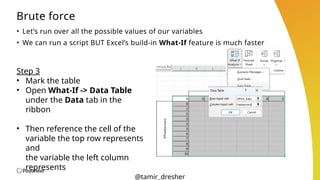
  • 9. @tamir_dresher Brute force • Let’s run over all the possible values of our variables • We can run a script BUT Excel’s build-in What-If feature is much faster
  • 10. @tamir_dresher Brute force • Let’s run over all the possible values of our variables • We can run a script BUT Excel’s build-in What-If feature is much faster Step 1 Write all values for variable 1 as rows, and all values for variable 2 as columns
  • 11. @tamir_dresher Brute force • Let’s run over all the possible values of our variables • We can run a script BUT Excel’s build-in What-If feature is much faster Step 2 Reference you target function in the upper left cell of the table
  • 12. @tamir_dresher Brute force • Let’s run over all the possible values of our variables • We can run a script BUT Excel’s build-in What-If feature is much faster Step 3 • Mark the table • Open What-If -> Data Table under the Data tab in the ribbon • Then reference the cell of the variable the top row represents and the variable the left column represents
  • 13. @tamir_dresher Brute force • Let’s run over all the possible values of our variables • We can run a script BUT Excel’s build-in What-If feature is much faster
  • 14. @tamir_dresher Tip 2 – Colorize your cells • Use Conditional Formatting to quickly find Minimal and Maximal values
  • 15. @tamir_dresher Brute force • Let’s run over all the possible values of our variables • We can run a script BUT Excel’s build-in What-If feature is much faster
  • 16. @tamir_dresher @tamir_dresher Example 2 Choosing the best communication method OR how to choose your next restaurant
  • 17. @tamir_dresher Example 2: Choosing the best communication method • We are adding a new recommendation capability to our product and the team has 2 candidate possible algorithms. We are not sure which one will perform better (which one will lead to most clicks) • Naïve A/B Testing will expose each algorithm to 50% of the users for a period of time and then compare the results. • But If one algorithm is clearly better, we might be losing significant revenue while continuing to show the underperforming one during the test period
  • 19. @tamir_dresher Multi Armed Bandit balancing exploration (trying different options) and exploitation (sticking to the best-known option).
  • 21. @tamir_dresher My restaurant search Corporate headquarters A B C D which one should I pick from now on?
  • 23. @tamir_dresher My restaurant search Corporate headquarters A B C D Even a broken clock shows the right time twice a day
  • 24. @tamir_dresher My restaurant search Corporate headquarters A B C D Multi Armed Bandit approach (Thompson sampling) 1 2 3 4 5 0 0.05 0.1 0.15 0.2 0.25 probability 1 2 3 4 5 0 0.05 0.1 0.15 0.2 0.25 probability 1 2 3 4 5 0 0.05 0.1 0.15 0.2 0.25 probability 1 2 3 4 5 0 0.05 0.1 0.15 0.2 0.25 probability
  • 25. @tamir_dresher My restaurant search Corporate headquarters A B C D Multi Armed Bandit approach (Thompson sampling) 1 2 3 4 5 0 0.05 0.1 0.15 0.2 0.25 probability 1 2 3 4 5 0 0.05 0.1 0.15 0.2 0.25 probability 1 2 3 4 5 0 0.05 0.1 0.15 0.2 0.25 probability 1 2 3 4 5 0 0.05 0.1 0.15 0.2 0.25 probability 0 1
  • 26. @tamir_dresher My restaurant search Corporate headquarters A B C D Multi Armed Bandit approach (Thompson sampling) 1 2 3 4 5 0 0.05 0.1 0.15 0.2 0.25 probability 1 2 3 4 5 0 0.05 0.1 0.15 0.2 0.25 probability 1 2 3 4 5 0 0.05 0.1 0.15 0.2 0.25 probability 1 2 3 4 5 0 0.05 0.1 0.15 0.2 0.25 probability 0 1 0.2 0.4 0.6 0.8 1 2 3 4 5
  • 27. @tamir_dresher My restaurant search Corporate headquarters A B C D Multi Armed Bandit approach (Thompson sampling) 1 2 3 4 5 0 0.05 0.1 0.15 0.2 0.25 probability 1 2 3 4 5 0 0.05 0.1 0.15 0.2 0.25 probability 1 2 3 4 5 0 0.05 0.1 0.15 0.2 0.25 probability 1 2 3 4 5 0 0.05 0.1 0.15 0.2 0.25 probability 0 1 0.2 0.4 0.6 0.8 1 2 3 4 5 random.NextDouble(); -> 0.5
  • 28. @tamir_dresher My restaurant search Corporate headquarters A B C D Multi Armed Bandit approach (Thompson sampling) 1 2 3 4 5 0 0.05 0.1 0.15 0.2 0.25 probability 1 2 3 4 5 0 0.05 0.1 0.15 0.2 0.25 probability 1 2 3 4 5 0 0.05 0.1 0.15 0.2 0.25 probability 1 2 3 4 5 0 0.05 0.1 0.15 0.2 0.25 probability Random sample: 3 Random sample: 2 Random sample: 4 Random sample: 1
  • 29. @tamir_dresher My restaurant search Corporate headquarters A B C D Multi Armed Bandit approach (Thompson sampling) 1 2 3 4 5 0 0.05 0.1 0.15 0.2 0.25 probability 1 2 3 4 5 0 0.05 0.1 0.15 0.2 0.25 probability 1 2 3 4 5 0 0.05 0.1 0.15 0.2 0.25 probability 1 2 3 4 5 0 0.05 0.1 0.15 0.2 0.25 probability Random sample: 3 Random sample: 2 Random sample: 4 Random sample: 1
  • 30. @tamir_dresher My restaurant search Corporate headquarters A B C D Multi Armed Bandit approach (Thompson sampling) 1 2 3 4 5 0 0.05 0.1 0.15 0.2 0.25 probability 1 2 3 4 5 0 0.05 0.1 0.15 0.2 0.25 probability 1 2 3 4 5 0 0.05 0.1 0.15 0.2 0.25 probability
  • 31. @tamir_dresher My restaurant search Corporate headquarters A B C D Multi Armed Bandit approach (Thompson sampling) 1 2 3 4 5 0 0.05 0.1 0.15 0.2 0.25 probability 1 2 3 4 5 0 0.05 0.1 0.15 0.2 0.25 probability 1 2 3 4 5 0 0.05 0.1 0.15 0.2 0.25 probability 1 2 3 4 5 0 0.05 0.1 0.15 0.2 0.25 0.3 0.35 0.4 probability
  • 32. @tamir_dresher My restaurant search Corporate headquarters A B C D Multi Armed Bandit approach (Thompson sampling) 1 2 3 4 5 0 0.05 0.1 0.15 0.2 0.25 probability 1 2 3 4 5 0 0.05 0.1 0.15 0.2 0.25 probability 1 2 3 4 5 0 0.05 0.1 0.15 0.2 0.25 probability 1 2 3 4 5 0 0.05 0.1 0.15 0.2 0.25 0.3 0.35 0.4 probability
  • 33. @tamir_dresher My restaurant search Corporate headquarters A B C D Multi Armed Bandit approach (Thompson sampling) 1 2 3 4 5 0 0.05 0.1 0.15 0.2 0.25 probability 1 2 3 4 5 0 0.05 0.1 0.15 0.2 0.25 probability 1 2 3 4 5 0 0.05 0.1 0.15 0.2 0.25 probability 1 2 3 4 5 0 0.05 0.1 0.15 0.2 0.25 0.3 0.35 0.4 probability Random sample: 4 Random sample: 2 Random sample: 3 Random sample: 1
  • 34. @tamir_dresher My restaurant search Corporate headquarters A B C D Multi Armed Bandit approach (Thompson sampling) 1 2 3 4 5 0 0.05 0.1 0.15 0.2 0.25 probability 1 2 3 4 5 0 0.05 0.1 0.15 0.2 0.25 probability 1 2 3 4 5 0 0.05 0.1 0.15 0.2 0.25 probability 1 2 3 4 5 0 0.05 0.1 0.15 0.2 0.25 0.3 0.35 0.4 probability
  • 35. @tamir_dresher My restaurant search Corporate headquarters A B C D Multi Armed Bandit approach (Thompson sampling) 1 2 3 4 5 0 0.05 0.1 0.15 0.2 0.25 probability 1 2 3 4 5 0 0.05 0.1 0.15 0.2 0.25 probability 1 2 3 4 5 0 0.05 0.1 0.15 0.2 0.25 0.3 0.35 0.4 probability
  • 36. @tamir_dresher Multi Armed Bandit - summary • Balancing exploration (trying new options) and exploitation (choosing the best- known option) across multiple choices (e.g., restaurants, features). • The goal is to maximize reward over time by dynamically updating the selection process based on feedback. • Thompson sampling – generate a random value per each item/option by using it distribution array and select the item with the highest value – Beta distribution is a preferred way to do so
  • 37. @tamir_dresher @tamir_dresher Example 3 SaaS expansion in the cloud and how to satisfy FinOps
  • 38. @tamir_dresher Example 3: SaaS expansion in the cloud • Our SaaS product becomes massively popular and has been expanded into multiple regions in the cloud. Each region has different load and base latency. We want to optimize the cost while maintaining high performance and availability to all users • Decisions to make: – How many instance per each resource type in each region? – How to distribute the load between the regions? • Constraints: – Each region must provide at least 100,000 compute units (CU) – Latency must stay below a certain threshold – Some regions are critical and should have lower latency and availability – Our budget has a limit of 15K USD
  • 39. @tamir_dresher Formalize the problem (1) Region Critical Base Load Base latency (ms) Routed load to (0..1) Instances US-East US-West EU- Central Asia- Pacific #Smal l #Medium #Larg e US-East 1 4500 50 ? ? ? ? ? ? ? US-West 0 3200 60 ? ? ? ? ? ? ? EU-Central 1 3250 58 ? ? ? ? ? ? ? Asia-Pacific 0 5500 80 ? ? ? ? ? ? ? 𝑅𝑒𝑔𝑖𝑜𝑛𝐿𝑎𝑡𝑒𝑛𝑐𝑦= 𝐵𝑎𝑠𝑒𝐿𝑎𝑡𝑒𝑛𝑐𝑦×𝑅𝑒𝑔𝑖𝑜𝑛𝐿𝑜𝑎𝑑 𝐶𝑜𝑚𝑝𝑢𝑡𝑒𝑈𝑛𝑖𝑡𝑠 × 1 𝐶𝑟𝑖𝑡𝑖𝑐𝑎𝑙𝑖𝑡𝑦𝑊𝑒𝑖𝑔h𝑡 Increase Latency to virtually demand more resources Minimize Cost = (#Smallus-east+…+#SmallAsia)*Costsmall +…+ (#Largeus-east+…+#LargeAsia)*Costlarge
  • 40. @tamir_dresher Formalize the problem (1) Region Critical Base Load Base latency (ms) Routed load to (0..1) Instances US-East US-West EU- Central Asia- Pacific #Smal l #Medium #Larg e US-East 1 4500 50 ? ? ? ? ? ? ? US-West 0 3200 60 ? ? ? ? ? ? ? EU-Central 1 3250 58 ? ? ? ? ? ? ? Asia-Pacific 0 5500 80 ? ? ? ? ? ? ? Constraints: • Regions routed load sum to 1 • Instance count are integers • Cost<15,000$ • Latency < MAX_LATENCY • Each region has minimal capacity Minimize Cost = (#Smallus-east+…+#SmallAsia)*Costsmall +…+ (#Largeus-east+…+#LargeAsia)*Costlarge
  • 43. @tamir_dresher Linear Programming/Optimization • You can use Excel solver or use Google OR-Tools for .Net in your code
  • 44. @tamir_dresher Linear Programming/Optimization • You can use Excel solver or use Google OR-Tools for .Net in your code https://github.com/tamirdresher/EngineeringToolsForSmarterDecisions/tree/master/LinearProgramming
  • 45. @tamir_dresher Linear Programming - Real world scenario • How Uber Optimizes the Timing of Push Notifications using ML and Linear Programmi ng Where xi,t is a binary indicator of whether to send push i at time t, and si,t is the score (value) of sending push i at time t.
  • 47. @tamir_dresher Example 4: Deciding which Framework/Library to use • You're tasked with choosing a third-party library for the upcoming project. you need to consider several factors to ensure you pick the right one from 10 potential libraries. Each library is evaluated based on these attributes: 1. Ease of Use 2. Performance 3. Cost 4. Support and Community 5. Documentation Quality 6. Downloads/Stars
  • 48. @tamir_dresher Example 4: Deciding which Framework/Library to use Library Ease of use (1- 10) Performance (TPS) Cost($ ) Support (1,0) Documentati on Quality (1-10) Downloads Library1 5 700 500 0 7 1000 Library2 7 650 1200 1 6 2000 Library3 8 699 450 0 9 500 Library4 5 520 600 1 5 900 Library5 6 200 150 1 8 250 Library6 9 600 800 0 4 740 Library7 4 320 350 1 2 800 Library8 5 875 300 1 8 600 Library9 2 900 450 1 2 700 Library1 0 10 1000 10 1 10 1 Issues: • Scale is not comparable • For cost, larger value should give lower score • How should we take #Downloads into account
  • 49. @tamir_dresher Normalizing the data • Each attribute has different scales of importance attributes like cost (which have a wider range) have a disproportionate impact on the decision • min-max normalization – transform to a range of [0,1] • Z-score – transforms to a range of [-1,1] min-max makes numbers fit between 0 and 1, while z-score shows how far each number is from the average, using the idea of "how spread out" the numbers are.
  • 50. @tamir_dresher Normalized attributes Library Ease of use (1- 10) Performance (TPS) Cost($ ) Support (1,0) Documentation Quality (1-10) Downloa ds Library 1 -0.478 0.224 0.060 -1.528 0.338 0.497 Library 2 0.391 0.015 2.255 0.655 -0.038 2.478 Library 3 0.826 0.220 -0.097 -1.528 1.089 -0.493 Library 4 -0.478 -0.529 0.373 0.655 -0.413 0.299 Library 5 -0.043 -1.868 -1.038 0.655 0.714 -0.989 Library 6 1.261 -0.194 1.001 -1.528 -0.789 -0.018 =(B2-AVERAGE(B:B))/STDEV.P(B:B) Cost should order should be reversed. So we will multiply by -1
  • 51. @tamir_dresher Normalized attributes with cost order fix Library Ease of use (1- 10) Performance (TPS) Cost($ ) Support (1,0) Documentation Quality (1-10) Downloa ds Library 1 -0.478 0.224 -0.060 -1.528 0.338 0.497 Library 2 0.391 0.015 -2.255 0.655 -0.038 2.478 Library 3 0.826 0.220 0.097 -1.528 1.089 -0.493 Library 4 -0.478 -0.529 -0.373 0.655 -0.413 0.299 Library 5 -0.043 -1.868 1.038 0.655 0.714 -0.989 Library 6 1.261 -0.194 -1.001 -1.528 -0.789 -0.018
  • 52. @tamir_dresher Normalized attributes with cost order fix – with avg score Library Ease of use (1- 10) Performance (TPS) Cost($ ) Support (1,0) Documentation Quality (1-10) Downloa ds Library 1 -0.478 0.224 -0.060 -1.528 0.338 0.497 Library 2 0.391 0.015 -2.255 0.655 -0.038 2.478 Library 3 0.826 0.220 0.097 -1.528 1.089 -0.493 Library 4 -0.478 -0.529 -0.373 0.655 -0.413 0.299 Library 5 -0.043 -1.868 1.038 0.655 0.714 -0.989 Library 6 1.261 -0.194 -1.001 -1.528 -0.789 -0.018 Score -0.16769 0.20769 0.035262 -0.13999 -0.08225 -0.37801 -0.44203 0.353136 -0.26778 0.881655
  • 54. @tamir_dresher IMDB Score 𝐼𝑀𝐷𝐵𝑆𝑐𝑜𝑟𝑒= 𝑁𝑢𝑚𝑏𝑒𝑟𝑂𝑓𝑉𝑜𝑡𝑒𝑠∗𝑀𝑜𝑣𝑖𝑒𝐴𝑣𝑔𝑅𝑎𝑡𝑖𝑛𝑔+𝑚𝑖𝑛𝑉𝑜𝑡𝑒𝑠∗ 𝐴𝑣𝑔𝑅𝑎𝑡𝑖𝑛𝑔𝑂𝑓𝐴𝑙𝑙𝑀𝑜𝑣𝑖𝑒𝑠 𝑁𝑢𝑚𝑏𝑒𝑟𝑂𝑓𝑉𝑜𝑡𝑒𝑠+𝑚𝑖𝑛𝑉𝑜𝑡𝑒𝑠 𝐿𝑖𝑏𝑟𝑎𝑟𝑦 𝑆𝑐𝑜𝑟𝑒= 𝐷𝑜𝑤𝑛𝑙𝑜𝑎𝑑𝑠∗𝐿𝑖𝑏𝐴𝑣𝑔𝑆𝑐𝑜𝑟𝑒+𝑚𝑖𝑛𝐷𝑜𝑤𝑛𝑙𝑜𝑎𝑑𝑠∗ 𝐴𝑣𝑔𝑆𝑐𝑜𝑟𝑒 𝐷𝑜𝑤𝑛𝑙𝑜𝑎𝑑𝑠+𝑚𝑖𝑛𝐷𝑜𝑤𝑛𝑙𝑜𝑎𝑑𝑠
  • 55. @tamir_dresher Example 4: Deciding which Framework/Library to use Library Ease of use (1- 10) Performance (TPS) Cost($ ) Support (1,0) Documentati on Quality (1-10) Downloads Score (Normalize d + IMDB) Library 1 5 700 500 0 7 1000 -0.27329 Library 2 7 650 1200 1 6 2000 -0.23461 Library 3 8 699 450 0 9 500 0.1175 Library 4 5 520 600 1 5 900 -0.20499 Library 5 6 200 150 1 8 250 0.070731 Library Final results
  • 56. @tamir_dresher Summary 1. Home/Office/Freelancer – Brute force & What-If 2. Choosing communication Under uncertainty – Multi Armed Bandit 3. Resource allocation Linear Optimization 4. Choosing the best library – IMDB Score https://github.com/tamirdresher/EngineeringToolsForSmarterDecisio ns

Editor's Notes

  • #18: Bandit - a thief or someone who belongs to a gang. A slot machine is like a thief of your time and resources
  • #19: Bandit - a thief or someone who belongs to a gang. A slot machine is like a thief of your time and resources
  • #24: Assign distribution array for each restaurant – uniform at first draw a number from each one
  • #25: Assign distribution array for each restaurant – uniform at first draw a number from each one
  • #26: Assign distribution array for each restaurant – uniform at first draw a number from each one
  • #27: Assign distribution array for each restaurant – uniform at first draw a number from each one
  • #28: Assign distribution array for each restaurant – uniform at first draw a number from each one
  • #29: Assign distribution array for each restaurant – uniform at first draw a number from each one
  • #30: Assign distribution array for each restaurant – uniform at first
  • #31: Assign distribution array for each restaurant – uniform at first
  • #32: Assign distribution array for each restaurant – uniform at first
  • #33: Assign distribution array for each restaurant – uniform at first
  • #34: Assign distribution array for each restaurant – uniform at first
  • #35: Assign distribution array for each restaurant – uniform at first