SlideShare a Scribd company logo
EuroBSDcon 2017
System	Performance	
Analysis	Methodologies	
Brendan	Gregg	
Senior	Performance	Architect
EuroBSDcon 2017 System Performance Analysis Methodologies
ERASABLE	
MEMORY	
CORE	SET	
AREA	
VAC	SETS	
FIXED	
MEMORY	
Apollo Lunar Module Guidance Computer
performance analysis
EuroBSDcon 2017 System Performance Analysis Methodologies
Background
History	
•  System	Performance	Analysis	up	to	the	'90s:	
–  Closed	source	UNIXes	and	applicaNons	
–  Vendor-created	metrics	and	performance	tools	
–  Users	interpret	given	metrics	
•  Problems	
–  Vendors	may	not	provide	the	best	metrics	
–  ORen	had	to	infer,	rather	than	measure	
–  Given	metrics,	what	do	we	do	with	them?	
$ ps -auxw
USER PID %CPU %MEM VSZ RSS TT STAT STARTED TIME COMMAND
root 11 99.9 0.0 0 16 - RL 22:10 22:27.05 [idle]
root 0 0.0 0.0 0 176 - DLs 22:10 0:00.47 [kernel]
root 1 0.0 0.2 5408 1040 - ILs 22:10 0:00.01 /sbin/init --
[…]
Today	
1.  Open	source	
–  OperaNng	systems:		Linux,	BSD,	etc.	
–  ApplicaNons:	source	online	(Github)	
2.  Custom	metrics	
–  Can	patch	the	open	source,	or,	
–  Use	dynamic	tracing	(open	source	helps)	
3.  Methodologies	
–  Start	with	the	quesNons,	then	make	metrics	to	answer	them	
–  Methodologies	can	pose	the	quesNons	
		
Biggest	problem	with	dynamic	tracing	has	been	what	to	do	with	it.	
Methodologies	guide	your	usage.
Crystal	Ball	Thinking
An2-Methodologies
Street	Light	An2-Method	
1.  Pick	observability	tools	that	are	
–  Familiar	
–  Found	on	the	Internet	
–  Found	at	random	
2.  Run	tools	
3.  Look	for	obvious	issues
Drunk	Man	An2-Method	
•  Drink	Tune	things	at	random	unNl	the	problem	goes	away
Blame	Someone	Else	An2-Method	
1.  Find	a	system	or	environment	component	you	are	not	
responsible	for	
2.  Hypothesize	that	the	issue	is	with	that	component	
3.  Redirect	the	issue	to	the	responsible	team	
4.  When	proven	wrong,	go	to	1
Traffic	Light	An2-Method	
1.  Turn	all	metrics	into	traffic	lights	
2.  Open	dashboard	
3.  Everything	green?	No	worries,	mate.	
		
•  Type	I	errors:	red	instead	of	green	
–  team	wastes	Nme	
•  Type	II	errors:	green	instead	of	red	
–  performance	issues	undiagnosed	
–  team	wastes	more	Nme	looking	elsewhere	
		
Traffic	lights	are	suitable	for	objec2ve	metrics	(eg,	errors),	not	
subjec2ve	metrics	(eg,	IOPS,	latency).
Methodologies
Performance	Methodologies	
System	Methodologies:	
–  Problem	statement	method	
–  FuncNonal	diagram	method	
–  Workload	analysis	
–  Workload	characterizaNon	
–  Resource	analysis	
–  USE	method	
–  Thread	State	Analysis	
–  On-CPU	analysis	
–  CPU	flame	graph	analysis	
–  Off-CPU	analysis	
–  Latency	correlaNons	
–  Checklists	
–  StaNc	performance	tuning	
–  Tools-based	methods	
…	
•  For	system	engineers:	
–  ways	to	analyze	unfamiliar	systems	and	
applicaNons	
•  For	app	developers:	
–  guidance	for	metric	and	dashboard	design	
		
Collect	your	
own	toolbox	of	
methodologies
Problem	Statement	Method	
1.  What	makes	you	think	there	is	a	performance	problem?		
2.  Has	this	system	ever	performed	well?		
3.  What	has	changed	recently?	
–  soRware?	hardware?	load?	
4.  Can	the	problem	be	described	in	terms	of	latency?	
–  or	run	Nme.	not	IOPS	or	throughput.		
5.  Does	the	problem	affect	other	people	or	apps?	
6.  What	is	the	environment?	
–  soRware,	hardware,	instance	types?	versions?	config?
FuncNonal	Diagram	Method	
1.  Draw	the	funcNonal	diagram	
2.  Trace	all	components	in	the	data	path	
3.  For	each	component,	check	performance	
Breaks	up	a	bigger	problem	into	
smaller,	relevant	parts	
	
Eg,	imagine	throughput	between	the	UCSB	360	and	the	
UTAH	PDP10	was	slow…	 ARPA	Network	1969
Workload	Analysis	
•  Begin	with	applicaNon	metrics	&	context	
•  A	drill-down	methodology	
•  Pros:	
–  ProporNonal,	accurate	metrics	
–  App	context	
•  Cons:	
–  Difficult	to	dig	from	app	to	resource	
–  App	specific	
ApplicaNon	
	
	System	Libraries	
System	Calls	
Kernel	
Hardware	
Workload	
Analysis
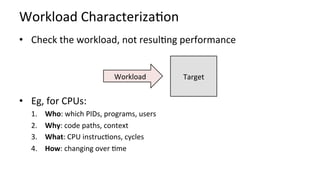
Workload	CharacterizaNon	
•  Check	the	workload,	not	resulNng	performance	
	
•  Eg,	for	CPUs:	
1.  	Who:	which	PIDs,	programs,	users		
2.  	Why:	code	paths,	context	
3.  	What:	CPU	instrucNons,	cycles	
4.  	How:	changing	over	Nme	
Target	Workload
Workload	CharacterizaNon:	CPUs	
Who
How What
Why
top CPU	profile	
CPU	flame	graphs	
monitoring	 PMCs	
CPI	flame	graph
CPU	profile	
CPU	flame	graphs	
PMCs	
CPI	flame	graph	
Most	companies	and	monitoring	products	today	
Who
How What
Why
top
monitoring	
We	can	do	
bejer
Resource	Analysis	
•  Typical	approach	for	system	performance	analysis:	
begin	with	system	tools	&	metrics	
•  Pros:	
–  Generic	
–  Aids	resource	perf	tuning	
•  Cons:	
–  Uneven	coverage	
–  False	posiNves	
ApplicaNon	
	
	System	Libraries	
System	Calls	
Kernel	
Hardware	
Workload	
Analysis
The	USE	Method	
•  For every resource, check:
1.  Utilization: busy time
2.  Saturation: queue length or time
3.  Errors: easy to interpret (objective)
Starts with the questions, then finds the tools
Eg, for hardware, check every resource incl. busses:
http://www.brendangregg.com/USEmethod/use-rosetta.html
http://www.brendangregg.com/USEmethod/use-freebsd.html
EuroBSDcon 2017 System Performance Analysis Methodologies
ERASABLE	
MEMORY	
CORE	SET	
AREA	
VAC	SETS	
FIXED	
MEMORY	
Apollo Lunar Module Guidance Computer
performance analysis
USE	Method:	SoRware	
•  USE	method	can	also	work	for	soRware	resources	
–  kernel	or	app	internals,	cloud	environments	
–  small	scale	(eg,	locks)	to	large	scale	(apps).	Eg:	
•  Mutex	locks:	
–  uNlizaNon	à	lock	hold	Nme	
–  saturaNon	à	lock	contenNon	
–  errors	à	any	errors	
•  EnNre	applicaNon:	
–  uNlizaNon	à	percentage	of	worker	threads	busy	
–  saturaNon	à	length	of	queued	work	
–  errors	à	request	errors	
Resource	
UNlizaNon	
(%)	X
RED	Method	
•  For	every	service,	check	these	are	within	SLO/A:	
1.  	Request	rate	
2.  	Error	rate	
3.  	Dura=on	(distribuNon)	
		
Another	exercise	in	posing	quesNons		from	
funcNonal	diagrams	


By	Tom	Wilkie:	hjp://www.slideshare.net/weaveworks/monitoring-microservices	
Load	
Balancer	
Web	
Proxy	
Web	Server	
User	
Database	
Payments	
Server	
Asset	
Server	
Metrics	
Database
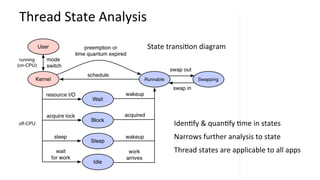
Thread	State	Analysis	
IdenNfy	&	quanNfy	Nme	in	states	
Narrows	further	analysis	to	state	
Thread	states	are	applicable	to	all	apps	
State	transiNon	diagram
TSA:	eg,	OS	X	
Instruments:	Thread	States
TSA:	eg,	RSTS/E	
RSTS:	DEC	OS	from	the	1970's	
	
TENEX	(1969-72)	also	had	Control-T	
for	job	states
TSA:	Finding	FreeBSD	Thread	States	
# dtrace -ln sched:::
ID PROVIDER MODULE FUNCTION NAME
56622 sched kernel none preempt
56627 sched kernel none dequeue
56628 sched kernel none enqueue
56631 sched kernel none off-cpu
56632 sched kernel none on-cpu
56633 sched kernel none remain-cpu
56634 sched kernel none surrender
56640 sched kernel none sleep
56641 sched kernel none wakeup
[…]
struct thread {
[…]
enum {
TDS_INACTIVE = 0x0,
TDS_INHIBITED,
TDS_CAN_RUN,
TDS_RUNQ,
TDS_RUNNING
} td_state;
[…]
#define KTDSTATE(td) 
(((td)->td_inhibitors & TDI_SLEEPING) != 0 ? "sleep" : 
((td)->td_inhibitors & TDI_SUSPENDED) != 0 ? "suspended" : 
((td)->td_inhibitors & TDI_SWAPPED) != 0 ? "swapped" : 
((td)->td_inhibitors & TDI_LOCK) != 0 ? "blocked" : 
((td)->td_inhibitors & TDI_IWAIT) != 0 ? "iwait" : "yielding")
probes	
thread	flags
TSA:	FreeBSD	
# ./tstates.d
Tracing scheduler events... Ctrl-C to end.
^C
Time (ms) per state:
COMM PID CPU RUNQ SLP SUS SWP LCK IWT YLD
irq14: ata0 12 0 0 0 0 0 0 0 0
irq15: ata1 12 0 0 0 0 0 0 9009 0
swi4: clock (0) 12 0 0 0 0 0 0 9761 0
usbus0 14 0 0 8005 0 0 0 0 0
[...]
sshd 807 0 0 10011 0 0 0 0 0
devd 474 0 0 9009 0 0 0 0 0
dtrace 1166 1 4 10006 0 0 0 0 0
sh 936 2 22 5648 0 0 0 0 0
rand_harvestq 6 5 38 9889 0 0 0 0 0
sh 1170 9 0 0 0 0 0 0 0
kernel 0 10 13 0 0 0 0 0 0
sshd 935 14 22 5644 0 0 0 0 0
intr 12 46 276 0 0 0 0 0 0
cksum 1076 929 28 0 480 0 0 0 0
cksum 1170 1499 1029 0 0 0 0 0 0
cksum 1169 1590 1144 0 0 0 0 0 0
idle 11 5856 999 0 0 0 0 0 0
DTrace	proof	of	concept	
hjps://github.com/brendangregg/DTrace-tools/blob/master/sched/tstates.d
On-CPU	Analysis	
1.  Split	into	user/kernel	states	
–  /proc,	vmstat(1)	
2.  Check	CPU	balance	
–  mpstat(1),	CPU	uNlizaNon	heat	map	
3.  Profile	soRware	
–  User	&	kernel	stack	sampling	(as	a	CPU	flame	graph)	
4.  Profile	cycles,	caches,	busses	
–  PMCs,	CPI	flame	graph	
CPU	UNlizaNon	
Heat	Map
CPU	Flame	Graph	Analysis	
1.  Take	a	CPU	profile	
2.  Render	it	as	a	flame	graph	
3.  Study	largest	"towers"	first	
		
Discovers	issues	by	their	CPU	usage	
-  Directly:	CPU	consumers	
-  Indirectly:	iniNalizaNon	of	I/O,	locks,	Nmes,	...	
Narrows	target	of	study	
Flame	Graph
CPU	Flame	Graphs:	FreeBSD	
•  Use	either	DTrace	or	pmcstat.	Eg,	kernel	CPU	with	DTrace:	
•  Both	user	&	kernel	CPU:	
git clone https://github.com/brendangregg/FlameGraph; cd FlameGraph
dtrace -n 'profile-99 /arg0/ { @[stack()] = count(); } tick-30s { exit(0); }' > stacks01
stackcollapse.pl < stacks01 | sed 's/kernel`//g' | ./flamegraph.pl > stacks01.svg
hjp://www.brendangregg.com/FlameGraphs/cpuflamegraphs.html#DTrace		
dtrace -x ustackframes=100 -x stackframes=100 -n '
profile-99 { @[stack(), ustack(), execname] = sum(1); }
tick-30s,END { printa("%k-%k%sn%@dn", @); trunc(@); exit(0); }' > stacks02
Java	Mixed-Mode	CPU	Flame	Graph	
Java	
Kernel	
(C)	
JVM	
(C++)	
User	
(C)	
By sampling stack traces with:
•  -XX:+PreserveFramePointer
•  Java perf-map-agent
CPI	Flame	Graph:	BSD	
A CPU flame graph (cycles) colored using instructions/stall profile data
eg, using FreeBSD pmcstat:
red	==	instrucNons	
blue	==	stalls	
hjp://www.brendangregg.com/blog/2014-10-31/cpi-flame-graphs.html
Off-CPU	Analysis	
Analyze	off-CPU	Nme	via	blocking	code	
path:	Off-CPU	flame	graph	
		
ORen	need	wakeup	code	paths	as	well…
Off-CPU	Time	Flame	Graph:	FreeBSD	
file	read	
directory	read	
missing	symbols	(stripped)	
Stack	depth	Off-CPU	Nme	
seek	 readahead	 file	read	
tar	…	>	/dev/null	
readahead
Off-CPU	Profiling:	FreeBSD	
#!/usr/sbin/dtrace -s
#pragma D option ustackframes=100
#pragma D option dynvarsize=32m
sched:::off-cpu /execname == "bsdtar"/ { self->ts = timestamp; }
sched:::on-cpu
/self->ts/
{
@[stack(), ustack(), execname] = sum(timestamp - self->ts);
self->ts = 0;
}
dtrace:::END
{
normalize(@, 1000000);
printa("%k-%k%sn%@dn", @);
}
offcpu.d	
Uses	DTrace	
Warning:	can	have	significant	overhead	
(scheduler	events	can	be	frequent)	
Change/remove	as	desired	
eg,	add	/curthread->td_state	<=	1/	to	exclude	preempt,	otherwise	sees	iCsw	
# ./offcpu.d > out.stacks
# git clone https://github.com/brendangregg/FlameGraph; cd FlameGraph
# stackcollapse.pl < ../out.stacks | sed 's/kernel`//g' | 
./flamegraph.pl --color=io --title="Off-CPU Flame Graph" --countname=ms > out.svg
Off-CPU	Time	Flame	Graph:	FreeBSD	 tar	…	|	gzip	
pipe	write	
file	read	 readahead
Wakeup	Time	Flame	Graph:	FreeBSD	
Who did the wakeup:
waker	
wakee	
user-stack	
kernel-stack
Wakeup	Profiling:	FreeBSD	
#!/usr/sbin/dtrace -s
#pragma D option quiet
#pragma D option ustackframes=100
#pragma D option dynvarsize=32m
sched:::sleep /execname == "bsdtar"/ { ts[curlwpsinfo->pr_addr] = timestamp; }
sched:::wakeup
/ts[arg0]/
{
this->delta = timestamp - ts[arg0];
@[args[1]->p_comm, stack(), ustack(), execname] = sum(this->delta);
ts[arg0] = 0;
}
dtrace:::END
{
normalize(@, 1000000);
printa("n%s%k-%k%sn%@dn", @);
}
wakeup.d	
Uses	DTrace	
Warning:	can	have	significant	overhead	
(scheduler	events	can	be	frequent)	
Change/remove	as	desired
Merging	Stacks	with	eBPF:	Linux	
Waker	task	
Waker	stack	
Blocked	stack	
Blocked	task	
Stack	
DirecNon	
Wokeup	
•  Using	enhanced	
Berkeley	Packet	Filter	
(eBPF)	to	merge	stacks	
in	kernel	context	
•  Not	available	on	BSD	
(yet)
Ye	Olde	BPF	
Berkeley	Packet	Filter	
# tcpdump host 127.0.0.1 and port 22 -d
(000) ldh [12]
(001) jeq #0x800 jt 2 jf 18
(002) ld [26]
(003) jeq #0x7f000001 jt 6 jf 4
(004) ld [30]
(005) jeq #0x7f000001 jt 6 jf 18
(006) ldb [23]
(007) jeq #0x84 jt 10 jf 8
(008) jeq #0x6 jt 10 jf 9
(009) jeq #0x11 jt 10 jf 18
(010) ldh [20]
(011) jset #0x1fff jt 18 jf 12
(012) ldxb 4*([14]&0xf)
(013) ldh [x + 14]
[...]
User-defined	bytecode	
executed	by	an	in-kernel	
sandboxed	virtual	machine	
	
Steven	McCanne	and	Van	Jacobson,	1993	
2	x	32-bit	registers	
&	scratch	memory	
OpNmizes	packet	filter	
performance
Enhanced	BPF	
aka	eBPF	or	just	"BPF"	
Alexei	Starovoitov,	2014+	
10	x	64-bit	registers	
maps	(hashes)	
stack	traces	
ac=ons
bcc/BPF	front-end	(C	&	Python)	
bcc	examples/tracing/bitehist.py
Latency	CorrelaNons	
1.  Measure	latency	histograms	at	
different	stack	layers	
2.  Compare	histograms	to	find	
latency	origin	
		
Even	bejer,	use	latency	heat	maps	
•  Match	outliers	based	on	both	latency	and	Nme
Checklists:	eg,	BSD	Perf	Analysis	in	60s	
1.  		uptime
2.  		dmesg -a | tail
3.  		vmstat 1
4.  		vmstat -P
5.  		ps -auxw
6.  		iostat -xz 1
7.  		systat -ifstat
8.  		systat -netstat
9.  		top	
10.  		systat -vmstat
load	averages	
kernel	errors	
overall	stats	by	Nme	
CPU	balance	
process	usage	
disk	I/O	
network	I/O	
TCP	stats	
process	overview	
system	overview	
adapted	from	hjp://techblog.neylix.com/2015/11/linux-performance-analysis-in-60s.html
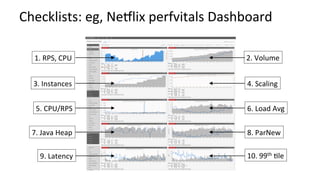
1.	RPS,	CPU	 2.	Volume	
6.	Load	Avg	
3.	Instances	 4.	Scaling	
5.	CPU/RPS	
7.	Java	Heap	 8.	ParNew	
9.	Latency	 10.	99th	Nle	
Checklists:	eg,	Neylix	perfvitals	Dashboard
StaNc	Performance	Tuning:	FreeBSD
Tools-Based	Method:	FreeBSD	
Try	all	the	tools!	
May	be	an	anN-pajern
Tools-Based	Method:	DTrace	FreeBSD	
Just	my	new	BSD	tools
Other	Methodologies	
•  ScienNfic	method	
•  5	Why's	
•  Process	of	eliminaNon	
•  Intel's	Top-Down	Methodology	
•  Method	R
What	You	Can	Do
What	you	can	do	
1.  Know	what's	now	possible	on	modern	systems	
–  Dynamic	tracing:	efficiently	instrument	any	soRware	
–  CPU	faciliNes:	PMCs,	MSRs	(model	specific	registers)	
–  VisualizaNons:	flame	graphs,	latency	heat	maps,	…	
2.  Ask	quesNons	first:	use	methodologies	to	ask	them	
3.  Then	find/build	the	metrics	
4.  Build	or	buy	dashboards	to	support	methodologies
Dynamic	Tracing:	Efficient	Metrics	
send	
receive	
tcpdump	
Kernel	
buffer	
file	system	
1.	read	
2.	dump	
Analyzer	 1.	read	
2.	process	
3.	print	
disks	
Old way: packet capture
New way: dynamic tracing
Tracer	 1.	configure	
2.	read	
tcp_retransmit_skb()	
Eg, tracing TCP retransmits
Dynamic	Tracing:	Instrument	Most	SoRware	
My	Solaris/DTrace	tools	(many	already	work	on	BSD/DTrace):
Performance	Monitoring	Counters	
Eg,	BSD	PMC	groups	for	Intel	Sandy	Bridge:
VisualizaNons	
Eg,	Disk	I/O	latency	as	a	heat	map,	quanNzed	in	kernel:	
Post	processing	the	output	of	my	iosnoop	tool:	www.brendangregg.com/HeatMaps/latency.html
Summary	
•  It	is	the	crystal	ball	age	of	performance	observability	
•  What	majers	is	the	quesNons	you	want	answered	
•  Methodologies	are	a	great	way	to	pose	quesNons	
Who
How What
Why
References	&	Resources	
•  FreeBSD	@	Neylix:	
–  hjps://openconnect.itp.neylix.com/	
–  hjp://people.freebsd.org/~scojl/Neylix-BSDCan-20130515.pdf	
–  hjp://www.youtube.com/watch?v=FL5U4wr86L4	
•  USE	Method	
–  hjp://queue.acm.org/detail.cfm?id=2413037		
–  hjp://www.brendangregg.com/usemethod.html		
•  TSA	Method	
–  hjp://www.brendangregg.com/tsamethod.html	
•  Off-CPU	Analysis	
–  hjp://www.brendangregg.com/offcpuanalysis.html	
–  hjp://www.brendangregg.com/blog/2016-01-20/ebpf-offcpu-flame-graph.html	
–  hjp://www.brendangregg.com/blog/2016-02-05/ebpf-chaingraph-prototype.html		
•  StaNc	Performance	Tuning,	Richard	Elling,	Sun	blueprint,	May	2000	
•  RED	Method:	hjp://www.slideshare.net/weaveworks/monitoring-microservices	
•  Other	system	methodologies	
–  Systems	Performance:	Enterprise	and	the	Cloud,	PrenNce	Hall	2013	
–  hjp://www.brendangregg.com/methodology.html		
–  The	Art	of	Computer	Systems	Performance	Analysis,	Jain,	R.,	1991	
•  Flame	Graphs	
–  hjp://queue.acm.org/detail.cfm?id=2927301	
–  hjp://www.brendangregg.com/flamegraphs.html	
–  hjp://techblog.neylix.com/2015/07/java-in-flames.html		
•  Latency	Heat	Maps	
–  hjp://queue.acm.org/detail.cfm?id=1809426		
–  hjp://www.brendangregg.com/HeatMaps/latency.html		
•  ARPA	Network:	hjp://www.computerhistory.org/internethistory/1960s	
•  RSTS/E	System	User's	Guide,	1985,	page	4-5	
•  DTrace:	Dynamic	Tracing	in	Oracle	Solaris,	Mac	OS	X,	and	FreeBSD,	PrenNce	Hall	2011	
•  Apollo:	hjp://www.hq.nasa.gov/office/pao/History/alsj/a11	hjp://www.hq.nasa.gov/alsj/alsj-LMdocs.html
Thank	You	
•  hjp://slideshare.net/brendangregg		
•  hjp://www.brendangregg.com	
•  bgregg@neylix.com	
•  @brendangregg	
EuroBSDcon 2017
Ad

More Related Content

What's hot (20)

Performance Wins with eBPF: Getting Started (2021)
Performance Wins with eBPF: Getting Started (2021)Performance Wins with eBPF: Getting Started (2021)
Performance Wins with eBPF: Getting Started (2021)
Brendan Gregg
 
Debugging linux kernel tools and techniques
Debugging linux kernel tools and  techniquesDebugging linux kernel tools and  techniques
Debugging linux kernel tools and techniques
Satpal Parmar
 
U-Boot - An universal bootloader
U-Boot - An universal bootloader U-Boot - An universal bootloader
U-Boot - An universal bootloader
Emertxe Information Technologies Pvt Ltd
 
Linux 4.x Tracing Tools: Using BPF Superpowers
Linux 4.x Tracing Tools: Using BPF SuperpowersLinux 4.x Tracing Tools: Using BPF Superpowers
Linux 4.x Tracing Tools: Using BPF Superpowers
Brendan Gregg
 
Linux Performance Analysis: New Tools and Old Secrets
Linux Performance Analysis: New Tools and Old SecretsLinux Performance Analysis: New Tools and Old Secrets
Linux Performance Analysis: New Tools and Old Secrets
Brendan Gregg
 
Performance Analysis Tools for Linux Kernel
Performance Analysis Tools for Linux KernelPerformance Analysis Tools for Linux Kernel
Performance Analysis Tools for Linux Kernel
lcplcp1
 
Infrastructure & System Monitoring using Prometheus
Infrastructure & System Monitoring using PrometheusInfrastructure & System Monitoring using Prometheus
Infrastructure & System Monitoring using Prometheus
Marco Pas
 
Qemu Introduction
Qemu IntroductionQemu Introduction
Qemu Introduction
Chiawei Wang
 
An Introduction To Linux
An Introduction To LinuxAn Introduction To Linux
An Introduction To Linux
Ishan A B Ambanwela
 
Java Profiling Future
Java Profiling FutureJava Profiling Future
Java Profiling Future
Jaroslav Bachorik
 
Using strace
Using straceUsing strace
Using strace
Ryan Robson
 
Blazing Performance with Flame Graphs
Blazing Performance with Flame GraphsBlazing Performance with Flame Graphs
Blazing Performance with Flame Graphs
Brendan Gregg
 
BPF: Tracing and more
BPF: Tracing and moreBPF: Tracing and more
BPF: Tracing and more
Brendan Gregg
 
Systems@Scale 2021 BPF Performance Getting Started
Systems@Scale 2021 BPF Performance Getting StartedSystems@Scale 2021 BPF Performance Getting Started
Systems@Scale 2021 BPF Performance Getting Started
Brendan Gregg
 
LISA17 Container Performance Analysis
LISA17 Container Performance AnalysisLISA17 Container Performance Analysis
LISA17 Container Performance Analysis
Brendan Gregg
 
Docker and Go: why did we decide to write Docker in Go?
Docker and Go: why did we decide to write Docker in Go?Docker and Go: why did we decide to write Docker in Go?
Docker and Go: why did we decide to write Docker in Go?
Jérôme Petazzoni
 
Kernel Recipes 2017: Using Linux perf at Netflix
Kernel Recipes 2017: Using Linux perf at NetflixKernel Recipes 2017: Using Linux perf at Netflix
Kernel Recipes 2017: Using Linux perf at Netflix
Brendan Gregg
 
Linux Internals - Part II
Linux Internals - Part IILinux Internals - Part II
Linux Internals - Part II
Emertxe Information Technologies Pvt Ltd
 
Performance Analysis: The USE Method
Performance Analysis: The USE MethodPerformance Analysis: The USE Method
Performance Analysis: The USE Method
Brendan Gregg
 
Embedded Linux Kernel - Build your custom kernel
Embedded Linux Kernel - Build your custom kernelEmbedded Linux Kernel - Build your custom kernel
Embedded Linux Kernel - Build your custom kernel
Emertxe Information Technologies Pvt Ltd
 
Performance Wins with eBPF: Getting Started (2021)
Performance Wins with eBPF: Getting Started (2021)Performance Wins with eBPF: Getting Started (2021)
Performance Wins with eBPF: Getting Started (2021)
Brendan Gregg
 
Debugging linux kernel tools and techniques
Debugging linux kernel tools and  techniquesDebugging linux kernel tools and  techniques
Debugging linux kernel tools and techniques
Satpal Parmar
 
Linux 4.x Tracing Tools: Using BPF Superpowers
Linux 4.x Tracing Tools: Using BPF SuperpowersLinux 4.x Tracing Tools: Using BPF Superpowers
Linux 4.x Tracing Tools: Using BPF Superpowers
Brendan Gregg
 
Linux Performance Analysis: New Tools and Old Secrets
Linux Performance Analysis: New Tools and Old SecretsLinux Performance Analysis: New Tools and Old Secrets
Linux Performance Analysis: New Tools and Old Secrets
Brendan Gregg
 
Performance Analysis Tools for Linux Kernel
Performance Analysis Tools for Linux KernelPerformance Analysis Tools for Linux Kernel
Performance Analysis Tools for Linux Kernel
lcplcp1
 
Infrastructure & System Monitoring using Prometheus
Infrastructure & System Monitoring using PrometheusInfrastructure & System Monitoring using Prometheus
Infrastructure & System Monitoring using Prometheus
Marco Pas
 
Blazing Performance with Flame Graphs
Blazing Performance with Flame GraphsBlazing Performance with Flame Graphs
Blazing Performance with Flame Graphs
Brendan Gregg
 
BPF: Tracing and more
BPF: Tracing and moreBPF: Tracing and more
BPF: Tracing and more
Brendan Gregg
 
Systems@Scale 2021 BPF Performance Getting Started
Systems@Scale 2021 BPF Performance Getting StartedSystems@Scale 2021 BPF Performance Getting Started
Systems@Scale 2021 BPF Performance Getting Started
Brendan Gregg
 
LISA17 Container Performance Analysis
LISA17 Container Performance AnalysisLISA17 Container Performance Analysis
LISA17 Container Performance Analysis
Brendan Gregg
 
Docker and Go: why did we decide to write Docker in Go?
Docker and Go: why did we decide to write Docker in Go?Docker and Go: why did we decide to write Docker in Go?
Docker and Go: why did we decide to write Docker in Go?
Jérôme Petazzoni
 
Kernel Recipes 2017: Using Linux perf at Netflix
Kernel Recipes 2017: Using Linux perf at NetflixKernel Recipes 2017: Using Linux perf at Netflix
Kernel Recipes 2017: Using Linux perf at Netflix
Brendan Gregg
 
Performance Analysis: The USE Method
Performance Analysis: The USE MethodPerformance Analysis: The USE Method
Performance Analysis: The USE Method
Brendan Gregg
 

Similar to EuroBSDcon 2017 System Performance Analysis Methodologies (20)

Open Source Systems Performance
Open Source Systems PerformanceOpen Source Systems Performance
Open Source Systems Performance
Brendan Gregg
 
ACM Applicative System Methodology 2016
ACM Applicative System Methodology 2016ACM Applicative System Methodology 2016
ACM Applicative System Methodology 2016
Brendan Gregg
 
Performance Analysis: new tools and concepts from the cloud
Performance Analysis: new tools and concepts from the cloudPerformance Analysis: new tools and concepts from the cloud
Performance Analysis: new tools and concepts from the cloud
Brendan Gregg
 
Analyzing OS X Systems Performance with the USE Method
Analyzing OS X Systems Performance with the USE MethodAnalyzing OS X Systems Performance with the USE Method
Analyzing OS X Systems Performance with the USE Method
Brendan Gregg
 
Linux Performance Tools
Linux Performance ToolsLinux Performance Tools
Linux Performance Tools
Brendan Gregg
 
Jörg Schad - NO ONE PUTS Java IN THE CONTAINER - Codemotion Milan 2017
Jörg Schad - NO ONE PUTS Java IN THE CONTAINER - Codemotion Milan 2017Jörg Schad - NO ONE PUTS Java IN THE CONTAINER - Codemotion Milan 2017
Jörg Schad - NO ONE PUTS Java IN THE CONTAINER - Codemotion Milan 2017
Codemotion
 
Performance analysis in a multitenant cloud environment Using Hadoop Cluster ...
Performance analysis in a multitenant cloud environment Using Hadoop Cluster ...Performance analysis in a multitenant cloud environment Using Hadoop Cluster ...
Performance analysis in a multitenant cloud environment Using Hadoop Cluster ...
Orgad Kimchi
 
Linux Performance Tools 2014
Linux Performance Tools 2014Linux Performance Tools 2014
Linux Performance Tools 2014
Brendan Gregg
 
IO_Analysis_with_SAR.ppt
IO_Analysis_with_SAR.pptIO_Analysis_with_SAR.ppt
IO_Analysis_with_SAR.ppt
cookie1969
 
SREcon 2016 Performance Checklists for SREs
SREcon 2016 Performance Checklists for SREsSREcon 2016 Performance Checklists for SREs
SREcon 2016 Performance Checklists for SREs
Brendan Gregg
 
My First 100 days with an Exadata (PPT)
My First 100 days with an Exadata (PPT)My First 100 days with an Exadata (PPT)
My First 100 days with an Exadata (PPT)
Gustavo Rene Antunez
 
System Device Tree and Lopper: Concrete Examples - ELC NA 2022
System Device Tree and Lopper: Concrete Examples - ELC NA 2022System Device Tree and Lopper: Concrete Examples - ELC NA 2022
System Device Tree and Lopper: Concrete Examples - ELC NA 2022
Stefano Stabellini
 
Andy Davis' Black Hat USA Presentation Revealing embedded fingerprints
Andy Davis' Black Hat USA Presentation Revealing embedded fingerprintsAndy Davis' Black Hat USA Presentation Revealing embedded fingerprints
Andy Davis' Black Hat USA Presentation Revealing embedded fingerprints
NCC Group
 
CPN302 your-linux-ami-optimization-and-performance
CPN302 your-linux-ami-optimization-and-performanceCPN302 your-linux-ami-optimization-and-performance
CPN302 your-linux-ami-optimization-and-performance
Coburn Watson
 
Lecture 4 Cluster Computing
Lecture 4 Cluster ComputingLecture 4 Cluster Computing
Lecture 4 Cluster Computing
Dr. Shaikh A.Khalique
 
hacking-embedded-devices.pptx
hacking-embedded-devices.pptxhacking-embedded-devices.pptx
hacking-embedded-devices.pptx
ssuserfcf43f
 
Testing kubernetes and_open_shift_at_scale_20170209
Testing kubernetes and_open_shift_at_scale_20170209Testing kubernetes and_open_shift_at_scale_20170209
Testing kubernetes and_open_shift_at_scale_20170209
mffiedler
 
Troubleshooting Complex Performance issues - Oracle SEG$ contention
Troubleshooting Complex Performance issues - Oracle SEG$ contentionTroubleshooting Complex Performance issues - Oracle SEG$ contention
Troubleshooting Complex Performance issues - Oracle SEG$ contention
Tanel Poder
 
Containers with systemd-nspawn
Containers with systemd-nspawnContainers with systemd-nspawn
Containers with systemd-nspawn
Gábor Nyers
 
Spark Summit EU talk by Jorg Schad
Spark Summit EU talk by Jorg SchadSpark Summit EU talk by Jorg Schad
Spark Summit EU talk by Jorg Schad
Spark Summit
 
Open Source Systems Performance
Open Source Systems PerformanceOpen Source Systems Performance
Open Source Systems Performance
Brendan Gregg
 
ACM Applicative System Methodology 2016
ACM Applicative System Methodology 2016ACM Applicative System Methodology 2016
ACM Applicative System Methodology 2016
Brendan Gregg
 
Performance Analysis: new tools and concepts from the cloud
Performance Analysis: new tools and concepts from the cloudPerformance Analysis: new tools and concepts from the cloud
Performance Analysis: new tools and concepts from the cloud
Brendan Gregg
 
Analyzing OS X Systems Performance with the USE Method
Analyzing OS X Systems Performance with the USE MethodAnalyzing OS X Systems Performance with the USE Method
Analyzing OS X Systems Performance with the USE Method
Brendan Gregg
 
Linux Performance Tools
Linux Performance ToolsLinux Performance Tools
Linux Performance Tools
Brendan Gregg
 
Jörg Schad - NO ONE PUTS Java IN THE CONTAINER - Codemotion Milan 2017
Jörg Schad - NO ONE PUTS Java IN THE CONTAINER - Codemotion Milan 2017Jörg Schad - NO ONE PUTS Java IN THE CONTAINER - Codemotion Milan 2017
Jörg Schad - NO ONE PUTS Java IN THE CONTAINER - Codemotion Milan 2017
Codemotion
 
Performance analysis in a multitenant cloud environment Using Hadoop Cluster ...
Performance analysis in a multitenant cloud environment Using Hadoop Cluster ...Performance analysis in a multitenant cloud environment Using Hadoop Cluster ...
Performance analysis in a multitenant cloud environment Using Hadoop Cluster ...
Orgad Kimchi
 
Linux Performance Tools 2014
Linux Performance Tools 2014Linux Performance Tools 2014
Linux Performance Tools 2014
Brendan Gregg
 
IO_Analysis_with_SAR.ppt
IO_Analysis_with_SAR.pptIO_Analysis_with_SAR.ppt
IO_Analysis_with_SAR.ppt
cookie1969
 
SREcon 2016 Performance Checklists for SREs
SREcon 2016 Performance Checklists for SREsSREcon 2016 Performance Checklists for SREs
SREcon 2016 Performance Checklists for SREs
Brendan Gregg
 
My First 100 days with an Exadata (PPT)
My First 100 days with an Exadata (PPT)My First 100 days with an Exadata (PPT)
My First 100 days with an Exadata (PPT)
Gustavo Rene Antunez
 
System Device Tree and Lopper: Concrete Examples - ELC NA 2022
System Device Tree and Lopper: Concrete Examples - ELC NA 2022System Device Tree and Lopper: Concrete Examples - ELC NA 2022
System Device Tree and Lopper: Concrete Examples - ELC NA 2022
Stefano Stabellini
 
Andy Davis' Black Hat USA Presentation Revealing embedded fingerprints
Andy Davis' Black Hat USA Presentation Revealing embedded fingerprintsAndy Davis' Black Hat USA Presentation Revealing embedded fingerprints
Andy Davis' Black Hat USA Presentation Revealing embedded fingerprints
NCC Group
 
CPN302 your-linux-ami-optimization-and-performance
CPN302 your-linux-ami-optimization-and-performanceCPN302 your-linux-ami-optimization-and-performance
CPN302 your-linux-ami-optimization-and-performance
Coburn Watson
 
hacking-embedded-devices.pptx
hacking-embedded-devices.pptxhacking-embedded-devices.pptx
hacking-embedded-devices.pptx
ssuserfcf43f
 
Testing kubernetes and_open_shift_at_scale_20170209
Testing kubernetes and_open_shift_at_scale_20170209Testing kubernetes and_open_shift_at_scale_20170209
Testing kubernetes and_open_shift_at_scale_20170209
mffiedler
 
Troubleshooting Complex Performance issues - Oracle SEG$ contention
Troubleshooting Complex Performance issues - Oracle SEG$ contentionTroubleshooting Complex Performance issues - Oracle SEG$ contention
Troubleshooting Complex Performance issues - Oracle SEG$ contention
Tanel Poder
 
Containers with systemd-nspawn
Containers with systemd-nspawnContainers with systemd-nspawn
Containers with systemd-nspawn
Gábor Nyers
 
Spark Summit EU talk by Jorg Schad
Spark Summit EU talk by Jorg SchadSpark Summit EU talk by Jorg Schad
Spark Summit EU talk by Jorg Schad
Spark Summit
 
Ad

More from Brendan Gregg (20)

YOW2021 Computing Performance
YOW2021 Computing PerformanceYOW2021 Computing Performance
YOW2021 Computing Performance
Brendan Gregg
 
IntelON 2021 Processor Benchmarking
IntelON 2021 Processor BenchmarkingIntelON 2021 Processor Benchmarking
IntelON 2021 Processor Benchmarking
Brendan Gregg
 
Computing Performance: On the Horizon (2021)
Computing Performance: On the Horizon (2021)Computing Performance: On the Horizon (2021)
Computing Performance: On the Horizon (2021)
Brendan Gregg
 
BPF Internals (eBPF)
BPF Internals (eBPF)BPF Internals (eBPF)
BPF Internals (eBPF)
Brendan Gregg
 
Performance Wins with BPF: Getting Started
Performance Wins with BPF: Getting StartedPerformance Wins with BPF: Getting Started
Performance Wins with BPF: Getting Started
Brendan Gregg
 
YOW2020 Linux Systems Performance
YOW2020 Linux Systems PerformanceYOW2020 Linux Systems Performance
YOW2020 Linux Systems Performance
Brendan Gregg
 
re:Invent 2019 BPF Performance Analysis at Netflix
re:Invent 2019 BPF Performance Analysis at Netflixre:Invent 2019 BPF Performance Analysis at Netflix
re:Invent 2019 BPF Performance Analysis at Netflix
Brendan Gregg
 
UM2019 Extended BPF: A New Type of Software
UM2019 Extended BPF: A New Type of SoftwareUM2019 Extended BPF: A New Type of Software
UM2019 Extended BPF: A New Type of Software
Brendan Gregg
 
LPC2019 BPF Tracing Tools
LPC2019 BPF Tracing ToolsLPC2019 BPF Tracing Tools
LPC2019 BPF Tracing Tools
Brendan Gregg
 
LSFMM 2019 BPF Observability
LSFMM 2019 BPF ObservabilityLSFMM 2019 BPF Observability
LSFMM 2019 BPF Observability
Brendan Gregg
 
YOW2018 CTO Summit: Working at netflix
YOW2018 CTO Summit: Working at netflixYOW2018 CTO Summit: Working at netflix
YOW2018 CTO Summit: Working at netflix
Brendan Gregg
 
eBPF Perf Tools 2019
eBPF Perf Tools 2019eBPF Perf Tools 2019
eBPF Perf Tools 2019
Brendan Gregg
 
YOW2018 Cloud Performance Root Cause Analysis at Netflix
YOW2018 Cloud Performance Root Cause Analysis at NetflixYOW2018 Cloud Performance Root Cause Analysis at Netflix
YOW2018 Cloud Performance Root Cause Analysis at Netflix
Brendan Gregg
 
BPF Tools 2017
BPF Tools 2017BPF Tools 2017
BPF Tools 2017
Brendan Gregg
 
NetConf 2018 BPF Observability
NetConf 2018 BPF ObservabilityNetConf 2018 BPF Observability
NetConf 2018 BPF Observability
Brendan Gregg
 
FlameScope 2018
FlameScope 2018FlameScope 2018
FlameScope 2018
Brendan Gregg
 
ATO Linux Performance 2018
ATO Linux Performance 2018ATO Linux Performance 2018
ATO Linux Performance 2018
Brendan Gregg
 
Linux Performance 2018 (PerconaLive keynote)
Linux Performance 2018 (PerconaLive keynote)Linux Performance 2018 (PerconaLive keynote)
Linux Performance 2018 (PerconaLive keynote)
Brendan Gregg
 
How Netflix Tunes EC2 Instances for Performance
How Netflix Tunes EC2 Instances for PerformanceHow Netflix Tunes EC2 Instances for Performance
How Netflix Tunes EC2 Instances for Performance
Brendan Gregg
 
Kernel Recipes 2017: Performance Analysis with BPF
Kernel Recipes 2017: Performance Analysis with BPFKernel Recipes 2017: Performance Analysis with BPF
Kernel Recipes 2017: Performance Analysis with BPF
Brendan Gregg
 
YOW2021 Computing Performance
YOW2021 Computing PerformanceYOW2021 Computing Performance
YOW2021 Computing Performance
Brendan Gregg
 
IntelON 2021 Processor Benchmarking
IntelON 2021 Processor BenchmarkingIntelON 2021 Processor Benchmarking
IntelON 2021 Processor Benchmarking
Brendan Gregg
 
Computing Performance: On the Horizon (2021)
Computing Performance: On the Horizon (2021)Computing Performance: On the Horizon (2021)
Computing Performance: On the Horizon (2021)
Brendan Gregg
 
BPF Internals (eBPF)
BPF Internals (eBPF)BPF Internals (eBPF)
BPF Internals (eBPF)
Brendan Gregg
 
Performance Wins with BPF: Getting Started
Performance Wins with BPF: Getting StartedPerformance Wins with BPF: Getting Started
Performance Wins with BPF: Getting Started
Brendan Gregg
 
YOW2020 Linux Systems Performance
YOW2020 Linux Systems PerformanceYOW2020 Linux Systems Performance
YOW2020 Linux Systems Performance
Brendan Gregg
 
re:Invent 2019 BPF Performance Analysis at Netflix
re:Invent 2019 BPF Performance Analysis at Netflixre:Invent 2019 BPF Performance Analysis at Netflix
re:Invent 2019 BPF Performance Analysis at Netflix
Brendan Gregg
 
UM2019 Extended BPF: A New Type of Software
UM2019 Extended BPF: A New Type of SoftwareUM2019 Extended BPF: A New Type of Software
UM2019 Extended BPF: A New Type of Software
Brendan Gregg
 
LPC2019 BPF Tracing Tools
LPC2019 BPF Tracing ToolsLPC2019 BPF Tracing Tools
LPC2019 BPF Tracing Tools
Brendan Gregg
 
LSFMM 2019 BPF Observability
LSFMM 2019 BPF ObservabilityLSFMM 2019 BPF Observability
LSFMM 2019 BPF Observability
Brendan Gregg
 
YOW2018 CTO Summit: Working at netflix
YOW2018 CTO Summit: Working at netflixYOW2018 CTO Summit: Working at netflix
YOW2018 CTO Summit: Working at netflix
Brendan Gregg
 
eBPF Perf Tools 2019
eBPF Perf Tools 2019eBPF Perf Tools 2019
eBPF Perf Tools 2019
Brendan Gregg
 
YOW2018 Cloud Performance Root Cause Analysis at Netflix
YOW2018 Cloud Performance Root Cause Analysis at NetflixYOW2018 Cloud Performance Root Cause Analysis at Netflix
YOW2018 Cloud Performance Root Cause Analysis at Netflix
Brendan Gregg
 
NetConf 2018 BPF Observability
NetConf 2018 BPF ObservabilityNetConf 2018 BPF Observability
NetConf 2018 BPF Observability
Brendan Gregg
 
ATO Linux Performance 2018
ATO Linux Performance 2018ATO Linux Performance 2018
ATO Linux Performance 2018
Brendan Gregg
 
Linux Performance 2018 (PerconaLive keynote)
Linux Performance 2018 (PerconaLive keynote)Linux Performance 2018 (PerconaLive keynote)
Linux Performance 2018 (PerconaLive keynote)
Brendan Gregg
 
How Netflix Tunes EC2 Instances for Performance
How Netflix Tunes EC2 Instances for PerformanceHow Netflix Tunes EC2 Instances for Performance
How Netflix Tunes EC2 Instances for Performance
Brendan Gregg
 
Kernel Recipes 2017: Performance Analysis with BPF
Kernel Recipes 2017: Performance Analysis with BPFKernel Recipes 2017: Performance Analysis with BPF
Kernel Recipes 2017: Performance Analysis with BPF
Brendan Gregg
 
Ad

Recently uploaded (20)

Electronic_Mail_Attacks-1-35.pdf by xploit
Electronic_Mail_Attacks-1-35.pdf by xploitElectronic_Mail_Attacks-1-35.pdf by xploit
Electronic_Mail_Attacks-1-35.pdf by xploit
niftliyevhuseyn
 
Andrew Marnell: Transforming Business Strategy Through Data-Driven Insights
Andrew Marnell: Transforming Business Strategy Through Data-Driven InsightsAndrew Marnell: Transforming Business Strategy Through Data-Driven Insights
Andrew Marnell: Transforming Business Strategy Through Data-Driven Insights
Andrew Marnell
 
What is Model Context Protocol(MCP) - The new technology for communication bw...
What is Model Context Protocol(MCP) - The new technology for communication bw...What is Model Context Protocol(MCP) - The new technology for communication bw...
What is Model Context Protocol(MCP) - The new technology for communication bw...
Vishnu Singh Chundawat
 
Manifest Pre-Seed Update | A Humanoid OEM Deeptech In France
Manifest Pre-Seed Update | A Humanoid OEM Deeptech In FranceManifest Pre-Seed Update | A Humanoid OEM Deeptech In France
Manifest Pre-Seed Update | A Humanoid OEM Deeptech In France
chb3
 
Transcript: #StandardsGoals for 2025: Standards & certification roundup - Tec...
Transcript: #StandardsGoals for 2025: Standards & certification roundup - Tec...Transcript: #StandardsGoals for 2025: Standards & certification roundup - Tec...
Transcript: #StandardsGoals for 2025: Standards & certification roundup - Tec...
BookNet Canada
 
Special Meetup Edition - TDX Bengaluru Meetup #52.pptx
Special Meetup Edition - TDX Bengaluru Meetup #52.pptxSpecial Meetup Edition - TDX Bengaluru Meetup #52.pptx
Special Meetup Edition - TDX Bengaluru Meetup #52.pptx
shyamraj55
 
Procurement Insights Cost To Value Guide.pptx
Procurement Insights Cost To Value Guide.pptxProcurement Insights Cost To Value Guide.pptx
Procurement Insights Cost To Value Guide.pptx
Jon Hansen
 
Splunk Security Update | Public Sector Summit Germany 2025
Splunk Security Update | Public Sector Summit Germany 2025Splunk Security Update | Public Sector Summit Germany 2025
Splunk Security Update | Public Sector Summit Germany 2025
Splunk
 
IEDM 2024 Tutorial2_Advances in CMOS Technologies and Future Directions for C...
IEDM 2024 Tutorial2_Advances in CMOS Technologies and Future Directions for C...IEDM 2024 Tutorial2_Advances in CMOS Technologies and Future Directions for C...
IEDM 2024 Tutorial2_Advances in CMOS Technologies and Future Directions for C...
organizerofv
 
Rusty Waters: Elevating Lakehouses Beyond Spark
Rusty Waters: Elevating Lakehouses Beyond SparkRusty Waters: Elevating Lakehouses Beyond Spark
Rusty Waters: Elevating Lakehouses Beyond Spark
carlyakerly1
 
2025-05-Q4-2024-Investor-Presentation.pptx
2025-05-Q4-2024-Investor-Presentation.pptx2025-05-Q4-2024-Investor-Presentation.pptx
2025-05-Q4-2024-Investor-Presentation.pptx
Samuele Fogagnolo
 
Generative Artificial Intelligence (GenAI) in Business
Generative Artificial Intelligence (GenAI) in BusinessGenerative Artificial Intelligence (GenAI) in Business
Generative Artificial Intelligence (GenAI) in Business
Dr. Tathagat Varma
 
Role of Data Annotation Services in AI-Powered Manufacturing
Role of Data Annotation Services in AI-Powered ManufacturingRole of Data Annotation Services in AI-Powered Manufacturing
Role of Data Annotation Services in AI-Powered Manufacturing
Andrew Leo
 
tecnologias de las primeras civilizaciones.pdf
tecnologias de las primeras civilizaciones.pdftecnologias de las primeras civilizaciones.pdf
tecnologias de las primeras civilizaciones.pdf
fjgm517
 
Quantum Computing Quick Research Guide by Arthur Morgan
Quantum Computing Quick Research Guide by Arthur MorganQuantum Computing Quick Research Guide by Arthur Morgan
Quantum Computing Quick Research Guide by Arthur Morgan
Arthur Morgan
 
How Can I use the AI Hype in my Business Context?
How Can I use the AI Hype in my Business Context?How Can I use the AI Hype in my Business Context?
How Can I use the AI Hype in my Business Context?
Daniel Lehner
 
How analogue intelligence complements AI
How analogue intelligence complements AIHow analogue intelligence complements AI
How analogue intelligence complements AI
Paul Rowe
 
Semantic Cultivators : The Critical Future Role to Enable AI
Semantic Cultivators : The Critical Future Role to Enable AISemantic Cultivators : The Critical Future Role to Enable AI
Semantic Cultivators : The Critical Future Role to Enable AI
artmondano
 
Massive Power Outage Hits Spain, Portugal, and France: Causes, Impact, and On...
Massive Power Outage Hits Spain, Portugal, and France: Causes, Impact, and On...Massive Power Outage Hits Spain, Portugal, and France: Causes, Impact, and On...
Massive Power Outage Hits Spain, Portugal, and France: Causes, Impact, and On...
Aqusag Technologies
 
Into The Box Conference Keynote Day 1 (ITB2025)
Into The Box Conference Keynote Day 1 (ITB2025)Into The Box Conference Keynote Day 1 (ITB2025)
Into The Box Conference Keynote Day 1 (ITB2025)
Ortus Solutions, Corp
 
Electronic_Mail_Attacks-1-35.pdf by xploit
Electronic_Mail_Attacks-1-35.pdf by xploitElectronic_Mail_Attacks-1-35.pdf by xploit
Electronic_Mail_Attacks-1-35.pdf by xploit
niftliyevhuseyn
 
Andrew Marnell: Transforming Business Strategy Through Data-Driven Insights
Andrew Marnell: Transforming Business Strategy Through Data-Driven InsightsAndrew Marnell: Transforming Business Strategy Through Data-Driven Insights
Andrew Marnell: Transforming Business Strategy Through Data-Driven Insights
Andrew Marnell
 
What is Model Context Protocol(MCP) - The new technology for communication bw...
What is Model Context Protocol(MCP) - The new technology for communication bw...What is Model Context Protocol(MCP) - The new technology for communication bw...
What is Model Context Protocol(MCP) - The new technology for communication bw...
Vishnu Singh Chundawat
 
Manifest Pre-Seed Update | A Humanoid OEM Deeptech In France
Manifest Pre-Seed Update | A Humanoid OEM Deeptech In FranceManifest Pre-Seed Update | A Humanoid OEM Deeptech In France
Manifest Pre-Seed Update | A Humanoid OEM Deeptech In France
chb3
 
Transcript: #StandardsGoals for 2025: Standards & certification roundup - Tec...
Transcript: #StandardsGoals for 2025: Standards & certification roundup - Tec...Transcript: #StandardsGoals for 2025: Standards & certification roundup - Tec...
Transcript: #StandardsGoals for 2025: Standards & certification roundup - Tec...
BookNet Canada
 
Special Meetup Edition - TDX Bengaluru Meetup #52.pptx
Special Meetup Edition - TDX Bengaluru Meetup #52.pptxSpecial Meetup Edition - TDX Bengaluru Meetup #52.pptx
Special Meetup Edition - TDX Bengaluru Meetup #52.pptx
shyamraj55
 
Procurement Insights Cost To Value Guide.pptx
Procurement Insights Cost To Value Guide.pptxProcurement Insights Cost To Value Guide.pptx
Procurement Insights Cost To Value Guide.pptx
Jon Hansen
 
Splunk Security Update | Public Sector Summit Germany 2025
Splunk Security Update | Public Sector Summit Germany 2025Splunk Security Update | Public Sector Summit Germany 2025
Splunk Security Update | Public Sector Summit Germany 2025
Splunk
 
IEDM 2024 Tutorial2_Advances in CMOS Technologies and Future Directions for C...
IEDM 2024 Tutorial2_Advances in CMOS Technologies and Future Directions for C...IEDM 2024 Tutorial2_Advances in CMOS Technologies and Future Directions for C...
IEDM 2024 Tutorial2_Advances in CMOS Technologies and Future Directions for C...
organizerofv
 
Rusty Waters: Elevating Lakehouses Beyond Spark
Rusty Waters: Elevating Lakehouses Beyond SparkRusty Waters: Elevating Lakehouses Beyond Spark
Rusty Waters: Elevating Lakehouses Beyond Spark
carlyakerly1
 
2025-05-Q4-2024-Investor-Presentation.pptx
2025-05-Q4-2024-Investor-Presentation.pptx2025-05-Q4-2024-Investor-Presentation.pptx
2025-05-Q4-2024-Investor-Presentation.pptx
Samuele Fogagnolo
 
Generative Artificial Intelligence (GenAI) in Business
Generative Artificial Intelligence (GenAI) in BusinessGenerative Artificial Intelligence (GenAI) in Business
Generative Artificial Intelligence (GenAI) in Business
Dr. Tathagat Varma
 
Role of Data Annotation Services in AI-Powered Manufacturing
Role of Data Annotation Services in AI-Powered ManufacturingRole of Data Annotation Services in AI-Powered Manufacturing
Role of Data Annotation Services in AI-Powered Manufacturing
Andrew Leo
 
tecnologias de las primeras civilizaciones.pdf
tecnologias de las primeras civilizaciones.pdftecnologias de las primeras civilizaciones.pdf
tecnologias de las primeras civilizaciones.pdf
fjgm517
 
Quantum Computing Quick Research Guide by Arthur Morgan
Quantum Computing Quick Research Guide by Arthur MorganQuantum Computing Quick Research Guide by Arthur Morgan
Quantum Computing Quick Research Guide by Arthur Morgan
Arthur Morgan
 
How Can I use the AI Hype in my Business Context?
How Can I use the AI Hype in my Business Context?How Can I use the AI Hype in my Business Context?
How Can I use the AI Hype in my Business Context?
Daniel Lehner
 
How analogue intelligence complements AI
How analogue intelligence complements AIHow analogue intelligence complements AI
How analogue intelligence complements AI
Paul Rowe
 
Semantic Cultivators : The Critical Future Role to Enable AI
Semantic Cultivators : The Critical Future Role to Enable AISemantic Cultivators : The Critical Future Role to Enable AI
Semantic Cultivators : The Critical Future Role to Enable AI
artmondano
 
Massive Power Outage Hits Spain, Portugal, and France: Causes, Impact, and On...
Massive Power Outage Hits Spain, Portugal, and France: Causes, Impact, and On...Massive Power Outage Hits Spain, Portugal, and France: Causes, Impact, and On...
Massive Power Outage Hits Spain, Portugal, and France: Causes, Impact, and On...
Aqusag Technologies
 
Into The Box Conference Keynote Day 1 (ITB2025)
Into The Box Conference Keynote Day 1 (ITB2025)Into The Box Conference Keynote Day 1 (ITB2025)
Into The Box Conference Keynote Day 1 (ITB2025)
Ortus Solutions, Corp
 

EuroBSDcon 2017 System Performance Analysis Methodologies