MS Excel 2010 tutorial 6
3 likes2,864 views

Sparklines allow small charts to be placed within worksheet cells to provide a visual representation of data trends. PivotTables in Excel 2010 have improved performance and new features like repeating labels. The new Slicer feature allows intuitive filtering of large amounts of data in PivotTables and PivotCharts. PowerPivot is a new add-in that provides powerful data analysis tools within Excel. Charts in Excel can now be created by selecting a chart type on the Insert tab rather than using the chart wizard. Basic chart customization options include moving charts to new sheets, changing names, layouts, styles, and adding titles and data labels.


Ad
More Related Content
What's hot (20)
Viewers also liked (20)


Ad
Similar to MS Excel 2010 tutorial 6 (20)


Ad
More from Khalfan Alshuaili (20)


Recently uploaded (20)


MS Excel 2010 tutorial 6
- 1. MS Excel 2010 representing data Analyze your data quickly and effectively. Sparklines New! Sometimes, numbers speak for themselves. At other times, charts or graphs can significantly clarify your information. With Excel 2010, you can take advantages of numbers and charts within the same cell. Sparklines are small charts in a worksheet cell that provide a clear and compact visual representation of your data for quick and easy reference. Use Sparklines to show trends in a series of values, such as seasonal increases, the price of your home, or your monthly expenditures. Highlight maximum or minimum values and increase impact by positioning a Sparkline next to its corresponding data. Quick Tips: Quickly create Sparklines: Select the location for your Sparkline, on the Insert tab, in the Sparklines group, choose the type of chart you want: Line, Column, or Win/Loss, and select the values for the data range. To format a Sparkline independently of a Sparkline group, select the Sparkline and on the Sparkline Tools Design tab, click Ungroup. PivotTable Views Improved! PivotTable views are easier and faster to use in Excel 2010. Along with improved
- 2. performance that helps speed up data retrieval, sorting, and filtering, you’ll find these additional enhancements and more: Repeating labels. In previous versions of Excel, when you use more than one field as a row label in your PivotTable, only the first occurrence of the row label will display. In Excel 2010, you can now use Repeat All Item Labels, found on the PivotTable Tools Design tab, in the Report Layout options, in to repeat the row label for each corresponding value. This enhanced ability enables you to utilize PivotTable data in functions, such as VLOOKUP, INDEX, and MATCH. New Show Values As calculations. Excel 2010 has added six new calculations for analyzing your PivotTable data. Now display % of Parent Row Total, % of Parent Column Total, % of Parent Total, % of Running Total In, Rank Smallest to Largest, or Rank Largest to Smallest. Quick Tip: Now it’s even easier to try out different calculations in your PivotTable. Right-click a value field in your PivotTable and point to Show Values As to display a list of calculations that were only previously available in the Value Field Settings dialog box. You can also find Show Values As on the PivotTable Tools Options tab in the Calculations group. PivotChart Interactivity Improved! Excel 2010 takes the popular PivotChart, used for visual analysis and reporting, one step further. You can now filter directly on your PivotChart using new interactive buttons. Stay in control of what you see on your screen and make filtering more accessible. Hide all interactive buttons for printing purposes or hide individual buttons that may not apply to your filtering needs. Quick Tip: After you filter your PivotChart the interactive buttons will display a filter icon
- 3. just as the PivotTable does today. Slicer New! Collecting useful and detailed data is only half of the equation for data analysis. The other half is having the right tools in place to help you better understand your data. Enhanced PivotTable and PivotChart filtering in Excel 2010 lets you intuitively filter large amounts of data through the new Slicer feature. Quickly find the relevant information you need and clearly see which items you are filtering in your report. Filter on the fly. Your Slicer will dynamically change and update as data in underlying PivotTable or PivotChart changes. Place your Slicers where you want them. A Slicer can be moved around and resized like a chart or a graph so you can control the look of your report. Filter on multiple fields. Connect multiple Slicers to a PivotTable or PivotChart and increase your filtering capabilities.
- 4. Quick Tips: Display Slicer list items in multiple columns. Select the Slicer and on the Slicer Tools Options tab, in the Buttons group, modify the Columns count. Find a variety of additional formatting options for your selected Slicer on the Slicer Tools Options tab. Choose from a gallery of Slicer Styles that match your Office theme or when working with multiple Slicers, use the options in the Arrange group to quickly align and group your Slicers. PowerPivot for Excel 2010 New! PowerPivot for Excel 2010, a free add-in, is a data analysis tool that delivers unmatched computational power directly within the application users already know and love— Microsoft Excel. With PowerPivot, you can transform enormous quantities of data into meaningful information to get the answers you need in seconds. You can effortlessly share your findings with others and IT departments can improve operational efficiencies through SharePoint-based management tools.
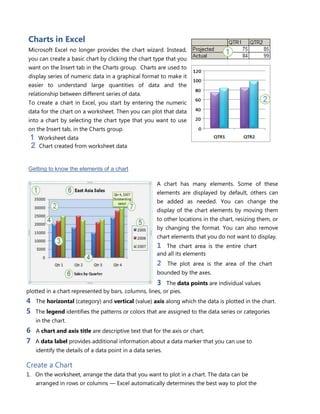
- 5. Charts in Excel Microsoft Excel no longer provides the chart wizard. Instead, you can create a basic chart by clicking the chart type that you want on the Insert tab in the Charts group. Charts are used to display series of numeric data in a graphical format to make it easier to understand large quantities of data and the relationship between different series of data. To create a chart in Excel, you start by entering the numeric data for the chart on a worksheet. Then you can plot that data into a chart by selecting the chart type that you want to use on the Insert tab, in the Charts group. Worksheet data Chart created from worksheet data Getting to know the elements of a chart A chart has many elements. Some of these elements are displayed by default, others can be added as needed. You can change the display of the chart elements by moving them to other locations in the chart, resizing them, or by changing the format. You can also remove chart elements that you do not want to display. 1 The chart area is the entire chart and all its elements 2 The plot area is the area of the chart bounded by the axes. 3 The data points are individual values plotted in a chart represented by bars, columns, lines, or pies. 4 The horizontal (category) and vertical (value) axis along which the data is plotted in the chart. 5 The legend identifies the patterns or colors that are assigned to the data series or categories in the chart. 6 A chart and axis title are descriptive text that for the axis or chart. 7 A data label provides additional information about a data marker that you can use to identify the details of a data point in a data series. Create a Chart 1. On the worksheet, arrange the data that you want to plot in a chart. The data can be arranged in rows or columns — Excel automatically determines the best way to plot the
- 6. data in the chart. 2. Select the cells that contain the data that you want to use for the chart. NOTE: If the cells that you want to plot in a chart are not in a continuous range, you can select nonadjacent cells or ranges as long as the selection forms a rectangle. You can also hide the rows or columns that you do not want to plot in the chart. 3. Go to the Insert tab, in the Charts 4. Click the chart type, and then click a chart subtype from the drop menu that will appear. 5. Click anywhere in the embedded chart to activate it. When you click on the chart, Chart Tools will be displayed which includes the Design, Layout, and Format tabs. 6. The chart will automatically be embedded in the worksheet. A chart name will automatically be assigned.
- 7. Move Chart to New Sheet 1. On the Design tab, in the Location group, click Move Chart. 2. Under Choose where you want the chart to be placed, click on the New sheet bubble 3. Type a chart name in the New sheet box. Change Chart Name 1. Click the chart. 2. On the Layout tab, in the Properties group, click the Chart Name text box. 3. Type a new chart name. 4. Press ENTER. Change Chart Layout 1. Click anywhere in the chart. 2. Go to the Chart Tools, the Design group 3. In the Chart Layouts, click the chart layout that you want to use. To see all available layouts, click More . Change Chart Style 1. Click anywhere in the chart. 2. On the Design tab, in the Chart Styles group, click the chart style that you want to use. To see all predefined chart styles, click More . Chart or Axis Titles To make a chart easier to understand, you can add titles, such as chart and axis titles. To add a chart title: 1. Click anywhere in the chart. 2. On the Layout tab, in the Labels group, click Chart Title. 3. Click Centered Overlay Title or Above Chart. 4. In the Chart Title text box that appears in the chart, type the text that you want. 5. To remove a chart title, click Chart Title, and then click None.
- 8. NOTE: You can also use the formatting buttons on the ribbon (Home tab, Font group). To format the whole title, you can right-click it, click Format Chart Title, and then select the formatting options that you want. To add axis titles: 1. Click anywhere in the chart. 2. On the Layout tab, in the Labels group, click Axis Titles. 3. Do one or more of the following: a. To add a title to a primary horizontal (category) axis, click Primary Horizontal Axis Title, and then click the option that you want. b. To add a title to primary vertical (value) axis, click Primary Vertical Axis Title, and then click the option that you want. 4. In the Axis Title text box that appears in the chart, type the text that you want. 5. To remove an axis title, click Axis Title, click the type of axis title to remove, and then click None. Data Labels 1. On a chart, do one of the following: a. Click on the chart area to add a data label to all data points of all data series b. Click in the data series to add a data label to all data points of a data series c. Click on a specific data point to add a data label to a single data point in a data series 2. On the Layout tab, in the Labels group, click Data Labels, and then click the display option that you want. 3. Text boxes will appear in the area of your chart based on your selection. 4. Click on the text box to modify the text. 5. To remove data labels, click Data Labels, and then click None. NOTE: Depending on the chart type that you used, different data label options will be available.
- 9. Legend When you create a chart, the legend appears, but you can hide the legend or change its location after you create the chart. 1. Click the chart in which you want to show or hide a legend. 2. On the Layout tab, in the Labels group, click Legend. 3. Do one of the following: a. To hide the legend, click None. b. To display a legend, click the display option that you want. c. For additional options, click More Legend Options, and then select the display option that you want. NOTE: To quickly remove a legend or a legend entry from a chart, you can select it, and then press DELETE. You can also right-click the legend or a legend entry, and then click Delete. Move or Resize Chart You can move a chart to any location on a worksheet or to a new or existing worksheet. You can also change the size of the chart for a better fit. To move a chart, drag it to the location that you want. To resize a chart, click on one of the edges and drag towards the center.