![2 | Page
The number of instances (observations) = 690. The number of attributes =15 (columns A1-A15).
There is one class attribute (column A16) and 307 (44.5%) of the classifier is “+” while 383
(55.5%) is “-“. Below is a schema of the variables in the dataset.
Attribute
Label
Value Type Attribute
Label
Value Type
A1 Nominal A11 Continuous
(Integer)
A2 continuous A12 Nominal
A3 continuous A13 Nominal
A4 Nominal A14 Continuous
(Integer)
A5 Nominal A15 Continuous
(Integer)
A6 Nominal A16 Class
attribute
A7 Nominal
A8 continuous
A9 Nominal
A10 Nominal
Process
We explore the dataset by asking questions to which answers are provided in the form of tables
and visualizations.
Question 1:
What are the relationships between the various variables of the dataset?
For the given dataset, appropriate visualizations to provide answers to this question include
various plots which will emphasize the distribution and statistical relationships among all the
variables.
The objective is to detect differences and similarities between the ‘+’ and ‘-‘values of the class
attribute, A16.
The multiple pairwise bivariate distributions (pair-plots) below are derived using this code.
sns.set(style='ticks') sns.pairplot(pd.read_csv('C:/Users/Owner/Desktop/DATA/CAD/ABC-1.csv'),hue='A1')
Out [14]: <seaborn.axisgrid.PairGrid at 0x2061c3a2588>](https://image.slidesharecdn.com/exploratorydataanalysisproject-190903005330/85/Exploratory-data-analysis-project-2-320.jpg)

![4 | Page
Next, we observe that the distribution of the class attribute values is more dispersed in certain
pairwise plots than in others.
Since, our ultimate goal is to model the data efficiently we shall take a closer look at pairwise
plots where boundary between the ‘+’ and ‘-“values are clearly defined.
For example, let us examine plots A2 vs. A14, A3 vs. A8 and A3 vs. A14 further.
Question 2:
What are the statistical characteristics of the four variables (A2, A3, A8 and A14) identified
above?
Generally, appropriate visualizations that best satisfy what we are looking for here are those
that emphasize distribution and statistical relationships among all the variables. So, we may
start off by looking out for differences and similarities in the characteristics of ‘+’ and ‘-‘values
of the class attribute, A16.
The pair-plots below reveal the general trend and distribution of variables A2, A3, A8 and A14
as they interact with one another. Take the plot of A2 vs.A3 for example, we see that the area
of concentration of the ‘-‘classifier values lie between A2 = 18 – 60 on the y-axis and A3 = 0 – 16
on the x-axis.
Also, we observe that in general the number of both ‘+’ and ‘-‘increases steadily as the value of
A3 increases. We can derive similar impressions from other pair plots as well.
Using this code, we derive the plots below.
sns.pairplot(data=cadnv,hue='A16',vars=['A2','A3','A8','A14'],kind='reg',height=3)
<seaborn.axisgrid.PairGrid at 0x1ad37b93e10>.](https://image.slidesharecdn.com/exploratorydataanalysisproject-190903005330/85/Exploratory-data-analysis-project-4-320.jpg)

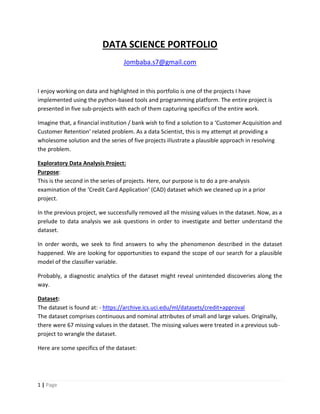
![6 | Page
Knowledge which we attained during the wrangling exercise on this dataset indicate that, the
variance of variable A8 (sigma=3.35) < the variance of variable A3 (sigma=4.98) and the
variance of variable A14 (sigma=173.81) > the variance of variable A2 (sigma=11.96).
We consider these variables further in the matrix below.
To develop the correlation coefficient matrix, we used the Pearson Product-Moment coefficient
to measure linear correlation between the numeric variables (A2, A3, A8, A11, A14 and A15).
For nominal variables (A4, A5, A6, A7, A9, A10, A12, A13), we used the Pearson’s chi-squared
test on the contingency table and normalized to a range of [0,1] using Cramer’s v estimate to
measure the association between 2 (two) variables.
The Correlation Coefficient Matrix
A1 A2 A3 A4 A5 A6 A7 A8 A9 A10 A11 A12 A13 A14 A15 A16
A1 1
0.07
4
0.07
4
0.35
3
0.21
7
0.02
6
0.07
8
0.05
2
0.08
5
0.02
9
A2 1
0.20
1
0.39
3
0.18
6 -0.08
0.01
9
A3
0.20
1 1
0.29
9
0.27
1 -0.22
0.12
3
A4
0.07
4 1 1
0.15
9
0.36
6
0.15
1
0.17
8
0.05
9
0.18
9
0.19
7
A5
0.07
4 1 1
0.15
9
0.36
6
0.15
1
0.17
8
0.05
9
0.18
9
0.19
7
A6
0.35
3
0.15
9
0.15
9 1 0.59
0.32
6 0.28
0.18
7 0.23
0.37
7
A7
0.21
7
0.36
6
0.36
6 0.59 1
0.27
1
0.12
9
0.15
4
0.19
9
0.25
5
A8
0.39
3
0.29
9 1
0.32
2 -0.08
0.05
1
A9
0.02
6
0.15
1
0.15
1
0.32
6
0.27
1 1
0.43
2
0.09
1
0.14
9 0.72
A10
0.07
8
0.17
8
0.17
8 0.28
0.12
9
0.43
2 1
0.01
7
0.24
9
0.45
8
A11
0.18
6
0.27
1
0.32
2 1 -0.12
0.06
4
A12
0.05
2
0.05
9
0.05
9
0.18
7
0.15
4
0.09
1
0.01
7 1
0.07
5
0.03
2
A13
0.08
5
0.18
9
0.18
9 0.23
0.19
9
0.14
9
0.24
9
0.07
5 1
0.11
5
A14 -0.08 -0.22 -0.08 -0.12 1
0.06
6
A15
0.01
9
0.12
3
0.05
1
0.06
4
0.06
6 1](https://image.slidesharecdn.com/exploratorydataanalysisproject-190903005330/85/Exploratory-data-analysis-project-6-320.jpg)


Ad
More Related Content
What's hot (20)
Similar to Exploratory data analysis project (20)


Ad
Recently uploaded (20)


Ad
Exploratory data analysis project
- 1. 1 | Page DATA SCIENCE PORTFOLIO [email protected] I enjoy working on data and highlighted in this portfolio is one of the projects I have implemented using the python-based tools and programming platform. The entire project is presented in five sub-projects with each of them capturing specifics of the entire work. Imagine that, a financial institution / bank wish to find a solution to a ‘Customer Acquisition and Customer Retention’ related problem. As a data Scientist, this is my attempt at providing a wholesome solution and the series of five projects illustrate a plausible approach in resolving the problem. Exploratory Data Analysis Project: Purpose: This is the second in the series of projects. Here, our purpose is to do a pre-analysis examination of the ‘Credit Card Application’ (CAD) dataset which we cleaned up in a prior project. In the previous project, we successfully removed all the missing values in the dataset. Now, as a prelude to data analysis we ask questions in order to investigate and better understand the dataset. In order words, we seek to find answers to why the phenomenon described in the dataset happened. We are looking for opportunities to expand the scope of our search for a plausible model of the classifier variable. Probably, a diagnostic analytics of the dataset might reveal unintended discoveries along the way. Dataset: The dataset is found at: - https://archive.ics.uci.edu/ml/datasets/credit+approval The dataset comprises continuous and nominal attributes of small and large values. Originally, there were 67 missing values in the dataset. The missing values were treated in a previous sub- project to wrangle the dataset. Here are some specifics of the dataset:
- 2. 2 | Page The number of instances (observations) = 690. The number of attributes =15 (columns A1-A15). There is one class attribute (column A16) and 307 (44.5%) of the classifier is “+” while 383 (55.5%) is “-“. Below is a schema of the variables in the dataset. Attribute Label Value Type Attribute Label Value Type A1 Nominal A11 Continuous (Integer) A2 continuous A12 Nominal A3 continuous A13 Nominal A4 Nominal A14 Continuous (Integer) A5 Nominal A15 Continuous (Integer) A6 Nominal A16 Class attribute A7 Nominal A8 continuous A9 Nominal A10 Nominal Process We explore the dataset by asking questions to which answers are provided in the form of tables and visualizations. Question 1: What are the relationships between the various variables of the dataset? For the given dataset, appropriate visualizations to provide answers to this question include various plots which will emphasize the distribution and statistical relationships among all the variables. The objective is to detect differences and similarities between the ‘+’ and ‘-‘values of the class attribute, A16. The multiple pairwise bivariate distributions (pair-plots) below are derived using this code. sns.set(style='ticks') sns.pairplot(pd.read_csv('C:/Users/Owner/Desktop/DATA/CAD/ABC-1.csv'),hue='A1') Out [14]: <seaborn.axisgrid.PairGrid at 0x2061c3a2588>
- 3. 3 | Page The plot is symmetrical about its diagonal and because of this, we concern ourselves only with plots on the upper side of the diagonal. Univariate distributions of the class attribute for the 6 (six) numeric data type variables (i.e. A2, A3, A8, A11, A14 and A15) are shown on the diagonal. Observe that, for variable A2 this distribution is approximately normal, similar and equal for both ‘+’ and ‘-‘. The picture is not the same for all numeric variables.
- 4. 4 | Page Next, we observe that the distribution of the class attribute values is more dispersed in certain pairwise plots than in others. Since, our ultimate goal is to model the data efficiently we shall take a closer look at pairwise plots where boundary between the ‘+’ and ‘-“values are clearly defined. For example, let us examine plots A2 vs. A14, A3 vs. A8 and A3 vs. A14 further. Question 2: What are the statistical characteristics of the four variables (A2, A3, A8 and A14) identified above? Generally, appropriate visualizations that best satisfy what we are looking for here are those that emphasize distribution and statistical relationships among all the variables. So, we may start off by looking out for differences and similarities in the characteristics of ‘+’ and ‘-‘values of the class attribute, A16. The pair-plots below reveal the general trend and distribution of variables A2, A3, A8 and A14 as they interact with one another. Take the plot of A2 vs.A3 for example, we see that the area of concentration of the ‘-‘classifier values lie between A2 = 18 – 60 on the y-axis and A3 = 0 – 16 on the x-axis. Also, we observe that in general the number of both ‘+’ and ‘-‘increases steadily as the value of A3 increases. We can derive similar impressions from other pair plots as well. Using this code, we derive the plots below. sns.pairplot(data=cadnv,hue='A16',vars=['A2','A3','A8','A14'],kind='reg',height=3) <seaborn.axisgrid.PairGrid at 0x1ad37b93e10>.
- 5. 5 | Page Based on these observations, one might be tempted to use an “if else then ……” rule of thumb to propose a rough and simple model for the data. Definitely, we need to further examine the dataset so as to optimize our model. Hence, we examine the A2 vs. A3, A2 vs. A8 and A2 vs. A14 pairs further. Question 3: What are the statistical characteristics of variables A2, A3, A8 and A14 which were identified above? We observe that the univariate distributions of A2 and A14 are similar and those of A3 and A8 are similar as well.
- 6. 6 | Page Knowledge which we attained during the wrangling exercise on this dataset indicate that, the variance of variable A8 (sigma=3.35) < the variance of variable A3 (sigma=4.98) and the variance of variable A14 (sigma=173.81) > the variance of variable A2 (sigma=11.96). We consider these variables further in the matrix below. To develop the correlation coefficient matrix, we used the Pearson Product-Moment coefficient to measure linear correlation between the numeric variables (A2, A3, A8, A11, A14 and A15). For nominal variables (A4, A5, A6, A7, A9, A10, A12, A13), we used the Pearson’s chi-squared test on the contingency table and normalized to a range of [0,1] using Cramer’s v estimate to measure the association between 2 (two) variables. The Correlation Coefficient Matrix A1 A2 A3 A4 A5 A6 A7 A8 A9 A10 A11 A12 A13 A14 A15 A16 A1 1 0.07 4 0.07 4 0.35 3 0.21 7 0.02 6 0.07 8 0.05 2 0.08 5 0.02 9 A2 1 0.20 1 0.39 3 0.18 6 -0.08 0.01 9 A3 0.20 1 1 0.29 9 0.27 1 -0.22 0.12 3 A4 0.07 4 1 1 0.15 9 0.36 6 0.15 1 0.17 8 0.05 9 0.18 9 0.19 7 A5 0.07 4 1 1 0.15 9 0.36 6 0.15 1 0.17 8 0.05 9 0.18 9 0.19 7 A6 0.35 3 0.15 9 0.15 9 1 0.59 0.32 6 0.28 0.18 7 0.23 0.37 7 A7 0.21 7 0.36 6 0.36 6 0.59 1 0.27 1 0.12 9 0.15 4 0.19 9 0.25 5 A8 0.39 3 0.29 9 1 0.32 2 -0.08 0.05 1 A9 0.02 6 0.15 1 0.15 1 0.32 6 0.27 1 1 0.43 2 0.09 1 0.14 9 0.72 A10 0.07 8 0.17 8 0.17 8 0.28 0.12 9 0.43 2 1 0.01 7 0.24 9 0.45 8 A11 0.18 6 0.27 1 0.32 2 1 -0.12 0.06 4 A12 0.05 2 0.05 9 0.05 9 0.18 7 0.15 4 0.09 1 0.01 7 1 0.07 5 0.03 2 A13 0.08 5 0.18 9 0.18 9 0.23 0.19 9 0.14 9 0.24 9 0.07 5 1 0.11 5 A14 -0.08 -0.22 -0.08 -0.12 1 0.06 6 A15 0.01 9 0.12 3 0.05 1 0.06 4 0.06 6 1
- 7. 7 | Page A16 0.02 9 0.19 7 0.19 7 0.37 7 0.25 5 0.72 0.45 8 0.03 2 0.11 5 1 Using the correlation coefficients, we examined the variance further by determining R2 (variance explained or predicted) indicator for a number of variable pairs. See the R2 matrix below. The R2 Matrix (approximate %). A1 A2 A3 A4 A5 A6 A7 A8 A9 A10 A11 A12 A13 A14 A15 A16 A1 0 0.1 A2 0 4 15 3 0.6 A3 4 0 9 7 5 2 A4 0 3 A5 0 3 A6 0 14 A7 0 6 A8 15 9 0 10 1 0.3 A9 0 19 51.8 A10 19 0 21 A11 3 7 10 0 1 0.4 A12 0 0.1 A13 0 1 A14 0.6 5 1 1 0 0.4 A15 0.15 2 0.3 0.4 0.4 0 A16 0.1 3 3 14 6 51.8 21 0.1 1 0 For our purpose, we consider the R2 values for the pairs of A2 vs A8, A3 vs A8 and A11 vs A8 of numeric columns. These values are highlighted in green color. Similarly, for pairs of nominal variables A6 vs A16, A9 vs A16 and A10 vs A16 we highlight the corresponding values in red color. Summary and Conclusion: Our diagnostic analytics effort has revealed useful information that might have easily been overlooked. Thus, there is a broad knowledge on the bases of which we would build a plausible model. Thus, the diagnostic analysis suggests that the behavior of the + and – values of variable A16 are greatly affected by variables A2, A3, A8 and A11. How critical are these effects in
- 8. 8 | Page determining a plausible model for the classifier? We explore this further in another project. tyJA