Finance Benchmarks Prophecy or Pretense Webinar Recap - Auxis Webinar
0 likes152 views

Finance Benchmarks Prophecy or Pretense Webinar Recap.pdf


Finance Benchmarks Prophecy or Pretense Webinar Recap - Auxis Webinar
- 1. Proprietary and Confidential 1 WEBINAR June 25, 2025 12:00 pm ET Finance Benchmarks: Prophecy or Pretense? 2.0
- 2. Proprietary and Confidential 2 Introductions Shirley Hung Everest Group Partner, F&A Outsourcing Kelley Pruetz APQC Principal Research Lead for Finance Fabiana Corredor Eric Liebross Senior Managing Director Of Business Transformation Vice President of Marketing & Growth Eric brings more than 30 years of experience and a proven track record of success helping CFOs modernize and achieve peak performance in their back office to become more scalable, innovative and strategic oriented. Fabiana has been a part of the Auxis’ team since 2012. She leads the Marketing & Lead Generation Department, bringing together practice leaders and sales to work more effectively, cohesively and in line with Auxis go-to-market strategy. During the last 4 years, Fabiana has focused on building Auxis’ Digital Marketing and Inbound Marketing Strategy focusing on lead generation, brand awareness & engagement. Over 25 years of professional experience working across global/professional services, mining, financial services, pharmaceuticals, energy, petrochemicals, telecommunications, and manufacturing. Prior to Everest Group, Shirley was General Manager Strategy with Rio Tinto; Previously, she held various consulting and strategy roles at Mercer HR Consulting, The Hackett Group, Charles Schwab, and Arthur D. Little. Master of Science in Philosophy, Policy and Social Value from the London School of Economics; Bachelor of Science in Chemical Engineering from the Massachusetts Institute of Technology Kelley understands the needs of financial managers first-hand, thanks to working 25+ years in the corporate financial world. As Principal Research Lead, Financial Management, Kelley develops and executes APQC’s agenda for financial management research. She also engages with finance directors and leaders with APQC member organizations to understand their needs and challenges and to share insights based on APQC research, data, information, and expertise
- 3. Proprietary and Confidential 3 Agenda • Top Finance Priorities and Trends • Why Benchmarking? – Benchmarks as Guideposts to Performance – Aligning with Industry Peers – What is the Right Level of Benchmarking Performance? – The Characteristics of a Top Performing Company • What are the “Right” Benchmarks? – Effectiveness vs. Efficiency – Key Benchmarks by Function ▪ R2R ▪ P2P ▪ O2C – What’s Changed Over the Past 5 Years? • Real-World Examples of How Benchmarking Can Drive Strategies for Improvement • Framework for Benchmarking • Conclusions • Questions
- 4. Proprietary and Confidential 4 The Top Challenges Facing Finance Executives* Cost and margin pressure stand as the top challenges for enterprise in 2025, driving heightened expectations from CFOs to become a more strategic business partner Key business challenges expected in 2025* Ranking based on percentage of respondents selecting as highly challenging Cost and margin pressures Adapting to evolving customer needs Slowdown In demand Regulations (e.g., ESG, data privacy) Increased geopolitical and location risk 1 2 3 4 5 Organizations’ expectations from CFOs Business partner for strategic decision-making CFO’s role has evolved from being a functional expert facilitating business to becoming a strategic business partner *Everest Group Surveys – Mapping the Next: Key Priorities For 2025 and Key Issues for 2024 Source: Everest Group (2025) Architect of agile and resilient organizations Custodian of insights Orchestrator of transformation Value creator
- 5. Proprietary and Confidential 5 *APQC, “2025 Financial Management Priorities and Challenges Report”, January 2025 The Top 3 Priorities for Finance Executives* of Finance Professionals are prioritizing digital transformation focusing on enhancing financial planning and budgeting, optimizing ERP systems, and improving data integration of Finance Professionals are prioritizing data analytics to gain more timely and accurate insights into operational performance for improved decision- making of Finance Professionals are prioritizing cash flow management focusing on more visibility into and timely execution of collections 73% 50% 43%
- 6. Proprietary and Confidential 6 Most pressing pain points of today’s webinar registrants : 34% 50% 55% 63% 65% 74% Talent retention & turnover Scaling to absorb future growth Achieving a cost reduction target Improving quality, speed, and service to the business Freeing up my team for higher-value work Automating manual activities What are the most pressing pain points you are trying to address in your finance organization?
- 7. Proprietary and Confidential 7 19% 34% 21% 26% 2022 21% 34% 36% 9% 2024 Leveraging only third-party providers1 Leveraging only captives / GBS / shared services1 Leveraging both third-party providers and captives / GBS / shared services1 Only in-business 100% = 301 100% = 300 Type of operating model currently leveraged to handle F&A services Decreasing leverage of outsourcing Key Trend: A Hybrid Service Delivery Model is Emerging… Leveraging both in-house capabilities and third-party service providers 1 Includes in-business Source: Everest Group Global CFO Survey 2025
- 8. Proprietary and Confidential 8 Proprietary and Confidential Polling Question #1 Which of the following best describes your current finance services delivery model? All In-House, not looking to change 8% Hybrid, increasing use of 3rd parties 46% Hybrid, reducing use of 3rd parties 21% Still figuring out the best model for my org 25% All In-House, evaluating outsourcing 17%
- 9. Proprietary and Confidential 9 Top Performing Finance Organizations are 3x more efficientin overall staffing of their Finance functions*. *ScottMadden and APQC, “Setting the State for Tomorrow Through Finance Shared Services”, November 2024 Benchmarking as a Guidepost to Performance Top Performing Finance Organizations maintain an operating cost that was 30-60% below their industry peer groups*.
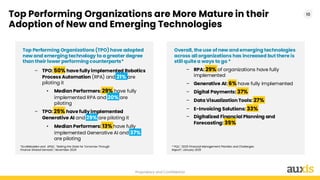
- 10. Proprietary and Confidential 10 Top Performing Organizations are More Mature in their Adoption of New and Emerging Technologies *ScottMadden and APQC, “Setting the State for Tomorrow Through Finance Shared Services”, November 2024 Top Performing Organizations (TPO) have adopted new and emerging technology to a greater degree than their lower performing counterparts* * PQC, “2025 Financial Management Priorities and Challenges Report”, January 2025 – TPO: 50% have fully implemented Robotics Process Automation (RPA) and 21% are piloting it • Median Performers: 29% have fully implemented RPA and 20% are piloting – TPO: 25% have fully implemented Generative AI and 29% are piloting it • Median Performers: 13% have fully implemented Generative AI and 37% are piloting Overall, the use of new and emerging technologies across all organizations has increased but there is still quite a ways to go * – RPA: 29% of organizations have fully implemented – Generative AI: 6% have fully implemented – Digital Payments: 37% – Data Visualization Tools: 27% – E-Invoicing Solutions: 33% – Digitalized Financial Planning and Forecasting: 35%
- 11. Proprietary and Confidential 11 Top vs. Median vs. Bottom Performer What is the “Right” Level of Benchmarking Performance? • The characteristics of a “Top Performer” - Consolidated, centralized and standardized business processes and systems - Limited number of transactional variations and exceptions - Simplified business rules - Implemented automation solutions to reduce the amount of manual work being performed • Does this sound like your organization? Complexity is often driven by the various business characteristics, such as industry sector, revenue size, public vs. private sector, even geography Median Performer (50%) Top Performer (75 % and Above) Bottom Performer (25% and Below)
- 12. Proprietary and Confidential 12 A Balanced Set of Key Performance Indicators Effectiveness vs. Efficiency Metrics that focus on the operating cost and quality for the various functions • Total cost includes both the Personnel Cost as well as the cost of the systems infrastructure needed to run the function • Quality can include the accuracy of invoice processing and payments for AP, or DSO for AR EFFECTIVENESS Metrics that focus on the number of FTEs (“full time equivalents”) performing the work and the productivity levels of those resources • It is important to compare organizations based on their industry and revenue size • The assumption is that higher revenue companies will have a larger number of transactions being performed, necessitating more people to manage them EFFICIENCY
- 13. Proprietary and Confidential 13 Key Efficiency Metric Number of Finance Function FTEs Per $1B Revenue * Top performer is 2x more efficient than the Bottom performer * Interesting Note: – There has been a ~5% reduction in headcount across the board since 2021, likely due to the introduction of automation and other enabling technologies. Key Effectiveness Metric Total Cost to Perform the Finance function per $1,000 Revenue * Top performer is 2x more cost effective than the Bottom performer * Interesting Note: – There has been a ~5% increase in cost efficiency for the Bottom Performers, with Top and Median Performers largely unchanged – While productivity has improved, costs have increased to mostly offset these improvements Good Metrics to Track Overall Finance Organization Top Performer Median Performer Bottom Performer 50.0 81.4 103.4 Top Performer Median Performer Bottom Performer 0.70% 1.10% 1.50%
- 14. Proprietary and Confidential 14 Proprietary and Confidential Polling Question #2 Which Function Within Your F&A Organization Present the Biggest Operational Challenges? Select all that apply Other 7% FP&A, Reporting & Analytics 63% Accounts Payable 37% General Accounting & the Closing Process 48% Accounts Receivable 30%
- 15. Proprietary and Confidential 15 Key Efficiency Metric Number of General Accounting FTEs Per $1B Revenue * Top performer is 3.5x more efficient than the Bottom performer * Interesting Note: – There has been a ~16% reduction in headcount across the board since 2019, likely due to the introduction of automation and other enabling technologies. Key Effectiveness Metric Total Cost to Perform General Accounting per $1B Revenue * Top performer is 5x more cost effective than the Bottom performer * Interesting Note: – There has been a ~48% increase in cost efficiency across the board since 2019 (81% for Bottom Performers!) – While productivity has improved, costs have increased more than productivity, certainly due to the rising cost of talent acquisition and retention Good Metrics to Track General Accounting & Reporting Top Performer Median Performer Bottom Performer 4.8 9.3 17.2 Top Performer Median Performer Bottom Performer $500k $1.04M $2.63M
- 16. Proprietary and Confidential 16 * Other Efficiency metrics include – Number of Journal Entries Processed Per FTE – Number of Accounts Managed Per FTE – Number of Journal Entry Line Items Per FTE * Other Effectiveness metrics include: – % of Manual Journal Entry Line Items Processed Error-Free – Cycle Time to Complete the Close – Personnel Cost to Perform General Accounting and Reporting Good Metrics to Track General Accounting & Reporting Other Efficiency Metric Other Effectiveness Metric * Helpful Hints * If your headcount is high, and performance levels are low, you have identified an area of opportunity * Look outside the function for people working on similar activities (additional FTEs who “touch” these same activities)
- 17. Proprietary and Confidential 17 Bottom Performer Good Metrics to Track Accounts Payable Key Efficiency Metric Number of Invoices Processed Per FTE Per Month * Top performer is 3x more efficient than the Bottom performer * Interesting Note: – There has been a 38% increase in processing productivity for Bottom Performers and a 25% increase for Median Performers, while Top Performers remained largely unchanged. – Is this the “democratization” of automation? Now most organizations have leveraged some degree of automation into their AP operating model; five years earlier it was only found in larger, more sophisticated operations. Top Performer Median Performer 573 986 1,809 Key Effectiveness Metric Cost Per Invoice * Top performer is more than 3x more cost effective than the Bottom performer * Interesting Note: – The average cost per invoice has only changed marginally for Bottom and Median Performers over the past 5 years, but Top Performers cost per invoice has increased 45% during this period! – The significant increases in productivity for Median and Bottom Performers have offset the Labor Cost increases but for Top Performers who had already achieved these benefits, the cost just went up! Top Performer Median Performer Bottom Performer $3.00 $6.00 $10.00
- 18. Proprietary and Confidential 18 * Other Efficiency metrics include – Number of AP FTEs – Number of Invoice Line Items Processed Per FTE – Number of Disbursements Processed Per FTE * Other Effectiveness metrics include: – Percentage of Invoices Matched to a Purchase Order – Percentage of Disbursements Processed First Time Error Free – Percentage of Invoice Line Items Received Electronically Good Metrics to Track Accounts Payable Other Efficiency Metric Other Effectiveness Metric * Helpful Hints – Some metrics, such as Invoice Cycle Time or Days Payable Outstanding (DPO) may not be truly reflective of AP performance – There are external dependencies such as the time it takes for invoice approvals or whether the organization is managing cash and not releasing payments immediately.
- 19. Proprietary and Confidential 19 Good Metrics to Track Accounts Receivable Bottom Performer Key Efficiency Metric Number of Cash Receipts Processed Per FTE Per Month * Top performer is 4.5x more efficient than the Bottom performer * Interesting Note: – There has been a 50% improvement in processing productivity for Bottom Performers over the past five years, while Median and Top Performers have remained largely unchanged – This is likely due to the availability of automation tools to drive productivity in this area. A consistent theme is emerging! Top Performer Median Performer 330 750 1,455 Key Effectiveness Metric Cost Per Customer Receipt * Top performer is 6x more efficient than the Bottom performer * Interesting Note: – There has been a 57% improvement in cost efficiency for Bottom Performers over the past five years, while Median Performers have improved by 36% and Top Performers by 24% – Note the huge difference between Top and Bottom Performers highlighting the impact of automation, standardizing processes and reducing the number of exceptions being managed, all typical characteristics of Top Performing organizations. Top Performer Median Performer Bottom Performer $3.00 $7.33 $18.40
- 20. Proprietary and Confidential 20 * Other Efficiency metrics include – Number of Adjustments and Adjustments Processed Per FTE – Number of Customer Accounts Managed Per FTE for Collections – Days Sales Outstanding (DSO) * Other Effectiveness metrics include: – Percentage of Customer Receipts that are Processed First Time Error Free – Percentage of Customer Receipts Received Electronically – Percentage of Receipts Automatically Matched to Open Items. Good Metrics to Track Accounts Receivable Other Efficiency Metric Other Effectiveness Metric * Helpful Hints – Similar to AP, some metrics will have external dependencies – Additionally, certain metrics will be dependent on business rules and policies, such as Billing Exceptions Allowed, Credit and Deductions Tolerance, Payment Methods Available (and Electronic Payments Required/Enforced)
- 21. Proprietary and Confidential 21 Proprietary and Confidential Polling Question #3 After Reviewing These Key Benchmarking Metrics, Where Would You Place Your F&A Organization? Median Performer 43% Bottom Performer 19% I’m not sure, I need more info 29% Top Performer 10%
- 22. Proprietary and Confidential 22 Proprietary and Confidential 22 Schedule your Complimentary Finance Optimization Assessment What you will get from it: • High-level benchmark comparison against your industry peers • “Size of the opportunity” ($$$) - savings + efficiencies • Recommended actions for 2025 • What strategies make sense for you • Potential business case • Estimated timeline & implementation roadmap Download our new guide on “Finance Benchmarks: Prophecy or Pretense?” If you are interested, please email [email protected]
- 23. Proprietary and Confidential 23 Real-World Examples of Benchmark Data Driving Operational Strategy
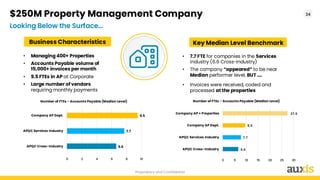
- 24. Proprietary and Confidential 24 • Managing 400+ Properties • Accounts Payable volume of 15,000+ invoices per month • 9.5 FTEs in AP at Corporate • Large number of vendors requiring monthly payments • 7.7 FTE for companies in the Services industry (6.6 Cross-Industry) • The company “appeared” to be near Median performer level, BUT …. Business Characteristics 6.6 7.7 9.5 0 2 4 6 8 10 APQC Cross-Industry APQC Services Industry Company AP Dept. Number of FTEs - Accounts Payable (Median Level) 6.6 7.7 9.5 27.5 0 5 10 15 20 25 30 APQC Cross-Industry APQC Services Industry Company AP Dept. Company AP + Properties Number of FTEs - Accounts Payable (Median Level) • Invoices were received, coded and processed at the properties $250M Property Management Company Looking Below the Surface… Key Median Level Benchmark
- 25. Proprietary and Confidential 25 $5.80 $5.50 $2.99 $17.23 $- $5.00 $10.00 $15.00 $20.00 APQC Services Industry APQC Cross-Industry Company AP Dept. Company AP + Properties Cost Per Invoice (Median Level) Action Plan • Centralize AP (moving from the properties to Corporate) – which could mean adding 15 FTEs there • Implement automated AP processing solution with Intelligent Document Processing (IDP) enabled the company to achieve a 70% touchless AP processing level • Add 5 AP FTEs at Corporate (and free up the equivalent of 8 Accountants who were doing re-classes) $5.80 $5.50 $2.99 $17.23 $3.52 $- $5.00 $10.00 $15.00 $20.00 APQC Services Industry APQC Cross-Industry Company AP Dept. Company AP + Properties Company Future State AP Model Cost Per Invoice (Median Level) $250M Property Management Company Before and After… Cost Per Invoice (Before) Cost Per Invoice (After)
- 26. Proprietary and Confidential 26 • 8 locations globally with F&A teams at each of the manufacturing plants • FA teams focused on local financial operations and managing the specific market regulatory requirements • Some the locations were in high- cost markets (North America, Europe, Australia) and others were in low-cost markets (Latin America, Africa, Asia) • The company had non-standard processes and older, diverse financial systems across markets • Was in process of standardizing its ERP system platform across all markets, but struggling to get markets to adjust • Highly tenured teams, with localized requirements and the systems variances made process standardization challenging • Need to standardize processes to support system implementation, driving scalability and reduced operating cost Business Characteristics $2B Global Manufacturing Company Benefits of a Global Business Services Strategy Additional Business Characteristics
- 27. Proprietary and Confidential 27 103.4 81.4 59.0 50.0 0.0 20.0 40.0 60.0 80.0 100.0 120.0 Bottom Median Company Top Number of F&A FTE's Per Industry/Revenue Size - All Markets $8,125,896 $7,143,021 $6,396,982 $3,929,350 $- $2,000,000$4,000,000$6,000,000$8,000,000 $10,000,000 Bottom Company Median Top F&A Personnel Cost Per Industry/Revenue Size- All Markets $2B Global Manufacturing Company You Can Be Right-Staffed and Still Be Overpaying The initial analysis showed us the company was operating at 28% better than the Median Performer level from a headcount perspective (Efficiency) but ran at a 12% higher personnel cost structure (Effectiveness) than a median-performing peer. Realigning its cost structure to the median level could represent an annual cost savings of more than $800,000.
- 28. Proprietary and Confidential 28 541 570 926 1,726 0 500 1,000 1,500 2,000 Bottom Company Median Top Number of AP Invoices Processed Per FTE 149 330 750 1,455 - 500 1,000 1,500 2,000 Company Bottom Median Top Number of Customer Receipts Processed Per FTE $2B Global Manufacturing Company Bottom Performer at Both AP and AR In order to achieve a labor cost savings of $800,000 they would need to be able to reduce headcount by at least 8-10 FTEs depending on the function. The Accounts Payable and Accounts Receivable functions clearly represented areas of opportunity for the company.
- 29. Proprietary and Confidential 29 128.1 75.1 59.0 47.0 46.4 0.0 20.0 40.0 60.0 80.0 100.0 120.0 140.0 Bottom Median Current Company Optimized Company Top Total Number of F&A FTE's Per Industry/Revenue Size $8,002,050 $7,143,021 $6,396,982 $6,243,021 $2,058,500 $- $4,000,000 $8,000,000 Bottom Current Company Median Optimized Company Top F&A Personnel Cost Per Industry/Revenue Size $2B Global Manufacturing Company GBS Strategy to Consolidate and Optimize Operations • The company embarked on a GBS initiative to consolidate and optimize operations, recognizing that due to its diverse operational footprint, it still needed to retain certain roles in-country. • Focusing on AP and AR, the company was able to achieve a 12-FTE headcount reduction (18%) through centralization and automation in these functions, which resulted in labor cost savings of $900,000 (13%). • They now surpassed the Median level in labor cost and were approaching Top Performer in headcount.
- 30. Proprietary and Confidential 30 Framework for Benchmarking Guiding Principles 2. Determine Key Performance Indicators 1. Align on Your Key Drivers for Success 4. Conduct a Gap Analysis 3. Measure Current Performance 6. Execute 5. Develop an Improvement Plan 8. Repeat! 7. Measure Results and Recalibrate
- 31. Proprietary and Confidential 31 How many SLAs No more than 5 SLAs per function/category What SLAs Should be aligned with business expectations or pain points How stringent Should be fit for purpose How much fee at risk • 10-15% for run services • 5-12% for transformative deals Allocation pool • 150-350% for run services • 100-125% for transformative deals Bonuses and earn-backs Depends on value of overachievement and impact of one-off underachievement Aligning Benchmarks to Performance Establishing and Monitoring Service Levels
- 32. Proprietary and Confidential 32 Key Takeaways
- 33. Proprietary and Confidential 33 In Conclusion… • Benchmark data can provide you with good insights into the current state of your F&A operation, and serve as a roadmap to future efficiencies • But benchmarking analysis is not a standalone activity; it can serve as a significant data point, pointing you in the right direction and indicating IF and WHERE potential opportunities are available • It can serve as the first step in a broader analysis, and given the ongoing requirements for organizations to contain cost, improve productivity, get more scalable and shift operational focus, is a good exercise for organizations to undertake to provide the insights needed to take action • Key operational strategies to consider will include shared services, process optimization and standardization, digital transformation, business process outsourcing and/or a hybrid operating model • Use benchmark data to highlight where the opportunities are, based on the efficiency and effectiveness of your operation, and determine if a sufficient business case exists to warrant investment in the initiative
- 34. Proprietary and Confidential 34 Thank you for attending! Shirley Hung Everest Group Partner, F&A Outsourcing Kelley Pruetz APQC Principal Research Lead for Finance Fabiana Corredor Eric Liebross Senior Managing Director Of Business Transformation Vice President of Marketing & Growth