SlideShare a Scribd company logo
Introduction to Artificial Intelligence
Disclaimer: The content is curated for educational purposes only.
Introduction to Artificial Intelligence
Learning Objectives
You will learn in this lesson:
• Users will gain an understanding of fundamental concepts of
AI
• Users will acquire knowledge and skills to analyze data.
Introduction to Artificial Intelligence
Hands-on 1: Demo on chatGPT
Reference link
Click here
Introduction to Artificial Intelligence
We live with AI
Socratic
Replika: My AI Friend
FaceApp
Introduction to Artificial Intelligence
Artificial Intelligence (AI) is a field of computer science that aims to create machines capable of
emulating human intelligence, enabling them to perform tasks like problem-solving and learning from
data.
Artificial Intelligence
Introduction to Artificial Intelligence
Generative AI refers to artificial intelligence systems that have the ability to create new data, such as
text, images, or other content, often mimicking human-like creativity and generation.
• Content Generation
• Creative Capabilities
• Applications
• Models
• Potential for Misuse
Generative AI
Introduction to Artificial Intelligence
Discriminative AI specializes in classifying and predicting data based on learned patterns, but it
doesn't generate new content.
• Classification and Prediction
• Data-Driven
• Not Creative
• Widely Used
Discriminative AI
Introduction to Artificial Intelligence
Hands-on 2: Demo on Lobe
Lobe AI is a tool that allows you to create machine learning models without the need for extensive
programming knowledge. It focuses on making machine learning more accessible to a broader
audience, including those who may not be familiar with traditional coding or data science techniques
▪ User-Friendly Interface
▪ No Coding Required
▪ Image and Data Classification
▪ Customizable Models
▪ Export Options
▪ Support for TensorFlow
▪ Community and Resources
About Lobe AI:
Introduction to Artificial Intelligence
Disclaimer: The content is curated for educational purposes only.
Exploratory Data Analysis (EDA)
Introduction to Artificial Intelligence
What is EDA?
• Exploratory data analysis (EDA) involves using graphics and visualizations to explore and analyse a data
set. The goal is to explore, investigate and learn, as opposed to confirming statistical hypotheses.
• The process of using numerical summaries and visualizations to explore your data and to identify
potential relationships between variables is called exploratory data analysis, or EDA.
Reference link
Click here
Introduction to Artificial Intelligence
A Typical EDA Process
Reference link
Click here
Introduction to Artificial Intelligence
Univariate Analysis
• Univariate analysis examines a single variable's properties, whether quantitative (e.g., numerical) or
categorical (e.g., qualitative).
• It provides insights into the distribution, central tendency, and variability of the variable, using statistical
measures and graphical representations.
• Univariate analysis is an essential initial step in data exploration and hypothesis testing, focusing solely on
one variable without considering relationships with other variables.
Introduction to Artificial Intelligence
Bivariate Analysis
• Explains how two variables are related.
• Bivariate analysis is a crucial step in data analysis, allowing for a deeper understanding of the interplay
between two variables before moving to more complex multivariate analysis.
Multivariate Analysis
• Involves the simultaneous examination of three or more variables to uncover complex relationships and
interactions among them.
• It employs various statistical methods to gain a deeper understanding of how multiple variables collectively
influence data patterns.
Introduction to Artificial Intelligence
What are Outliers?
“A celebrity in the crowd of commoners is an outlier”
Reference link
Click here
Introduction to Artificial Intelligence
What are Outliers?
We all have heard of the idiom ‘odd one out which means something unusual in comparison to the
others in a group. Similarly, an Outlier is an observation in a given dataset that lies far from the rest of
the observations. That means an outlier is vastly larger or smaller than the remaining values in the
set.
Why do they occur?
An outlier may occur due to the variability in the data, or due to experimental error/human error.
They may indicate an experimental error or heavy skewness in the data(heavy-tailed distribution).
Introduction to Artificial Intelligence
Many tools are available in the market, which make it easier for us:
1. To process and manipulate data
2. Analyse the relationships and correlations between data sets,​
3. Helps to identify patterns and trends for interpretation
Data Analysis Tools
Introduction to Artificial Intelligence
Hands-on 3: EDA Pre-Processing (NumPy)
Pre-processing involves getting the data into a suitable format for analysis. This step ensures that
the data is accurate, complete, and ready for modeling.
▪ Data Cleaning
▪ Data Transformation
▪ Feature Engineering
▪ Handling Missing Values
▪ Encoding Categorical Variables
▪ Dealing with Outliers
▪ Data Splitting
Introduction to Artificial Intelligence
What is Pandas?
1. Pandas is a Python library used for working with data sets (csv, json..,etc).
2. It has functions for
1. analyzing,
2. cleaning,
3. exploring,
4. and manipulating data.
3. The name "Pandas" has a reference to both "Panel Data", and "Python Data Analysis" and
was created by Wes McKinney in 2008.
Introduction to Artificial Intelligence
Why Use Pandas?
1. Pandas allows us to analyze big data.
2. It makes conclusions based on statistical theories operations
3. Pandas can clean messy data sets(in a larger size)
4. Pandas helps us to convert readable
5. Helps to find the relevant information from big data.
Introduction to Artificial Intelligence
What Can Pandas Do?
We can find the,
• Correlation between two or more columns
• We can find basic descriptive analysis
1. Mean
2. Median
3. Std
4. IQR (Inter Quartile Range)
5. Find Max value & Min value?
Introduction to Artificial Intelligence
Environmental Setup
Installation of Pandas
Windows
pip install pandas
or
conda install pandas
Linux
pip3 install pandas
Introduction to Artificial Intelligence
Series
Pandas Series - Name
Pandas Series - Index
Pandas Series - Values
Create a simple Pandas Series from a list:
Introduction to Artificial Intelligence
Series
Pandas Series - Name
Pandas Series – Index – [0,1,…etc] / we can give any name as label for
index.
Pandas Series - Values
Create the label Pandas Series
Introduction to Artificial Intelligence
Series
Create a simple Pandas Series from a dictionary
Introduction to Artificial Intelligence
DataFrames
A Series is essentially a column, and a DataFrame is a multi-dimensional table made up of a collection
of Series.
Introduction to Artificial Intelligence
DataFrames
Create a simple Pandas DataFrame
Introduction to Artificial Intelligence
DataFrames
Named Indexes – Data Frame
apples oranges
day1 420 50
day2 380 40
day3 390 45
Introduction to Artificial Intelligence
DataFrames
Locate Named Indexes– Data Frame
#refer to the named index:
print(df.loc["day2"])
Output:
apples 380
oranges 40
Name: 0, dtype:
int64
Introduction to Artificial Intelligence
Read & Write
Reference link
Click here
Introduction to Artificial Intelligence
Reference link
Click here
Introduction to Artificial Intelligence
Read CSV Files
import pandas as pd
df = pd.read_csv('data.csv')
print(df.to_string())
1. A simple way to store big data sets is to use CSV files (comma separated files).
2. CSV files contains plain text and is a well know format that can be read by everyone
including Pandas.
3. In our examples we will be using a CSV file called 'data.csv’.
Introduction to Artificial Intelligence
Read JSON file
import pandas as pd
df = pd.read_json('data.json')
print(df.to_string())
JSON is plain text which is written in JavaScript object natation. This file has .json as its extension, with the
data inside it represented in a key:value pair.
In our examples we will be using a JSON file called 'data.json'.
Introduction to Artificial Intelligence
Indexing in Pandas
An index is like an address, that’s how any data point across the data frame or series can be
accessed. Rows and columns both have indexes, rows indices are called index, and columns by
its general column names.
• .loc is used for labels
• .iloc is used for position numbers
Let us assume Geeta, Mahima & Shruti are standing at positions 1, 2, & 3, respectively. If you
want to call Mahima, you have two options, either you call her by her name or her position
number. So, if you call Mahima by her name “Mahima”, you will use .loc and if we will call her by
her position number “2” we will use .iloc.
Introduction to Artificial Intelligence
Indexing in Pandas
Introduction to Artificial Intelligence
Conditional Selection
For example, suppose that we're interested specifically in better-than-average wines produced in
Italy. We can start by checking if each wine is Italian or not:
Introduction to Artificial Intelligence
Conditional Selection
This operation produced a Series of True/False booleans based on the country of each
record. This result can then be used inside of loc to select the relevant data:
reviews.loc[reviews.country == 'Italy']
Introduction to Artificial Intelligence
Conditional Selection
We can use the ampersand (&) to bring the two questions together:
reviews.loc[(reviews.country == 'Italy') & (reviews.points >= 90)]
Introduction to Artificial Intelligence
Pandas – Data Handling
The data set contains some empty cells ("Date" in row
22, and "Calories" in row 18 and 28).
The data set contains wrong format ("Date" in row 26).
Introduction to Artificial Intelligence
Pandas – Data Handling
Remove Rows: One way to deal with empty cells is to remove rows that contain empty cells.
Introduction to Artificial Intelligence
Pandas – Data Handling
Remove all rows with NULL values using inplace parameter
Introduction to Artificial Intelligence
Pandas – Data Handling
Replace Empty Values: The fillna() method allows us to replace empty cells with a value:
Introduction to Artificial Intelligence
Pandas – Data Handling
Replace Using Mean, Median, or Mode: Pandas uses the mean() median() and mode() methods to
calculate the respective values for a specified column. Calculate the MEAN and replace any empty values.
Introduction to Artificial Intelligence
Pandas – Data Handling
Finding Relationships: A great aspect of the Pandas module is the corr() method. The corr()
method calculates the relationship between each column in your data set.
Introduction to Artificial Intelligence
Pandas – Data Handling
Discovering Duplicates: Duplicate rows are rows that have been registered more than one time. The
duplicated() method returns a Boolean values for each row. Returns True for every row that is a
duplicate, otherwise False
Introduction to Artificial Intelligence
Lab 4 – EDA- Univariate, Bivariate and Multivariate Analysis (Pandas)
Data Analysis (EDA) is a crucial step in the data analysis process. It involves examining and visualizing data to
understand its underlying patterns, relationships, and characteristics. EDA can be divided into three main
categories: Univariate, Bivariate, and Multivariate analysis.
Introduction to Artificial Intelligence
What is Data Visualization?
Data visualization deals with a visual
representation of data and is part of data analysis.
It is the process of translating data into a chart,
graph, or other visual components.
Reference link
Click here
Introduction to Artificial Intelligence
Plotting and Visualization
Data visualization packages and tools are required to provide an accessible
way to analyze massive amounts of information and understand trends and
patterns in data.
Introduction to Artificial Intelligence
Matplotlib
Matplotlib is one of the most popular Python packages used for data visualization. It is a cross-
platform library for making 2D plots from data in arrays.
Introduction to Artificial Intelligence
Line Plot
According to the wiki,
“A line chart or line plot or line graph
is a type of chart which displays
information as a series of data points
called ‘markers’ connected by straight
line segments. It is a basic type of
chart common in many fields”
Reference link
Click here
Introduction to Artificial Intelligence
Bar Plot
A bar chart or bar graph is a chart or graph that
presents categorical data with rectangular bars with
heights or lengths proportional to the values that
they represent. The bars can be plotted vertically or
horizontally.
Syntax:
ax.bar(x, height, width, bottom, align)
plt.bar(x,y)
Introduction to Artificial Intelligence
Scatter Plot
A scatter plot is a diagram where each value in
the data set is represented by a dot.
Use the scatter() method to draw a scatter plot
diagram:
Syntax:
plt.scatter(x, y)
Introduction to Artificial Intelligence
3-D Plotting in Matplotlib
• Three-dimensional plots are enabled by importing
the mplot3d toolkit, included with the main Matplotlib
installation:
• from mpl_toolkits import mplot3d
• Syntax:
plt.plot3D()
Reference link
Click here
Introduction to Artificial Intelligence
Pie Chart
• Matplotlib API has pie() function in
its pyplot module which creates a pie chart
representing the data in an array.
• Syntax:
plt.pie(data)
Reference link
Click here
Introduction to Artificial Intelligence
Hands-on 5 – EDA- Descriptive Analysis with Visualization
Exploratory Data Analysis (EDA) involves examining and visualizing data to gain insights and understand its
underlying patterns. It's an essential step in the data analysis process. Here's a breakdown of how to perform
EDA with descriptive analysis and visualization
Introduction to Artificial Intelligence
Day 1
Take Home Activity
Introduction to Artificial Intelligence
Summary
• AI leverages advanced algorithms to automate data analysis and decision-making.
• EDA provides the foundational insights needed for AI models.
• Together, AI and EDA empower organizations to efficiently process and gain valuable insights from
large datasets, leading to data-driven decision-making.
Introduction to Artificial Intelligence
Quiz
1. Which subfield of AI focuses on developing algorithms that allow computers to learn
from and make predictions or decisions based on data?
a) Machine learning
b) Natural language processing
c) Robotics
d) Computer vision
Answer: a) Machine learning
Introduction to Artificial Intelligence
Quiz
2. What is the primary goal of Artificial Intelligence (AI)?
a) To create machines that can think and behave like humans
b) To automate tasks and improve efficiency
c) To develop advanced algorithms for data analysis
d) To simulate natural processes and phenomena
Answer: b) To automate tasks and improve efficiency
Introduction to Artificial Intelligence
3. What is the difference between narrow or weak AI and general or strong AI?
a) Narrow AI can perform specific tasks, while general AI can understand and perform any
intellectual task that a human being can do.
b) Narrow AI is less efficient than general AI in problem-solving.
c) Narrow AI is more expensive to develop than general AI.
d) Narrow AI is based on rule-based systems, while general AI uses neural networks.
Answer: a) Narrow AI can perform specific tasks, while general AI can understand and
perform any intellectual task that a human being can do.
Quiz
Introduction to Artificial Intelligence
Reference
• https://commons.wikimedia.org/wiki/File:Artificial_Intelligence_%26_AI_%26_Machine_Learning_-
_30212411048.jpg
• https://study.com/academy/lesson/artificial-intelligence-in-everyday-life.html
• https://d1m75rqqgidzqn.cloudfront.net/wp-data/2019/11/12140511/shutterstock_519560572.jpg
• https://www.simplilearn.com/tutorials/artificial-intelligence-tutorial/what-is-artificial-intelligence
• https://www.tractica.com/
• https://static.javatpoint.com/tutorial/ai/images/subsets-of-ai.png
• https://docs.microsoft.com/en-us/azure/architecture/data-guide/big-data/ai-overview
Introduction to Artificial Intelligence
Thank you!

More Related Content

Similar to From BasicToAdvanced-FFN, Neuron, Activation Function.pdf (20)

PDF
Pandas, Data Wrangling & Data Science
Krishna Sankar
 
PPTX
How to implement artificial intelligence solutions
Carlos Toxtli
 
PPTX
Artificial intelligence: Simulation of Intelligence
Abhishek Upadhyay
 
PPTX
EDA.pptx
yovi pratama
 
PDF
Data Science and Machine Learning Using Python and Scikit-learn
Asim Jalis
 
PDF
Machine learning at b.e.s.t. summer university
László Kovács
 
PDF
Wes McKinney - Python for Data Analysis-O'Reilly Media (2012).pdf
Blue Sea
 
PDF
Data Science & AI Road Map by Python & Computer science tutor in Malaysia
Ahmed Elmalla
 
PPTX
Introduction to Artificial Intelligence and Machine Learning with Python
AIMDek Technologies
 
PDF
AI for Data Analysis and Visualization.pdf
Mohammad Usman
 
PPTX
Comparing EDA with classical and Bayesian analysis.pptx
PremaGanesh1
 
PDF
Machine Learning Foundations for Professional Managers
Albert Y. C. Chen
 
PDF
pythondatasciencehandbook with oops concepts.pdf
RMani7
 
PPTX
Lecture 1 Pandas Basics.pptx machine learning
my6305874
 
PPTX
Advances in Exploratory Data Analysis, Visualisation and Quality for Data Cen...
Hima Patel
 
PPTX
VANITHA S.docx.pptxdata science with python
ksaravanakumar450
 
PDF
Python For Data Analysis 3rd Wes Mckinney
luvoszugrav
 
PDF
De-Cluttering-ML | TechWeekends
DSCUSICT
 
PDF
Python for Data Analysis_ Data Wrangling with Pandas, Numpy, and Ipython ( PD...
R.K.College of engg & Tech
 
PDF
The Art of Intelligence – A Practical Introduction Machine Learning for Orac...
Lucas Jellema
 
Pandas, Data Wrangling & Data Science
Krishna Sankar
 
How to implement artificial intelligence solutions
Carlos Toxtli
 
Artificial intelligence: Simulation of Intelligence
Abhishek Upadhyay
 
EDA.pptx
yovi pratama
 
Data Science and Machine Learning Using Python and Scikit-learn
Asim Jalis
 
Machine learning at b.e.s.t. summer university
László Kovács
 
Wes McKinney - Python for Data Analysis-O'Reilly Media (2012).pdf
Blue Sea
 
Data Science & AI Road Map by Python & Computer science tutor in Malaysia
Ahmed Elmalla
 
Introduction to Artificial Intelligence and Machine Learning with Python
AIMDek Technologies
 
AI for Data Analysis and Visualization.pdf
Mohammad Usman
 
Comparing EDA with classical and Bayesian analysis.pptx
PremaGanesh1
 
Machine Learning Foundations for Professional Managers
Albert Y. C. Chen
 
pythondatasciencehandbook with oops concepts.pdf
RMani7
 
Lecture 1 Pandas Basics.pptx machine learning
my6305874
 
Advances in Exploratory Data Analysis, Visualisation and Quality for Data Cen...
Hima Patel
 
VANITHA S.docx.pptxdata science with python
ksaravanakumar450
 
Python For Data Analysis 3rd Wes Mckinney
luvoszugrav
 
De-Cluttering-ML | TechWeekends
DSCUSICT
 
Python for Data Analysis_ Data Wrangling with Pandas, Numpy, and Ipython ( PD...
R.K.College of engg & Tech
 
The Art of Intelligence – A Practical Introduction Machine Learning for Orac...
Lucas Jellema
 

Recently uploaded (20)

PPTX
Views on Education of Indian Thinkers Mahatma Gandhi.pptx
ShrutiMahanta1
 
PPTX
THE TAME BIRD AND THE FREE BIRD.pptxxxxx
MarcChristianNicolas
 
PDF
Generative AI: it's STILL not a robot (CIJ Summer 2025)
Paul Bradshaw
 
PPTX
Growth and development and milestones, factors
BHUVANESHWARI BADIGER
 
PPTX
A PPT on Alfred Lord Tennyson's Ulysses.
Beena E S
 
PDF
The Different Types of Non-Experimental Research
Thelma Villaflores
 
PPTX
BANDHA (BANDAGES) PPT.pptx ayurveda shalya tantra
rakhan78619
 
PDF
IMP NAAC-Reforms-Stakeholder-Consultation-Presentation-on-Draft-Metrics-Unive...
BHARTIWADEKAR
 
PPTX
2025 Winter SWAYAM NPTEL & A Student.pptx
Utsav Yagnik
 
PPTX
ASRB NET 2023 PREVIOUS YEAR QUESTION PAPER GENETICS AND PLANT BREEDING BY SAT...
Krashi Coaching
 
PPTX
How to Set Maximum Difference Odoo 18 POS
Celine George
 
PPTX
PPT on the Development of Education in the Victorian England
Beena E S
 
PPTX
HYDROCEPHALUS: NURSING MANAGEMENT .pptx
PRADEEP ABOTHU
 
PDF
The dynastic history of the Chahmana.pdf
PrachiSontakke5
 
PDF
LAW OF CONTRACT (5 YEAR LLB & UNITARY LLB )- MODULE - 1.& 2 - LEARN THROUGH P...
APARNA T SHAIL KUMAR
 
PPTX
Soil and agriculture microbiology .pptx
Keerthana Ramesh
 
PDF
LAW OF CONTRACT ( 5 YEAR LLB & UNITARY LLB)- MODULE-3 - LEARN THROUGH PICTURE
APARNA T SHAIL KUMAR
 
PPTX
MENINGITIS: NURSING MANAGEMENT, BACTERIAL MENINGITIS, VIRAL MENINGITIS.pptx
PRADEEP ABOTHU
 
PPSX
Health Planning in india - Unit 03 - CHN 2 - GNM 3RD YEAR.ppsx
Priyanshu Anand
 
PPTX
STAFF DEVELOPMENT AND WELFARE: MANAGEMENT
PRADEEP ABOTHU
 
Views on Education of Indian Thinkers Mahatma Gandhi.pptx
ShrutiMahanta1
 
THE TAME BIRD AND THE FREE BIRD.pptxxxxx
MarcChristianNicolas
 
Generative AI: it's STILL not a robot (CIJ Summer 2025)
Paul Bradshaw
 
Growth and development and milestones, factors
BHUVANESHWARI BADIGER
 
A PPT on Alfred Lord Tennyson's Ulysses.
Beena E S
 
The Different Types of Non-Experimental Research
Thelma Villaflores
 
BANDHA (BANDAGES) PPT.pptx ayurveda shalya tantra
rakhan78619
 
IMP NAAC-Reforms-Stakeholder-Consultation-Presentation-on-Draft-Metrics-Unive...
BHARTIWADEKAR
 
2025 Winter SWAYAM NPTEL & A Student.pptx
Utsav Yagnik
 
ASRB NET 2023 PREVIOUS YEAR QUESTION PAPER GENETICS AND PLANT BREEDING BY SAT...
Krashi Coaching
 
How to Set Maximum Difference Odoo 18 POS
Celine George
 
PPT on the Development of Education in the Victorian England
Beena E S
 
HYDROCEPHALUS: NURSING MANAGEMENT .pptx
PRADEEP ABOTHU
 
The dynastic history of the Chahmana.pdf
PrachiSontakke5
 
LAW OF CONTRACT (5 YEAR LLB & UNITARY LLB )- MODULE - 1.& 2 - LEARN THROUGH P...
APARNA T SHAIL KUMAR
 
Soil and agriculture microbiology .pptx
Keerthana Ramesh
 
LAW OF CONTRACT ( 5 YEAR LLB & UNITARY LLB)- MODULE-3 - LEARN THROUGH PICTURE
APARNA T SHAIL KUMAR
 
MENINGITIS: NURSING MANAGEMENT, BACTERIAL MENINGITIS, VIRAL MENINGITIS.pptx
PRADEEP ABOTHU
 
Health Planning in india - Unit 03 - CHN 2 - GNM 3RD YEAR.ppsx
Priyanshu Anand
 
STAFF DEVELOPMENT AND WELFARE: MANAGEMENT
PRADEEP ABOTHU
 
Ad

From BasicToAdvanced-FFN, Neuron, Activation Function.pdf

  • 1. Introduction to Artificial Intelligence Disclaimer: The content is curated for educational purposes only. Introduction to Artificial Intelligence
  • 2. Introduction to Artificial Intelligence Learning Objectives You will learn in this lesson: • Users will gain an understanding of fundamental concepts of AI • Users will acquire knowledge and skills to analyze data.
  • 3. Introduction to Artificial Intelligence Hands-on 1: Demo on chatGPT Reference link Click here
  • 4. Introduction to Artificial Intelligence We live with AI Socratic Replika: My AI Friend FaceApp
  • 5. Introduction to Artificial Intelligence Artificial Intelligence (AI) is a field of computer science that aims to create machines capable of emulating human intelligence, enabling them to perform tasks like problem-solving and learning from data. Artificial Intelligence
  • 6. Introduction to Artificial Intelligence Generative AI refers to artificial intelligence systems that have the ability to create new data, such as text, images, or other content, often mimicking human-like creativity and generation. • Content Generation • Creative Capabilities • Applications • Models • Potential for Misuse Generative AI
  • 7. Introduction to Artificial Intelligence Discriminative AI specializes in classifying and predicting data based on learned patterns, but it doesn't generate new content. • Classification and Prediction • Data-Driven • Not Creative • Widely Used Discriminative AI
  • 8. Introduction to Artificial Intelligence Hands-on 2: Demo on Lobe Lobe AI is a tool that allows you to create machine learning models without the need for extensive programming knowledge. It focuses on making machine learning more accessible to a broader audience, including those who may not be familiar with traditional coding or data science techniques ▪ User-Friendly Interface ▪ No Coding Required ▪ Image and Data Classification ▪ Customizable Models ▪ Export Options ▪ Support for TensorFlow ▪ Community and Resources About Lobe AI:
  • 9. Introduction to Artificial Intelligence Disclaimer: The content is curated for educational purposes only. Exploratory Data Analysis (EDA)
  • 10. Introduction to Artificial Intelligence What is EDA? • Exploratory data analysis (EDA) involves using graphics and visualizations to explore and analyse a data set. The goal is to explore, investigate and learn, as opposed to confirming statistical hypotheses. • The process of using numerical summaries and visualizations to explore your data and to identify potential relationships between variables is called exploratory data analysis, or EDA. Reference link Click here
  • 11. Introduction to Artificial Intelligence A Typical EDA Process Reference link Click here
  • 12. Introduction to Artificial Intelligence Univariate Analysis • Univariate analysis examines a single variable's properties, whether quantitative (e.g., numerical) or categorical (e.g., qualitative). • It provides insights into the distribution, central tendency, and variability of the variable, using statistical measures and graphical representations. • Univariate analysis is an essential initial step in data exploration and hypothesis testing, focusing solely on one variable without considering relationships with other variables.
  • 13. Introduction to Artificial Intelligence Bivariate Analysis • Explains how two variables are related. • Bivariate analysis is a crucial step in data analysis, allowing for a deeper understanding of the interplay between two variables before moving to more complex multivariate analysis. Multivariate Analysis • Involves the simultaneous examination of three or more variables to uncover complex relationships and interactions among them. • It employs various statistical methods to gain a deeper understanding of how multiple variables collectively influence data patterns.
  • 14. Introduction to Artificial Intelligence What are Outliers? “A celebrity in the crowd of commoners is an outlier” Reference link Click here
  • 15. Introduction to Artificial Intelligence What are Outliers? We all have heard of the idiom ‘odd one out which means something unusual in comparison to the others in a group. Similarly, an Outlier is an observation in a given dataset that lies far from the rest of the observations. That means an outlier is vastly larger or smaller than the remaining values in the set. Why do they occur? An outlier may occur due to the variability in the data, or due to experimental error/human error. They may indicate an experimental error or heavy skewness in the data(heavy-tailed distribution).
  • 16. Introduction to Artificial Intelligence Many tools are available in the market, which make it easier for us: 1. To process and manipulate data 2. Analyse the relationships and correlations between data sets,​ 3. Helps to identify patterns and trends for interpretation Data Analysis Tools
  • 17. Introduction to Artificial Intelligence Hands-on 3: EDA Pre-Processing (NumPy) Pre-processing involves getting the data into a suitable format for analysis. This step ensures that the data is accurate, complete, and ready for modeling. ▪ Data Cleaning ▪ Data Transformation ▪ Feature Engineering ▪ Handling Missing Values ▪ Encoding Categorical Variables ▪ Dealing with Outliers ▪ Data Splitting
  • 19. Introduction to Artificial Intelligence What is Pandas? 1. Pandas is a Python library used for working with data sets (csv, json..,etc). 2. It has functions for 1. analyzing, 2. cleaning, 3. exploring, 4. and manipulating data. 3. The name "Pandas" has a reference to both "Panel Data", and "Python Data Analysis" and was created by Wes McKinney in 2008.
  • 20. Introduction to Artificial Intelligence Why Use Pandas? 1. Pandas allows us to analyze big data. 2. It makes conclusions based on statistical theories operations 3. Pandas can clean messy data sets(in a larger size) 4. Pandas helps us to convert readable 5. Helps to find the relevant information from big data.
  • 21. Introduction to Artificial Intelligence What Can Pandas Do? We can find the, • Correlation between two or more columns • We can find basic descriptive analysis 1. Mean 2. Median 3. Std 4. IQR (Inter Quartile Range) 5. Find Max value & Min value?
  • 22. Introduction to Artificial Intelligence Environmental Setup Installation of Pandas Windows pip install pandas or conda install pandas Linux pip3 install pandas
  • 23. Introduction to Artificial Intelligence Series Pandas Series - Name Pandas Series - Index Pandas Series - Values Create a simple Pandas Series from a list:
  • 24. Introduction to Artificial Intelligence Series Pandas Series - Name Pandas Series – Index – [0,1,…etc] / we can give any name as label for index. Pandas Series - Values Create the label Pandas Series
  • 25. Introduction to Artificial Intelligence Series Create a simple Pandas Series from a dictionary
  • 26. Introduction to Artificial Intelligence DataFrames A Series is essentially a column, and a DataFrame is a multi-dimensional table made up of a collection of Series.
  • 27. Introduction to Artificial Intelligence DataFrames Create a simple Pandas DataFrame
  • 28. Introduction to Artificial Intelligence DataFrames Named Indexes – Data Frame apples oranges day1 420 50 day2 380 40 day3 390 45
  • 29. Introduction to Artificial Intelligence DataFrames Locate Named Indexes– Data Frame #refer to the named index: print(df.loc["day2"]) Output: apples 380 oranges 40 Name: 0, dtype: int64
  • 30. Introduction to Artificial Intelligence Read & Write Reference link Click here
  • 31. Introduction to Artificial Intelligence Reference link Click here
  • 32. Introduction to Artificial Intelligence Read CSV Files import pandas as pd df = pd.read_csv('data.csv') print(df.to_string()) 1. A simple way to store big data sets is to use CSV files (comma separated files). 2. CSV files contains plain text and is a well know format that can be read by everyone including Pandas. 3. In our examples we will be using a CSV file called 'data.csv’.
  • 33. Introduction to Artificial Intelligence Read JSON file import pandas as pd df = pd.read_json('data.json') print(df.to_string()) JSON is plain text which is written in JavaScript object natation. This file has .json as its extension, with the data inside it represented in a key:value pair. In our examples we will be using a JSON file called 'data.json'.
  • 34. Introduction to Artificial Intelligence Indexing in Pandas An index is like an address, that’s how any data point across the data frame or series can be accessed. Rows and columns both have indexes, rows indices are called index, and columns by its general column names. • .loc is used for labels • .iloc is used for position numbers Let us assume Geeta, Mahima & Shruti are standing at positions 1, 2, & 3, respectively. If you want to call Mahima, you have two options, either you call her by her name or her position number. So, if you call Mahima by her name “Mahima”, you will use .loc and if we will call her by her position number “2” we will use .iloc.
  • 35. Introduction to Artificial Intelligence Indexing in Pandas
  • 36. Introduction to Artificial Intelligence Conditional Selection For example, suppose that we're interested specifically in better-than-average wines produced in Italy. We can start by checking if each wine is Italian or not:
  • 37. Introduction to Artificial Intelligence Conditional Selection This operation produced a Series of True/False booleans based on the country of each record. This result can then be used inside of loc to select the relevant data: reviews.loc[reviews.country == 'Italy']
  • 38. Introduction to Artificial Intelligence Conditional Selection We can use the ampersand (&) to bring the two questions together: reviews.loc[(reviews.country == 'Italy') & (reviews.points >= 90)]
  • 39. Introduction to Artificial Intelligence Pandas – Data Handling The data set contains some empty cells ("Date" in row 22, and "Calories" in row 18 and 28). The data set contains wrong format ("Date" in row 26).
  • 40. Introduction to Artificial Intelligence Pandas – Data Handling Remove Rows: One way to deal with empty cells is to remove rows that contain empty cells.
  • 41. Introduction to Artificial Intelligence Pandas – Data Handling Remove all rows with NULL values using inplace parameter
  • 42. Introduction to Artificial Intelligence Pandas – Data Handling Replace Empty Values: The fillna() method allows us to replace empty cells with a value:
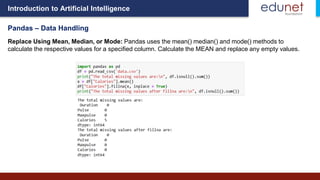
  • 43. Introduction to Artificial Intelligence Pandas – Data Handling Replace Using Mean, Median, or Mode: Pandas uses the mean() median() and mode() methods to calculate the respective values for a specified column. Calculate the MEAN and replace any empty values.
  • 44. Introduction to Artificial Intelligence Pandas – Data Handling Finding Relationships: A great aspect of the Pandas module is the corr() method. The corr() method calculates the relationship between each column in your data set.
  • 45. Introduction to Artificial Intelligence Pandas – Data Handling Discovering Duplicates: Duplicate rows are rows that have been registered more than one time. The duplicated() method returns a Boolean values for each row. Returns True for every row that is a duplicate, otherwise False
  • 46. Introduction to Artificial Intelligence Lab 4 – EDA- Univariate, Bivariate and Multivariate Analysis (Pandas) Data Analysis (EDA) is a crucial step in the data analysis process. It involves examining and visualizing data to understand its underlying patterns, relationships, and characteristics. EDA can be divided into three main categories: Univariate, Bivariate, and Multivariate analysis.
  • 47. Introduction to Artificial Intelligence What is Data Visualization? Data visualization deals with a visual representation of data and is part of data analysis. It is the process of translating data into a chart, graph, or other visual components. Reference link Click here
  • 48. Introduction to Artificial Intelligence Plotting and Visualization Data visualization packages and tools are required to provide an accessible way to analyze massive amounts of information and understand trends and patterns in data.
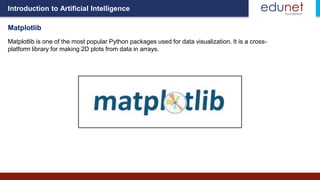
  • 49. Introduction to Artificial Intelligence Matplotlib Matplotlib is one of the most popular Python packages used for data visualization. It is a cross- platform library for making 2D plots from data in arrays.
  • 50. Introduction to Artificial Intelligence Line Plot According to the wiki, “A line chart or line plot or line graph is a type of chart which displays information as a series of data points called ‘markers’ connected by straight line segments. It is a basic type of chart common in many fields” Reference link Click here
  • 51. Introduction to Artificial Intelligence Bar Plot A bar chart or bar graph is a chart or graph that presents categorical data with rectangular bars with heights or lengths proportional to the values that they represent. The bars can be plotted vertically or horizontally. Syntax: ax.bar(x, height, width, bottom, align) plt.bar(x,y)
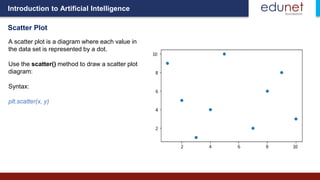
  • 52. Introduction to Artificial Intelligence Scatter Plot A scatter plot is a diagram where each value in the data set is represented by a dot. Use the scatter() method to draw a scatter plot diagram: Syntax: plt.scatter(x, y)
  • 53. Introduction to Artificial Intelligence 3-D Plotting in Matplotlib • Three-dimensional plots are enabled by importing the mplot3d toolkit, included with the main Matplotlib installation: • from mpl_toolkits import mplot3d • Syntax: plt.plot3D() Reference link Click here
  • 54. Introduction to Artificial Intelligence Pie Chart • Matplotlib API has pie() function in its pyplot module which creates a pie chart representing the data in an array. • Syntax: plt.pie(data) Reference link Click here
  • 55. Introduction to Artificial Intelligence Hands-on 5 – EDA- Descriptive Analysis with Visualization Exploratory Data Analysis (EDA) involves examining and visualizing data to gain insights and understand its underlying patterns. It's an essential step in the data analysis process. Here's a breakdown of how to perform EDA with descriptive analysis and visualization
  • 56. Introduction to Artificial Intelligence Day 1 Take Home Activity
  • 57. Introduction to Artificial Intelligence Summary • AI leverages advanced algorithms to automate data analysis and decision-making. • EDA provides the foundational insights needed for AI models. • Together, AI and EDA empower organizations to efficiently process and gain valuable insights from large datasets, leading to data-driven decision-making.
  • 58. Introduction to Artificial Intelligence Quiz 1. Which subfield of AI focuses on developing algorithms that allow computers to learn from and make predictions or decisions based on data? a) Machine learning b) Natural language processing c) Robotics d) Computer vision Answer: a) Machine learning
  • 59. Introduction to Artificial Intelligence Quiz 2. What is the primary goal of Artificial Intelligence (AI)? a) To create machines that can think and behave like humans b) To automate tasks and improve efficiency c) To develop advanced algorithms for data analysis d) To simulate natural processes and phenomena Answer: b) To automate tasks and improve efficiency
  • 60. Introduction to Artificial Intelligence 3. What is the difference between narrow or weak AI and general or strong AI? a) Narrow AI can perform specific tasks, while general AI can understand and perform any intellectual task that a human being can do. b) Narrow AI is less efficient than general AI in problem-solving. c) Narrow AI is more expensive to develop than general AI. d) Narrow AI is based on rule-based systems, while general AI uses neural networks. Answer: a) Narrow AI can perform specific tasks, while general AI can understand and perform any intellectual task that a human being can do. Quiz
  • 61. Introduction to Artificial Intelligence Reference • https://commons.wikimedia.org/wiki/File:Artificial_Intelligence_%26_AI_%26_Machine_Learning_- _30212411048.jpg • https://study.com/academy/lesson/artificial-intelligence-in-everyday-life.html • https://d1m75rqqgidzqn.cloudfront.net/wp-data/2019/11/12140511/shutterstock_519560572.jpg • https://www.simplilearn.com/tutorials/artificial-intelligence-tutorial/what-is-artificial-intelligence • https://www.tractica.com/ • https://static.javatpoint.com/tutorial/ai/images/subsets-of-ai.png • https://docs.microsoft.com/en-us/azure/architecture/data-guide/big-data/ai-overview
  • 62. Introduction to Artificial Intelligence Thank you!