SlideShare a Scribd company logo
Graph based machine learning
with applications to media analytics 
                
             Lei Ding, PhD
               9-1-2011


          with collaborators at
Outline
•  Graph based machine learning
   –  Basic structures
   –  Algorithms
   –  Examples
•  Applications in media analytics
   –  Social analysis of videos
   –  Content analysis of images
Outline
•  Graph based machine learning
   –  Basic structures
   –  Algorithms
   –  Examples
•  Applications in media analytics
   –  Social analysis of videos
   –  Content analysis of images
What is a graph


      Not the graph we are going to talk about
What is a graph
•  A graph is composed of
   –  Vertices (nodes): pixels, actors in videos, genes, ads, etc.
   –  Edges: their relations
   –  In machine learning, we are interested in predicting some quantity
      (a class label, or a continuous value) at each unlabeled vertex
What is a graph
•  A graph is composed of
    –  Vertices (nodes): pixels, actors in videos, genes, ads, etc.
    –  Edges: their relations
    –  In machine learning, we are interested in predicting some quantity
       (a class label, or a continuous value) at each unlabeled vertex
•  Broadly speaking, there are two kinds of graphs


                 undirected                           directed
Graph based machine learning for
              media analytics
•  Oftentimes, media content can be represented using graphs
•  Therefore, challenging inference problems with media content
   can be answered by learning on graphs
Social content model

Content network
encodes content
similarity (videos,
audios, etc.)
                                                        Content generation
                                                        process

Social network
encodes peoples’
social connections


   Can be used for media genre classification, media recommendation, etc.
Graph based machine learning
•  On undirected graphs
   –  Optimization based approaches (e.g. energy minimization)
   –  Probabilistic models (e.g. random fields)
•  On directed graphs
   –  Optimization based approaches (e.g. directed energy minimization)
   –  Probabilistic models (e.g. latent Dirichlet allocation, Bayesian networks)
Relations
•  How are they related to traditional stats learning (e.g. logistic regression)


                           (Sutton  McCallum, 2007)
Graph based machine learning
•  On undirected graphs
   –  Optimization based approaches (e.g. energy minimization)
   –  Probabilistic models (e.g. random fields)
•  On directed graphs
   –  Optimization based approaches (e.g. directed energy minimization)
   –  Probabilistic models (e.g. latent Dirichlet allocation, Bayesian networks)
Learning on undirected graphs
•  Classification methods
   –  We have some labeled data, and
      want to predict labels for others
   –  e.g. manifold regularization


•  Clustering methods
   –  We would like to partition data
      into clusters
   –  e.g. spectral clustering
Constructing data graphs
•  How to transform a dataset ({xi}, i=1..m) into a graph
Affinity matrix
•  A graph is usually represented using an affinity matrix W,
   where the corresponding entry is 1 if two vertices are
   connected, and 0 otherwise
Graph Laplacians
•  L=D-W, where W is an affinity matrix, D is a diagonal matrix of
   row sums


•  Discretization of Laplace-Beltrami operator on manifolds, which
   is the sum of second order derivatives on tangent space (more
   details later)
Function on graph
•  A vector can be used to represent a function over the graph
   –  We can encode what we already know or what we want to predict in a
      label function
   –  For example in this graph, a vertex can represent a person, and the
      function can represent if he is a likely customer
                             0         1

                                             1

                                   1
                         0

                0

                       f = [ 1, 1, 0, 0, 1, 0 ]   T
Eigenvectors reviewed
Properties of graph Laplacians
•  Symmetric and positive semi-definite
•  Graph Laplacian induces a smoothness term
   –  Transposed label function f * Laplacian matrix L * label function f (always
      non-negative)

   –  Smoothness term (fTLf) measures how much the function f varies with
      respect to the underlying graph
   –  We have labels on some vertices, and want to predict labels on other
      vertices. A smooth function (small fTLf) typically predicts well
•  Laplacian eigenvectors with small eigenvalues can be used for
   data clustering / classification, data set parametrization, image
   segmentation, etc.

         Now we are ready to see the algorithms, but let’s
         take a little break to understand things even further
Manifolds
Manifold perspective of
    data modeling
Why graphs encode underlying
           data geometry
If we consider data as samples from an underlying manifold (which is a fairly weak
assumption), and construct the corresponding adjacency graph, then eigenvectors
of graph Laplacian approximate eigenfunctions of the Laplace-Beltrami operator
of the underlying data manifold


                                                    (Belkin  Niyogi, 2008)
Laplacian eigenvectors
“understand” geometry


         (Rustamov, 2007)
Spectral clustering


        More information in von Luxburg (2007)
Spectral clustering explained
•  Why the eigenvectors of L with small eigenvalues are used as the new
   representation?
•  The minimizers fi for the following total smoothness term are eigenvectors
   of L with the smallest eigenvalues
Results
Laplacian eigenmap
•  Using Laplacian eigenvectors with the smallest eigenvalues as
   the new representation
•  Can be seen as a non-linear extension of PCA


                                       (Belkin  Niyogi, 2003)
Results on real data
•  Transform data using Laplacian eigenmap, and use linear
   regression on the new representation


                         (Belkin  Niyogi, 2004)
Manifold regularization
•  A comprehensive regularization framework


•  Through applying the representer theorem in functional
   analysis, the optimal solution is as follows


                     (Belkin et al., 2006)
Results on real data


          (Belkin et al., 2006)
Summary
•  Learning on graphs provides a set of powerful techniques for
   data analysis and predictive analytics that “understand” the
   geometry of underlying data
•  Spectral clustering – addresses the limitation with traditional
   K-means
•  Laplacian eigenmap  manifold regularization – learn a label
   function respecting underlying data geometry, and hence
   provide benefits over standard methods like PCA and linear
   regression
•  Lots of other approaches as well – will talk about label
   propagation based on graphs later in this presentation
Outline
•  Graph based machine learning
   –  Basic structures
   –  Algorithms
   –  Examples
•  Applications in media analytics
   –  Social analysis of videos
   –  Content analysis of images
Applications in media analytics
       High-level analysis
    Social relational inference
                                   People to communities


        Mid-level analysis
         Event detection
                                  Visual features to events


         Low-level analysis
          Segmentation
                                  Pixels to semantic objects
Application 1: social analysis of
              multimedia data


Friends or foes?   Acquaintances or strangers?   In same or different teams?
Social network learning and analysis


(Ding  Yilmaz, 2010; 2011)
Application areas
•  Social content: given the growing popularity of social media, inferring
   relations among people is becoming important
•  Visual recognition: social context is shown to help improve
   recognition results from images (e.g. Wang et al., ECCV 10)
•  Surveillance: social network learning and analysis for surveillance
   applications (e.g. Yu et al., CVPR 2009)
•  Sociology: necessary step in building intelligent systems for aiding
   sociological discovery
Basic video processing
•  Videos segmented into semantic segments
   –  Scenes, or visually coherent sets of shots, for movies and TV shows
   –  Shot detection and merging based on key-frame similarity (Rasheed
       Shah, 03)
•  Identifying the actors appearing in each segment
   –  Using scripts and closed captions for movies
   –  Face detection and recognition for other videos
Actor appearance matrix
Overall process
                                                Social Relations     video-level


A number [-1,+1] for each scene: positive
if actors in a scene are likely in the same      Grouping cues
community, negative if otherwise


                                                                     scene-level
Estimate the likely events in a scene
                                                Event estimates


 Dynamic systems represent scenes
                                                 Scene models


                                              Feature observations   frame-level
Key steps
Visual features
•  Generic optical flow orientation histogram
Auditory features
Using visual concepts
•  Visual concept detection provides useful semantic features for inferring
   social relations
•  Using Columbia s 374 SVM concept detectors on color/texture/edge
   features, a concept score vector is generated for each scene
Evidence synthesis by Gaussian processes
Learned social affinity

—  Learned social network is represented by affinity matrix K
Learned social networks
RACOM dataset
•  Ten example movies: (1) G.I. Joe: The Rise of Cobra (2009); (2) Harry
   Potter and the Half-Blood Prince (2009); (3) Public Enemies (2009); (4)
   Troy (2004); (5) Braveheart (1995); (6) Year One (2009); (7) Coraline
   (2009); (8) True Lies (1994); (9) The Chronicles of Narnia: The Lion, the
   Witch and the Wardrobe (2005); (10) The Lord of the Rings: The Return
   of the King (2003) .
Analyzing social networks
•  We extend the max-min modularity principle such that it works with the
   learned social networks, in order to detect the two communities for each
   movie
•  We also identify the leaders of each community, which interestingly,
   correspond to the hero/villain most of the time
Max-min modularity
Visual maps
Quantitative evaluation
Detected social communities
Youtube dataset
•  10 videos for soccer games; 10 videos for demonstration;
•  The goal here is to predict a grouping cue for each scene.
   We evaluate against ground truth labeling
Youtube results
•  Event categories are considered and labeled in a middle step
    –  Soccer: (chasing, confronting, hugging, others)
    –  Demonstration: (marching, confronting, public speaking, others)
•  Precision (+) for within-community instances and Precision (-) for across-
   community instances are reported separately
Application 2: image content analysis
•  Interactive whole-object segmentation
    –  Inputs: an image  labeled pixels (seeds) for objects/background
    –  Outputs: labels for all other pixels


                          (Ding  Yilmaz, 2010)
Overview
•  To segment whole objects from images given user-supplied seeds
    –  Different from unsupervised segmentation from a single image,
       which typically generates homogeneous regions
    –  The challenge is to segment objects using a small number of seeds
•  In addressing this problem, we have proposed
    –  Probabilistic hypergraph image model (PHIM)
    –  Automatic label set augmentation using boundary features
    –  Multiple view learning synthesizing features
Graphs vs. hypergraphs
•  Graph based approaches have been popular for interactive segmentation
    –  Graph cut (Rother et al., 2004)
    –  Random walk (Grady, 2006)
•  Hypergraphs vs. graphs for images
    –  Higher order relations among pixels that tend to form a segment are
       encoded as hyperedges, which are collections of vertices
    –  Model long-range dependencies among the entities (known and unknown
       labels)
Our model: PHIM
•  We propose to use probabilistic hypergraph image model
   (PHIM)
   –  The relation between a hyperedge and a vertex is probabilistic, based
      on probabilities learned from image appearance characteristics
•  Vertices: superpixels
•  Hyperedges: pair-wise + higher-order (generated by mean-
   shift weak segmentation with varying color bandwidths)
Our model: PHIM (cont’d)
•  Feature vector Fs of a superpixel s contains average LUV color values
•  Incidences: kernel density estimator taking superpixel features as the input


•  Hyperedge weights: inhomogeneous hyperedges are down-weighted
    –  Reduces to standard graph based edge weights when the hyperedge is of
       size 2
Laplacians on PHIM
•  Normalized Laplacians on PHIM: induced quadratic form measures the
   smoothness of a function with respect to the underlying edge system
    –  We use probabilistic incidences (hv,e) in defining Laplacians on PHIM


•  Notations
    –  f: vector of function values on vertices (+1 for object; -1 for
       background)
    –  H: probabilistic incidence matrix; W: hyperedge weight matrix
    –  De: hyperedge degree matrix; Dv: vertex degree matrix
How to do segmentation
•  Constrained smoothness minimization
   –  Essentially an interpolation, as we have confidence in user-supplied
      segment labels


•  This interpolation can also be solved in an iterative manner
   using the natural random walk
Dataset
•  GrabCut dataset of 50 images (Rother et al., 2004)
•  Seed pixels are provided in the form of trimaps
•  Ground-truth segmentations are supplied
Results on segmentation
•  Error rates averaged over the GrabCut dataset of 50 images
   –  PHIM performs better than a standard graph
   –  Our error rate 5.33% is much better than 7.9% achieved in (Blake et al.,
      2006), and is comparable to state-of-the-art results from pixel-level
      optimization
Comparative results
The end
•  Thanks!
•  References
   –  Ulrike von Luxburg, A Tutorial on Spectral Clustering, 2007
   –  Charles Sutton and Andrew McCallum, An Introduction to Conditional Random Fields for
      Relational Learning, 2007
   –  Raif Rustamov, Laplace-Beltrami Eigenfunctions for Deformation Invariant Shape Representation,
      2007
   –  Mikhail Belkin and Partha Niyogi, Laplacian Eigenmaps for Dimensionality Reduction and Data
      Representation, 2003
   –  Mikhail Belkin and Partha Niyogi, Semi-Supervised Learning on Riemannian Manifolds, 2004
   –  Mikhail Belkin, Partha Niyogi and Vikas Sindwani, Manifold Regularization: A Geometric
      Framework for Learning from Labeled and Unlabeled Examples, 2006
   –  Mikhail Belkin and Partha Niyogi, Convergence of Laplacian Eigenmaps, 2008
   –  Lei Ding and Alper Yilmaz, Learning Relations Among Movie Characters: A Social Network
      Perspective, 2010
   –  Lei Ding and Alper Yilmaz, Interactive Image Segmentation Using Probabilistic Hypergraphs,
      2010
   –  Lei Ding and Alper Yilmaz, Inferring Social Relations from Visual Concepts, 2011
Ad

More Related Content

What's hot (20)

Introduction to Machine learning
Introduction to Machine learningIntroduction to Machine learning
Introduction to Machine learning
Knoldus Inc.
 
Machine Learning Introduction
Machine Learning IntroductionMachine Learning Introduction
Machine Learning Introduction
Pranav Prakash
 
Introduction to Machine Learning
Introduction to Machine LearningIntroduction to Machine Learning
Introduction to Machine Learning
Rahul Jain
 
What is Machine Learning
What is Machine LearningWhat is Machine Learning
What is Machine Learning
Bhaskara Reddy Sannapureddy
 
Machine learning
Machine learningMachine learning
Machine learning
eonx_32
 
Deep Learning for Recommender Systems @ TDC SP 2019
Deep Learning for Recommender Systems @ TDC SP 2019Deep Learning for Recommender Systems @ TDC SP 2019
Deep Learning for Recommender Systems @ TDC SP 2019
Gabriel Moreira
 
Meetup sthlm - introduction to Machine Learning with demo cases
Meetup sthlm - introduction to Machine Learning with demo casesMeetup sthlm - introduction to Machine Learning with demo cases
Meetup sthlm - introduction to Machine Learning with demo cases
Zenodia Charpy
 
Unified Approach to Interpret Machine Learning Model: SHAP + LIME
Unified Approach to Interpret Machine Learning Model: SHAP + LIMEUnified Approach to Interpret Machine Learning Model: SHAP + LIME
Unified Approach to Interpret Machine Learning Model: SHAP + LIME
Databricks
 
Machine learning module 2
Machine learning module 2Machine learning module 2
Machine learning module 2
Gokulks007
 
Data! Data! Data! I Can't Make Bricks Without Clay!
Data! Data! Data! I Can't Make Bricks Without Clay!Data! Data! Data! I Can't Make Bricks Without Clay!
Data! Data! Data! I Can't Make Bricks Without Clay!
Turi, Inc.
 
Introduction to machine learning
Introduction to machine learningIntroduction to machine learning
Introduction to machine learning
Ganesh Satpute
 
Deep Recommender Systems - PAPIs.io LATAM 2018
Deep Recommender Systems - PAPIs.io LATAM 2018Deep Recommender Systems - PAPIs.io LATAM 2018
Deep Recommender Systems - PAPIs.io LATAM 2018
Gabriel Moreira
 
Automatic machine learning (AutoML) 101
Automatic machine learning (AutoML) 101Automatic machine learning (AutoML) 101
Automatic machine learning (AutoML) 101
QuantUniversity
 
Interpretable machine learning
Interpretable machine learningInterpretable machine learning
Interpretable machine learning
Sri Ambati
 
Brief introduction to Machine Learning
Brief introduction to Machine LearningBrief introduction to Machine Learning
Brief introduction to Machine Learning
CodeForFrankfurt
 
Search Accuracy Metrics and Predictive Analytics - A Big Data Use Case: Prese...
Search Accuracy Metrics and Predictive Analytics - A Big Data Use Case: Prese...Search Accuracy Metrics and Predictive Analytics - A Big Data Use Case: Prese...
Search Accuracy Metrics and Predictive Analytics - A Big Data Use Case: Prese...
Lucidworks
 
Introduction to Machine Learning
Introduction to Machine LearningIntroduction to Machine Learning
Introduction to Machine Learning
James Ward
 
Simple overview of machine learning
Simple overview of machine learningSimple overview of machine learning
Simple overview of machine learning
priyadharshini R
 
Ferruzza g automl deck
Ferruzza g   automl deckFerruzza g   automl deck
Ferruzza g automl deck
Eric Dill
 
Artificial Intelligence at LinkedIn
Artificial Intelligence at LinkedInArtificial Intelligence at LinkedIn
Artificial Intelligence at LinkedIn
Bill Liu
 
Introduction to Machine learning
Introduction to Machine learningIntroduction to Machine learning
Introduction to Machine learning
Knoldus Inc.
 
Machine Learning Introduction
Machine Learning IntroductionMachine Learning Introduction
Machine Learning Introduction
Pranav Prakash
 
Introduction to Machine Learning
Introduction to Machine LearningIntroduction to Machine Learning
Introduction to Machine Learning
Rahul Jain
 
Machine learning
Machine learningMachine learning
Machine learning
eonx_32
 
Deep Learning for Recommender Systems @ TDC SP 2019
Deep Learning for Recommender Systems @ TDC SP 2019Deep Learning for Recommender Systems @ TDC SP 2019
Deep Learning for Recommender Systems @ TDC SP 2019
Gabriel Moreira
 
Meetup sthlm - introduction to Machine Learning with demo cases
Meetup sthlm - introduction to Machine Learning with demo casesMeetup sthlm - introduction to Machine Learning with demo cases
Meetup sthlm - introduction to Machine Learning with demo cases
Zenodia Charpy
 
Unified Approach to Interpret Machine Learning Model: SHAP + LIME
Unified Approach to Interpret Machine Learning Model: SHAP + LIMEUnified Approach to Interpret Machine Learning Model: SHAP + LIME
Unified Approach to Interpret Machine Learning Model: SHAP + LIME
Databricks
 
Machine learning module 2
Machine learning module 2Machine learning module 2
Machine learning module 2
Gokulks007
 
Data! Data! Data! I Can't Make Bricks Without Clay!
Data! Data! Data! I Can't Make Bricks Without Clay!Data! Data! Data! I Can't Make Bricks Without Clay!
Data! Data! Data! I Can't Make Bricks Without Clay!
Turi, Inc.
 
Introduction to machine learning
Introduction to machine learningIntroduction to machine learning
Introduction to machine learning
Ganesh Satpute
 
Deep Recommender Systems - PAPIs.io LATAM 2018
Deep Recommender Systems - PAPIs.io LATAM 2018Deep Recommender Systems - PAPIs.io LATAM 2018
Deep Recommender Systems - PAPIs.io LATAM 2018
Gabriel Moreira
 
Automatic machine learning (AutoML) 101
Automatic machine learning (AutoML) 101Automatic machine learning (AutoML) 101
Automatic machine learning (AutoML) 101
QuantUniversity
 
Interpretable machine learning
Interpretable machine learningInterpretable machine learning
Interpretable machine learning
Sri Ambati
 
Brief introduction to Machine Learning
Brief introduction to Machine LearningBrief introduction to Machine Learning
Brief introduction to Machine Learning
CodeForFrankfurt
 
Search Accuracy Metrics and Predictive Analytics - A Big Data Use Case: Prese...
Search Accuracy Metrics and Predictive Analytics - A Big Data Use Case: Prese...Search Accuracy Metrics and Predictive Analytics - A Big Data Use Case: Prese...
Search Accuracy Metrics and Predictive Analytics - A Big Data Use Case: Prese...
Lucidworks
 
Introduction to Machine Learning
Introduction to Machine LearningIntroduction to Machine Learning
Introduction to Machine Learning
James Ward
 
Simple overview of machine learning
Simple overview of machine learningSimple overview of machine learning
Simple overview of machine learning
priyadharshini R
 
Ferruzza g automl deck
Ferruzza g   automl deckFerruzza g   automl deck
Ferruzza g automl deck
Eric Dill
 
Artificial Intelligence at LinkedIn
Artificial Intelligence at LinkedInArtificial Intelligence at LinkedIn
Artificial Intelligence at LinkedIn
Bill Liu
 

Viewers also liked (20)

Graph Based Clustering
Graph Based ClusteringGraph Based Clustering
Graph Based Clustering
SSA KPI
 
Capturing the Mirage: Machine Learning in Media and Entertainment Industries
Capturing the Mirage: Machine Learning in Media and Entertainment IndustriesCapturing the Mirage: Machine Learning in Media and Entertainment Industries
Capturing the Mirage: Machine Learning in Media and Entertainment Industries
Domino Data Lab
 
Predictive Analytics - An Overview
Predictive Analytics - An OverviewPredictive Analytics - An Overview
Predictive Analytics - An Overview
MachinePulse
 
Bootstrapping Recommendations with Neo4j
Bootstrapping Recommendations with Neo4jBootstrapping Recommendations with Neo4j
Bootstrapping Recommendations with Neo4j
Max De Marzi
 
Neo4j - graph database for recommendations
Neo4j - graph database for recommendationsNeo4j - graph database for recommendations
Neo4j - graph database for recommendations
proksik
 
Exponential Organizations - Why new organizations are 10x better, faster and ...
Exponential Organizations - Why new organizations are 10x better, faster and ...Exponential Organizations - Why new organizations are 10x better, faster and ...
Exponential Organizations - Why new organizations are 10x better, faster and ...
Yuri van Geest
 
An Application of Video Segmentation Using Optical Flows
An Application of Video Segmentation Using Optical FlowsAn Application of Video Segmentation Using Optical Flows
An Application of Video Segmentation Using Optical Flows
Yusuf Uzun
 
Reporting
ReportingReporting
Reporting
ModakAnalytics
 
A la croisée des Graphes
A la croisée des GraphesA la croisée des Graphes
A la croisée des Graphes
Cyril HIJAR
 
Facebook Conférence "Ne vous limitez pas à la Fan page et aux Like"
Facebook Conférence "Ne vous limitez pas à la Fan page et aux Like"Facebook Conférence "Ne vous limitez pas à la Fan page et aux Like"
Facebook Conférence "Ne vous limitez pas à la Fan page et aux Like"
Arnaud ROFIDAL
 
Graph Clustering and cluster
Graph Clustering and clusterGraph Clustering and cluster
Graph Clustering and cluster
Adil Mehmoood
 
LOD2 Webinar Series: DBpedia Spotlight
LOD2 Webinar Series: DBpedia SpotlightLOD2 Webinar Series: DBpedia Spotlight
LOD2 Webinar Series: DBpedia Spotlight
LOD2 Creating Knowledge out of Interlinked Data
 
A Virtuous Cycle of Semantic Enhancement with DBpedia Spotlight - SemTech Ber...
A Virtuous Cycle of Semantic Enhancement with DBpedia Spotlight - SemTech Ber...A Virtuous Cycle of Semantic Enhancement with DBpedia Spotlight - SemTech Ber...
A Virtuous Cycle of Semantic Enhancement with DBpedia Spotlight - SemTech Ber...
Pablo Mendes
 
DBpedia Spotlight at I-SEMANTICS 2011
DBpedia Spotlight at I-SEMANTICS 2011DBpedia Spotlight at I-SEMANTICS 2011
DBpedia Spotlight at I-SEMANTICS 2011
Pablo Mendes
 
Graph based Semi Supervised Learning V1
Graph based Semi Supervised Learning V1Graph based Semi Supervised Learning V1
Graph based Semi Supervised Learning V1
Neeta Pande
 
Recommendations with Neo4j (FOSDEM 2015)
Recommendations with Neo4j (FOSDEM 2015)Recommendations with Neo4j (FOSDEM 2015)
Recommendations with Neo4j (FOSDEM 2015)
Michal Bachman
 
Finding Insights In Connected Data: Using Graph Databases In Journalism
Finding Insights In Connected Data: Using Graph Databases In JournalismFinding Insights In Connected Data: Using Graph Databases In Journalism
Finding Insights In Connected Data: Using Graph Databases In Journalism
William Lyon
 
GoogLeNet Insights
GoogLeNet InsightsGoogLeNet Insights
GoogLeNet Insights
Auro Tripathy
 
Introduction à l'analyse de réseaux avec R
Introduction à l'analyse de réseaux avec RIntroduction à l'analyse de réseaux avec R
Introduction à l'analyse de réseaux avec R
Laurent Beauguitte
 
Dbta Webinar Realize Value of Big Data with graph 011713
Dbta Webinar Realize Value of Big Data with graph  011713Dbta Webinar Realize Value of Big Data with graph  011713
Dbta Webinar Realize Value of Big Data with graph 011713
InfiniteGraph
 
Graph Based Clustering
Graph Based ClusteringGraph Based Clustering
Graph Based Clustering
SSA KPI
 
Capturing the Mirage: Machine Learning in Media and Entertainment Industries
Capturing the Mirage: Machine Learning in Media and Entertainment IndustriesCapturing the Mirage: Machine Learning in Media and Entertainment Industries
Capturing the Mirage: Machine Learning in Media and Entertainment Industries
Domino Data Lab
 
Predictive Analytics - An Overview
Predictive Analytics - An OverviewPredictive Analytics - An Overview
Predictive Analytics - An Overview
MachinePulse
 
Bootstrapping Recommendations with Neo4j
Bootstrapping Recommendations with Neo4jBootstrapping Recommendations with Neo4j
Bootstrapping Recommendations with Neo4j
Max De Marzi
 
Neo4j - graph database for recommendations
Neo4j - graph database for recommendationsNeo4j - graph database for recommendations
Neo4j - graph database for recommendations
proksik
 
Exponential Organizations - Why new organizations are 10x better, faster and ...
Exponential Organizations - Why new organizations are 10x better, faster and ...Exponential Organizations - Why new organizations are 10x better, faster and ...
Exponential Organizations - Why new organizations are 10x better, faster and ...
Yuri van Geest
 
An Application of Video Segmentation Using Optical Flows
An Application of Video Segmentation Using Optical FlowsAn Application of Video Segmentation Using Optical Flows
An Application of Video Segmentation Using Optical Flows
Yusuf Uzun
 
A la croisée des Graphes
A la croisée des GraphesA la croisée des Graphes
A la croisée des Graphes
Cyril HIJAR
 
Facebook Conférence "Ne vous limitez pas à la Fan page et aux Like"
Facebook Conférence "Ne vous limitez pas à la Fan page et aux Like"Facebook Conférence "Ne vous limitez pas à la Fan page et aux Like"
Facebook Conférence "Ne vous limitez pas à la Fan page et aux Like"
Arnaud ROFIDAL
 
Graph Clustering and cluster
Graph Clustering and clusterGraph Clustering and cluster
Graph Clustering and cluster
Adil Mehmoood
 
A Virtuous Cycle of Semantic Enhancement with DBpedia Spotlight - SemTech Ber...
A Virtuous Cycle of Semantic Enhancement with DBpedia Spotlight - SemTech Ber...A Virtuous Cycle of Semantic Enhancement with DBpedia Spotlight - SemTech Ber...
A Virtuous Cycle of Semantic Enhancement with DBpedia Spotlight - SemTech Ber...
Pablo Mendes
 
DBpedia Spotlight at I-SEMANTICS 2011
DBpedia Spotlight at I-SEMANTICS 2011DBpedia Spotlight at I-SEMANTICS 2011
DBpedia Spotlight at I-SEMANTICS 2011
Pablo Mendes
 
Graph based Semi Supervised Learning V1
Graph based Semi Supervised Learning V1Graph based Semi Supervised Learning V1
Graph based Semi Supervised Learning V1
Neeta Pande
 
Recommendations with Neo4j (FOSDEM 2015)
Recommendations with Neo4j (FOSDEM 2015)Recommendations with Neo4j (FOSDEM 2015)
Recommendations with Neo4j (FOSDEM 2015)
Michal Bachman
 
Finding Insights In Connected Data: Using Graph Databases In Journalism
Finding Insights In Connected Data: Using Graph Databases In JournalismFinding Insights In Connected Data: Using Graph Databases In Journalism
Finding Insights In Connected Data: Using Graph Databases In Journalism
William Lyon
 
Introduction à l'analyse de réseaux avec R
Introduction à l'analyse de réseaux avec RIntroduction à l'analyse de réseaux avec R
Introduction à l'analyse de réseaux avec R
Laurent Beauguitte
 
Dbta Webinar Realize Value of Big Data with graph 011713
Dbta Webinar Realize Value of Big Data with graph  011713Dbta Webinar Realize Value of Big Data with graph  011713
Dbta Webinar Realize Value of Big Data with graph 011713
InfiniteGraph
 
Ad

Similar to Graph Based Machine Learning with Applications to Media Analytics (20)

Marvin_Capstone
Marvin_CapstoneMarvin_Capstone
Marvin_Capstone
Marvin Bertin
 
Chapter10.pptx
Chapter10.pptxChapter10.pptx
Chapter10.pptx
adnansbp
 
Graph Models for Deep Learning
Graph Models for Deep LearningGraph Models for Deep Learning
Graph Models for Deep Learning
Experfy
 
Integrated Hidden Markov Model and Kalman Filter for Online Object Tracking
Integrated Hidden Markov Model and Kalman Filter for Online Object TrackingIntegrated Hidden Markov Model and Kalman Filter for Online Object Tracking
Integrated Hidden Markov Model and Kalman Filter for Online Object Tracking
ijsrd.com
 
acmsigtalkshare-121023190142-phpapp01.pptx
acmsigtalkshare-121023190142-phpapp01.pptxacmsigtalkshare-121023190142-phpapp01.pptx
acmsigtalkshare-121023190142-phpapp01.pptx
dongchangim30
 
Chapter 3.pptx
Chapter 3.pptxChapter 3.pptx
Chapter 3.pptx
AbanobZakaria1
 
Show observe and tell giang nguyen
Show observe and tell   giang nguyenShow observe and tell   giang nguyen
Show observe and tell giang nguyen
Nguyen Giang
 
Data visualization
Data visualizationData visualization
Data visualization
Moushmi Dasgupta
 
Graph Signal Processing for Machine Learning A Review and New Perspectives - ...
Graph Signal Processing for Machine Learning A Review and New Perspectives - ...Graph Signal Processing for Machine Learning A Review and New Perspectives - ...
Graph Signal Processing for Machine Learning A Review and New Perspectives - ...
lauratoni4
 
AI In Actuarial Science
AI In Actuarial ScienceAI In Actuarial Science
AI In Actuarial Science
Audrey Britton
 
Responsible AI in Industry: Practical Challenges and Lessons Learned
Responsible AI in Industry: Practical Challenges and Lessons LearnedResponsible AI in Industry: Practical Challenges and Lessons Learned
Responsible AI in Industry: Practical Challenges and Lessons Learned
Krishnaram Kenthapadi
 
Generational Adversarial Neural Networks - Essential Reference
Generational Adversarial Neural Networks - Essential ReferenceGenerational Adversarial Neural Networks - Essential Reference
Generational Adversarial Neural Networks - Essential Reference
Gokul Alex
 
Introduction to Machine Learning with SciKit-Learn
Introduction to Machine Learning with SciKit-LearnIntroduction to Machine Learning with SciKit-Learn
Introduction to Machine Learning with SciKit-Learn
Benjamin Bengfort
 
Scene Description From Images To Sentences
Scene Description From Images To SentencesScene Description From Images To Sentences
Scene Description From Images To Sentences
IRJET Journal
 
Big learning 1.2
Big learning   1.2Big learning   1.2
Big learning 1.2
Mohit Garg
 
TechnicalBackgroundOverview
TechnicalBackgroundOverviewTechnicalBackgroundOverview
TechnicalBackgroundOverview
Motaz El-Saban
 
CH 4_TYBSC(CS)_Data Science_Visualisation
CH 4_TYBSC(CS)_Data Science_VisualisationCH 4_TYBSC(CS)_Data Science_Visualisation
CH 4_TYBSC(CS)_Data Science_Visualisation
sangeeta borde
 
Goal Decomposition and Abductive Reasoning for Policy Analysis and Refinement
Goal Decomposition and Abductive Reasoning for Policy Analysis and RefinementGoal Decomposition and Abductive Reasoning for Policy Analysis and Refinement
Goal Decomposition and Abductive Reasoning for Policy Analysis and Refinement
Emil Lupu
 
OBJECTRECOGNITION1.pptxjjjkkkkjjjjkkkkkkk
OBJECTRECOGNITION1.pptxjjjkkkkjjjjkkkkkkkOBJECTRECOGNITION1.pptxjjjkkkkjjjjkkkkkkk
OBJECTRECOGNITION1.pptxjjjkkkkjjjjkkkkkkk
shesnasuneer
 
OBJECTRECOGNITION1.pptxjjjkkkkjjjjkkkkkkk
OBJECTRECOGNITION1.pptxjjjkkkkjjjjkkkkkkkOBJECTRECOGNITION1.pptxjjjkkkkjjjjkkkkkkk
OBJECTRECOGNITION1.pptxjjjkkkkjjjjkkkkkkk
shesnasuneer
 
Chapter10.pptx
Chapter10.pptxChapter10.pptx
Chapter10.pptx
adnansbp
 
Graph Models for Deep Learning
Graph Models for Deep LearningGraph Models for Deep Learning
Graph Models for Deep Learning
Experfy
 
Integrated Hidden Markov Model and Kalman Filter for Online Object Tracking
Integrated Hidden Markov Model and Kalman Filter for Online Object TrackingIntegrated Hidden Markov Model and Kalman Filter for Online Object Tracking
Integrated Hidden Markov Model and Kalman Filter for Online Object Tracking
ijsrd.com
 
acmsigtalkshare-121023190142-phpapp01.pptx
acmsigtalkshare-121023190142-phpapp01.pptxacmsigtalkshare-121023190142-phpapp01.pptx
acmsigtalkshare-121023190142-phpapp01.pptx
dongchangim30
 
Show observe and tell giang nguyen
Show observe and tell   giang nguyenShow observe and tell   giang nguyen
Show observe and tell giang nguyen
Nguyen Giang
 
Graph Signal Processing for Machine Learning A Review and New Perspectives - ...
Graph Signal Processing for Machine Learning A Review and New Perspectives - ...Graph Signal Processing for Machine Learning A Review and New Perspectives - ...
Graph Signal Processing for Machine Learning A Review and New Perspectives - ...
lauratoni4
 
AI In Actuarial Science
AI In Actuarial ScienceAI In Actuarial Science
AI In Actuarial Science
Audrey Britton
 
Responsible AI in Industry: Practical Challenges and Lessons Learned
Responsible AI in Industry: Practical Challenges and Lessons LearnedResponsible AI in Industry: Practical Challenges and Lessons Learned
Responsible AI in Industry: Practical Challenges and Lessons Learned
Krishnaram Kenthapadi
 
Generational Adversarial Neural Networks - Essential Reference
Generational Adversarial Neural Networks - Essential ReferenceGenerational Adversarial Neural Networks - Essential Reference
Generational Adversarial Neural Networks - Essential Reference
Gokul Alex
 
Introduction to Machine Learning with SciKit-Learn
Introduction to Machine Learning with SciKit-LearnIntroduction to Machine Learning with SciKit-Learn
Introduction to Machine Learning with SciKit-Learn
Benjamin Bengfort
 
Scene Description From Images To Sentences
Scene Description From Images To SentencesScene Description From Images To Sentences
Scene Description From Images To Sentences
IRJET Journal
 
Big learning 1.2
Big learning   1.2Big learning   1.2
Big learning 1.2
Mohit Garg
 
TechnicalBackgroundOverview
TechnicalBackgroundOverviewTechnicalBackgroundOverview
TechnicalBackgroundOverview
Motaz El-Saban
 
CH 4_TYBSC(CS)_Data Science_Visualisation
CH 4_TYBSC(CS)_Data Science_VisualisationCH 4_TYBSC(CS)_Data Science_Visualisation
CH 4_TYBSC(CS)_Data Science_Visualisation
sangeeta borde
 
Goal Decomposition and Abductive Reasoning for Policy Analysis and Refinement
Goal Decomposition and Abductive Reasoning for Policy Analysis and RefinementGoal Decomposition and Abductive Reasoning for Policy Analysis and Refinement
Goal Decomposition and Abductive Reasoning for Policy Analysis and Refinement
Emil Lupu
 
OBJECTRECOGNITION1.pptxjjjkkkkjjjjkkkkkkk
OBJECTRECOGNITION1.pptxjjjkkkkjjjjkkkkkkkOBJECTRECOGNITION1.pptxjjjkkkkjjjjkkkkkkk
OBJECTRECOGNITION1.pptxjjjkkkkjjjjkkkkkkk
shesnasuneer
 
OBJECTRECOGNITION1.pptxjjjkkkkjjjjkkkkkkk
OBJECTRECOGNITION1.pptxjjjkkkkjjjjkkkkkkkOBJECTRECOGNITION1.pptxjjjkkkkjjjjkkkkkkk
OBJECTRECOGNITION1.pptxjjjkkkkjjjjkkkkkkk
shesnasuneer
 
Ad

More from NYC Predictive Analytics (10)

The caret Package: A Unified Interface for Predictive Models
The caret Package: A Unified Interface for Predictive ModelsThe caret Package: A Unified Interface for Predictive Models
The caret Package: A Unified Interface for Predictive Models
NYC Predictive Analytics
 
Intro to Classification: Logistic Regression & SVM
Intro to Classification: Logistic Regression & SVMIntro to Classification: Logistic Regression & SVM
Intro to Classification: Logistic Regression & SVM
NYC Predictive Analytics
 
Introduction to R Package Recommendation System Competition
Introduction to R Package Recommendation System CompetitionIntroduction to R Package Recommendation System Competition
Introduction to R Package Recommendation System Competition
NYC Predictive Analytics
 
R package Recommendation Engine
R package Recommendation EngineR package Recommendation Engine
R package Recommendation Engine
NYC Predictive Analytics
 
Optimization: A Framework for Predictive Analytics
Optimization: A Framework for Predictive AnalyticsOptimization: A Framework for Predictive Analytics
Optimization: A Framework for Predictive Analytics
NYC Predictive Analytics
 
An Introduction to Multilevel Regression Modeling for Prediction
An Introduction to Multilevel Regression Modeling for PredictionAn Introduction to Multilevel Regression Modeling for Prediction
An Introduction to Multilevel Regression Modeling for Prediction
NYC Predictive Analytics
 
How OMGPOP Uses Predictive Analytics to Drive Change
How OMGPOP Uses Predictive Analytics to Drive ChangeHow OMGPOP Uses Predictive Analytics to Drive Change
How OMGPOP Uses Predictive Analytics to Drive Change
NYC Predictive Analytics
 
Introduction to Probabilistic Latent Semantic Analysis
Introduction to Probabilistic Latent Semantic AnalysisIntroduction to Probabilistic Latent Semantic Analysis
Introduction to Probabilistic Latent Semantic Analysis
NYC Predictive Analytics
 
Recommendation Engine Demystified
Recommendation Engine DemystifiedRecommendation Engine Demystified
Recommendation Engine Demystified
NYC Predictive Analytics
 
Building a Recommendation Engine - An example of a product recommendation engine
Building a Recommendation Engine - An example of a product recommendation engineBuilding a Recommendation Engine - An example of a product recommendation engine
Building a Recommendation Engine - An example of a product recommendation engine
NYC Predictive Analytics
 
The caret Package: A Unified Interface for Predictive Models
The caret Package: A Unified Interface for Predictive ModelsThe caret Package: A Unified Interface for Predictive Models
The caret Package: A Unified Interface for Predictive Models
NYC Predictive Analytics
 
Intro to Classification: Logistic Regression & SVM
Intro to Classification: Logistic Regression & SVMIntro to Classification: Logistic Regression & SVM
Intro to Classification: Logistic Regression & SVM
NYC Predictive Analytics
 
Introduction to R Package Recommendation System Competition
Introduction to R Package Recommendation System CompetitionIntroduction to R Package Recommendation System Competition
Introduction to R Package Recommendation System Competition
NYC Predictive Analytics
 
Optimization: A Framework for Predictive Analytics
Optimization: A Framework for Predictive AnalyticsOptimization: A Framework for Predictive Analytics
Optimization: A Framework for Predictive Analytics
NYC Predictive Analytics
 
An Introduction to Multilevel Regression Modeling for Prediction
An Introduction to Multilevel Regression Modeling for PredictionAn Introduction to Multilevel Regression Modeling for Prediction
An Introduction to Multilevel Regression Modeling for Prediction
NYC Predictive Analytics
 
How OMGPOP Uses Predictive Analytics to Drive Change
How OMGPOP Uses Predictive Analytics to Drive ChangeHow OMGPOP Uses Predictive Analytics to Drive Change
How OMGPOP Uses Predictive Analytics to Drive Change
NYC Predictive Analytics
 
Introduction to Probabilistic Latent Semantic Analysis
Introduction to Probabilistic Latent Semantic AnalysisIntroduction to Probabilistic Latent Semantic Analysis
Introduction to Probabilistic Latent Semantic Analysis
NYC Predictive Analytics
 
Building a Recommendation Engine - An example of a product recommendation engine
Building a Recommendation Engine - An example of a product recommendation engineBuilding a Recommendation Engine - An example of a product recommendation engine
Building a Recommendation Engine - An example of a product recommendation engine
NYC Predictive Analytics
 

Recently uploaded (20)

GDGLSPGCOER - Git and GitHub Workshop.pptx
GDGLSPGCOER - Git and GitHub Workshop.pptxGDGLSPGCOER - Git and GitHub Workshop.pptx
GDGLSPGCOER - Git and GitHub Workshop.pptx
azeenhodekar
 
pulse ppt.pptx Types of pulse , characteristics of pulse , Alteration of pulse
pulse  ppt.pptx Types of pulse , characteristics of pulse , Alteration of pulsepulse  ppt.pptx Types of pulse , characteristics of pulse , Alteration of pulse
pulse ppt.pptx Types of pulse , characteristics of pulse , Alteration of pulse
sushreesangita003
 
dynastic art of the Pallava dynasty south India
dynastic art of the Pallava dynasty south Indiadynastic art of the Pallava dynasty south India
dynastic art of the Pallava dynasty south India
PrachiSontakke5
 
Kenan Fellows Participants, Projects 2025-26 Cohort
Kenan Fellows Participants, Projects 2025-26 CohortKenan Fellows Participants, Projects 2025-26 Cohort
Kenan Fellows Participants, Projects 2025-26 Cohort
EducationNC
 
YSPH VMOC Special Report - Measles Outbreak Southwest US 5-3-2025.pptx
YSPH VMOC Special Report - Measles Outbreak  Southwest US 5-3-2025.pptxYSPH VMOC Special Report - Measles Outbreak  Southwest US 5-3-2025.pptx
YSPH VMOC Special Report - Measles Outbreak Southwest US 5-3-2025.pptx
Yale School of Public Health - The Virtual Medical Operations Center (VMOC)
 
Geography Sem II Unit 1C Correlation of Geography with other school subjects
Geography Sem II Unit 1C Correlation of Geography with other school subjectsGeography Sem II Unit 1C Correlation of Geography with other school subjects
Geography Sem II Unit 1C Correlation of Geography with other school subjects
ProfDrShaikhImran
 
How to manage Multiple Warehouses for multiple floors in odoo point of sale
How to manage Multiple Warehouses for multiple floors in odoo point of saleHow to manage Multiple Warehouses for multiple floors in odoo point of sale
How to manage Multiple Warehouses for multiple floors in odoo point of sale
Celine George
 
How to Manage Purchase Alternatives in Odoo 18
How to Manage Purchase Alternatives in Odoo 18How to Manage Purchase Alternatives in Odoo 18
How to Manage Purchase Alternatives in Odoo 18
Celine George
 
Sinhala_Male_Names.pdf Sinhala_Male_Name
Sinhala_Male_Names.pdf Sinhala_Male_NameSinhala_Male_Names.pdf Sinhala_Male_Name
Sinhala_Male_Names.pdf Sinhala_Male_Name
keshanf79
 
How to Set warnings for invoicing specific customers in odoo
How to Set warnings for invoicing specific customers in odooHow to Set warnings for invoicing specific customers in odoo
How to Set warnings for invoicing specific customers in odoo
Celine George
 
Engage Donors Through Powerful Storytelling.pdf
Engage Donors Through Powerful Storytelling.pdfEngage Donors Through Powerful Storytelling.pdf
Engage Donors Through Powerful Storytelling.pdf
TechSoup
 
Stein, Hunt, Green letter to Congress April 2025
Stein, Hunt, Green letter to Congress April 2025Stein, Hunt, Green letter to Congress April 2025
Stein, Hunt, Green letter to Congress April 2025
Mebane Rash
 
apa-style-referencing-visual-guide-2025.pdf
apa-style-referencing-visual-guide-2025.pdfapa-style-referencing-visual-guide-2025.pdf
apa-style-referencing-visual-guide-2025.pdf
Ishika Ghosh
 
Kasdorf "Accessibility Essentials: A 2025 NISO Training Series, Session 5, Ac...
Kasdorf "Accessibility Essentials: A 2025 NISO Training Series, Session 5, Ac...Kasdorf "Accessibility Essentials: A 2025 NISO Training Series, Session 5, Ac...
Kasdorf "Accessibility Essentials: A 2025 NISO Training Series, Session 5, Ac...
National Information Standards Organization (NISO)
 
Presentation of the MIPLM subject matter expert Erdem Kaya
Presentation of the MIPLM subject matter expert Erdem KayaPresentation of the MIPLM subject matter expert Erdem Kaya
Presentation of the MIPLM subject matter expert Erdem Kaya
MIPLM
 
03#UNTAGGED. Generosity in architecture.
03#UNTAGGED. Generosity in architecture.03#UNTAGGED. Generosity in architecture.
03#UNTAGGED. Generosity in architecture.
MCH
 
One Hot encoding a revolution in Machine learning
One Hot encoding a revolution in Machine learningOne Hot encoding a revolution in Machine learning
One Hot encoding a revolution in Machine learning
momer9505
 
Sugar-Sensing Mechanism in plants....pptx
Sugar-Sensing Mechanism in plants....pptxSugar-Sensing Mechanism in plants....pptx
Sugar-Sensing Mechanism in plants....pptx
Dr. Renu Jangid
 
Herbs Used in Cosmetic Formulations .pptx
Herbs Used in Cosmetic Formulations .pptxHerbs Used in Cosmetic Formulations .pptx
Herbs Used in Cosmetic Formulations .pptx
RAJU THENGE
 
Operations Management (Dr. Abdulfatah Salem).pdf
Operations Management (Dr. Abdulfatah Salem).pdfOperations Management (Dr. Abdulfatah Salem).pdf
Operations Management (Dr. Abdulfatah Salem).pdf
Arab Academy for Science, Technology and Maritime Transport
 
GDGLSPGCOER - Git and GitHub Workshop.pptx
GDGLSPGCOER - Git and GitHub Workshop.pptxGDGLSPGCOER - Git and GitHub Workshop.pptx
GDGLSPGCOER - Git and GitHub Workshop.pptx
azeenhodekar
 
pulse ppt.pptx Types of pulse , characteristics of pulse , Alteration of pulse
pulse  ppt.pptx Types of pulse , characteristics of pulse , Alteration of pulsepulse  ppt.pptx Types of pulse , characteristics of pulse , Alteration of pulse
pulse ppt.pptx Types of pulse , characteristics of pulse , Alteration of pulse
sushreesangita003
 
dynastic art of the Pallava dynasty south India
dynastic art of the Pallava dynasty south Indiadynastic art of the Pallava dynasty south India
dynastic art of the Pallava dynasty south India
PrachiSontakke5
 
Kenan Fellows Participants, Projects 2025-26 Cohort
Kenan Fellows Participants, Projects 2025-26 CohortKenan Fellows Participants, Projects 2025-26 Cohort
Kenan Fellows Participants, Projects 2025-26 Cohort
EducationNC
 
Geography Sem II Unit 1C Correlation of Geography with other school subjects
Geography Sem II Unit 1C Correlation of Geography with other school subjectsGeography Sem II Unit 1C Correlation of Geography with other school subjects
Geography Sem II Unit 1C Correlation of Geography with other school subjects
ProfDrShaikhImran
 
How to manage Multiple Warehouses for multiple floors in odoo point of sale
How to manage Multiple Warehouses for multiple floors in odoo point of saleHow to manage Multiple Warehouses for multiple floors in odoo point of sale
How to manage Multiple Warehouses for multiple floors in odoo point of sale
Celine George
 
How to Manage Purchase Alternatives in Odoo 18
How to Manage Purchase Alternatives in Odoo 18How to Manage Purchase Alternatives in Odoo 18
How to Manage Purchase Alternatives in Odoo 18
Celine George
 
Sinhala_Male_Names.pdf Sinhala_Male_Name
Sinhala_Male_Names.pdf Sinhala_Male_NameSinhala_Male_Names.pdf Sinhala_Male_Name
Sinhala_Male_Names.pdf Sinhala_Male_Name
keshanf79
 
How to Set warnings for invoicing specific customers in odoo
How to Set warnings for invoicing specific customers in odooHow to Set warnings for invoicing specific customers in odoo
How to Set warnings for invoicing specific customers in odoo
Celine George
 
Engage Donors Through Powerful Storytelling.pdf
Engage Donors Through Powerful Storytelling.pdfEngage Donors Through Powerful Storytelling.pdf
Engage Donors Through Powerful Storytelling.pdf
TechSoup
 
Stein, Hunt, Green letter to Congress April 2025
Stein, Hunt, Green letter to Congress April 2025Stein, Hunt, Green letter to Congress April 2025
Stein, Hunt, Green letter to Congress April 2025
Mebane Rash
 
apa-style-referencing-visual-guide-2025.pdf
apa-style-referencing-visual-guide-2025.pdfapa-style-referencing-visual-guide-2025.pdf
apa-style-referencing-visual-guide-2025.pdf
Ishika Ghosh
 
Presentation of the MIPLM subject matter expert Erdem Kaya
Presentation of the MIPLM subject matter expert Erdem KayaPresentation of the MIPLM subject matter expert Erdem Kaya
Presentation of the MIPLM subject matter expert Erdem Kaya
MIPLM
 
03#UNTAGGED. Generosity in architecture.
03#UNTAGGED. Generosity in architecture.03#UNTAGGED. Generosity in architecture.
03#UNTAGGED. Generosity in architecture.
MCH
 
One Hot encoding a revolution in Machine learning
One Hot encoding a revolution in Machine learningOne Hot encoding a revolution in Machine learning
One Hot encoding a revolution in Machine learning
momer9505
 
Sugar-Sensing Mechanism in plants....pptx
Sugar-Sensing Mechanism in plants....pptxSugar-Sensing Mechanism in plants....pptx
Sugar-Sensing Mechanism in plants....pptx
Dr. Renu Jangid
 
Herbs Used in Cosmetic Formulations .pptx
Herbs Used in Cosmetic Formulations .pptxHerbs Used in Cosmetic Formulations .pptx
Herbs Used in Cosmetic Formulations .pptx
RAJU THENGE
 

Graph Based Machine Learning with Applications to Media Analytics

  • 1. Graph based machine learning with applications to media analytics Lei Ding, PhD 9-1-2011 with collaborators at
  • 2. Outline •  Graph based machine learning –  Basic structures –  Algorithms –  Examples •  Applications in media analytics –  Social analysis of videos –  Content analysis of images
  • 3. Outline •  Graph based machine learning –  Basic structures –  Algorithms –  Examples •  Applications in media analytics –  Social analysis of videos –  Content analysis of images
  • 4. What is a graph Not the graph we are going to talk about
  • 5. What is a graph •  A graph is composed of –  Vertices (nodes): pixels, actors in videos, genes, ads, etc. –  Edges: their relations –  In machine learning, we are interested in predicting some quantity (a class label, or a continuous value) at each unlabeled vertex
  • 6. What is a graph •  A graph is composed of –  Vertices (nodes): pixels, actors in videos, genes, ads, etc. –  Edges: their relations –  In machine learning, we are interested in predicting some quantity (a class label, or a continuous value) at each unlabeled vertex •  Broadly speaking, there are two kinds of graphs undirected directed
  • 7. Graph based machine learning for media analytics •  Oftentimes, media content can be represented using graphs •  Therefore, challenging inference problems with media content can be answered by learning on graphs
  • 8. Social content model Content network encodes content similarity (videos, audios, etc.) Content generation process Social network encodes peoples’ social connections Can be used for media genre classification, media recommendation, etc.
  • 9. Graph based machine learning •  On undirected graphs –  Optimization based approaches (e.g. energy minimization) –  Probabilistic models (e.g. random fields) •  On directed graphs –  Optimization based approaches (e.g. directed energy minimization) –  Probabilistic models (e.g. latent Dirichlet allocation, Bayesian networks)
  • 10. Relations •  How are they related to traditional stats learning (e.g. logistic regression) (Sutton McCallum, 2007)
  • 11. Graph based machine learning •  On undirected graphs –  Optimization based approaches (e.g. energy minimization) –  Probabilistic models (e.g. random fields) •  On directed graphs –  Optimization based approaches (e.g. directed energy minimization) –  Probabilistic models (e.g. latent Dirichlet allocation, Bayesian networks)
  • 12. Learning on undirected graphs •  Classification methods –  We have some labeled data, and want to predict labels for others –  e.g. manifold regularization •  Clustering methods –  We would like to partition data into clusters –  e.g. spectral clustering
  • 13. Constructing data graphs •  How to transform a dataset ({xi}, i=1..m) into a graph
  • 14. Affinity matrix •  A graph is usually represented using an affinity matrix W, where the corresponding entry is 1 if two vertices are connected, and 0 otherwise
  • 15. Graph Laplacians •  L=D-W, where W is an affinity matrix, D is a diagonal matrix of row sums •  Discretization of Laplace-Beltrami operator on manifolds, which is the sum of second order derivatives on tangent space (more details later)
  • 16. Function on graph •  A vector can be used to represent a function over the graph –  We can encode what we already know or what we want to predict in a label function –  For example in this graph, a vertex can represent a person, and the function can represent if he is a likely customer 0 1 1 1 0 0 f = [ 1, 1, 0, 0, 1, 0 ] T
  • 18. Properties of graph Laplacians •  Symmetric and positive semi-definite •  Graph Laplacian induces a smoothness term –  Transposed label function f * Laplacian matrix L * label function f (always non-negative) –  Smoothness term (fTLf) measures how much the function f varies with respect to the underlying graph –  We have labels on some vertices, and want to predict labels on other vertices. A smooth function (small fTLf) typically predicts well •  Laplacian eigenvectors with small eigenvalues can be used for data clustering / classification, data set parametrization, image segmentation, etc.
  • 19. Properties of graph Laplacians •  Symmetric and positive semi-definite •  Graph Laplacian induces a smoothness term –  Transposed label function f * Laplacian matrix L * label function f (always non-negative) –  Smoothness term (fTLf) measures how much the function f varies with respect to the underlying graph –  We have labels on some vertices, and want to predict labels on other vertices. A smooth function (small fTLf) typically predicts well •  Laplacian eigenvectors with small eigenvalues can be used for data clustering / classification, data set parametrization, image segmentation, etc. Now we are ready to see the algorithms, but let’s take a little break to understand things even further
  • 21. Manifold perspective of data modeling
  • 22. Why graphs encode underlying data geometry If we consider data as samples from an underlying manifold (which is a fairly weak assumption), and construct the corresponding adjacency graph, then eigenvectors of graph Laplacian approximate eigenfunctions of the Laplace-Beltrami operator of the underlying data manifold (Belkin Niyogi, 2008)
  • 24. Spectral clustering More information in von Luxburg (2007)
  • 25. Spectral clustering explained •  Why the eigenvectors of L with small eigenvalues are used as the new representation? •  The minimizers fi for the following total smoothness term are eigenvectors of L with the smallest eigenvalues
  • 27. Laplacian eigenmap •  Using Laplacian eigenvectors with the smallest eigenvalues as the new representation •  Can be seen as a non-linear extension of PCA (Belkin Niyogi, 2003)
  • 28. Results on real data •  Transform data using Laplacian eigenmap, and use linear regression on the new representation (Belkin Niyogi, 2004)
  • 29. Manifold regularization •  A comprehensive regularization framework •  Through applying the representer theorem in functional analysis, the optimal solution is as follows (Belkin et al., 2006)
  • 30. Results on real data (Belkin et al., 2006)
  • 31. Summary •  Learning on graphs provides a set of powerful techniques for data analysis and predictive analytics that “understand” the geometry of underlying data •  Spectral clustering – addresses the limitation with traditional K-means •  Laplacian eigenmap manifold regularization – learn a label function respecting underlying data geometry, and hence provide benefits over standard methods like PCA and linear regression •  Lots of other approaches as well – will talk about label propagation based on graphs later in this presentation
  • 32. Outline •  Graph based machine learning –  Basic structures –  Algorithms –  Examples •  Applications in media analytics –  Social analysis of videos –  Content analysis of images
  • 33. Applications in media analytics High-level analysis Social relational inference People to communities Mid-level analysis Event detection Visual features to events Low-level analysis Segmentation Pixels to semantic objects
  • 34. Application 1: social analysis of multimedia data Friends or foes? Acquaintances or strangers? In same or different teams?
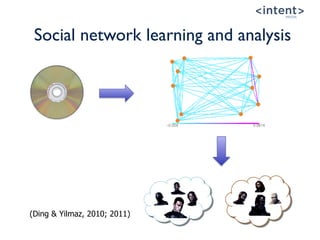
  • 35. Social network learning and analysis
  • 36. Social network learning and analysis
  • 37. Social network learning and analysis (Ding Yilmaz, 2010; 2011)
  • 38. Application areas •  Social content: given the growing popularity of social media, inferring relations among people is becoming important •  Visual recognition: social context is shown to help improve recognition results from images (e.g. Wang et al., ECCV 10) •  Surveillance: social network learning and analysis for surveillance applications (e.g. Yu et al., CVPR 2009) •  Sociology: necessary step in building intelligent systems for aiding sociological discovery
  • 39. Basic video processing •  Videos segmented into semantic segments –  Scenes, or visually coherent sets of shots, for movies and TV shows –  Shot detection and merging based on key-frame similarity (Rasheed Shah, 03) •  Identifying the actors appearing in each segment –  Using scripts and closed captions for movies –  Face detection and recognition for other videos
  • 41. Overall process Social Relations video-level A number [-1,+1] for each scene: positive if actors in a scene are likely in the same Grouping cues community, negative if otherwise scene-level Estimate the likely events in a scene Event estimates Dynamic systems represent scenes Scene models Feature observations frame-level
  • 43. Visual features •  Generic optical flow orientation histogram
  • 45. Using visual concepts •  Visual concept detection provides useful semantic features for inferring social relations •  Using Columbia s 374 SVM concept detectors on color/texture/edge features, a concept score vector is generated for each scene
  • 46. Evidence synthesis by Gaussian processes
  • 47. Learned social affinity —  Learned social network is represented by affinity matrix K
  • 49. RACOM dataset •  Ten example movies: (1) G.I. Joe: The Rise of Cobra (2009); (2) Harry Potter and the Half-Blood Prince (2009); (3) Public Enemies (2009); (4) Troy (2004); (5) Braveheart (1995); (6) Year One (2009); (7) Coraline (2009); (8) True Lies (1994); (9) The Chronicles of Narnia: The Lion, the Witch and the Wardrobe (2005); (10) The Lord of the Rings: The Return of the King (2003) .
  • 50. Analyzing social networks •  We extend the max-min modularity principle such that it works with the learned social networks, in order to detect the two communities for each movie •  We also identify the leaders of each community, which interestingly, correspond to the hero/villain most of the time
  • 55. Youtube dataset •  10 videos for soccer games; 10 videos for demonstration; •  The goal here is to predict a grouping cue for each scene. We evaluate against ground truth labeling
  • 56. Youtube results •  Event categories are considered and labeled in a middle step –  Soccer: (chasing, confronting, hugging, others) –  Demonstration: (marching, confronting, public speaking, others) •  Precision (+) for within-community instances and Precision (-) for across- community instances are reported separately
  • 57. Application 2: image content analysis •  Interactive whole-object segmentation –  Inputs: an image labeled pixels (seeds) for objects/background –  Outputs: labels for all other pixels (Ding Yilmaz, 2010)
  • 58. Overview •  To segment whole objects from images given user-supplied seeds –  Different from unsupervised segmentation from a single image, which typically generates homogeneous regions –  The challenge is to segment objects using a small number of seeds •  In addressing this problem, we have proposed –  Probabilistic hypergraph image model (PHIM) –  Automatic label set augmentation using boundary features –  Multiple view learning synthesizing features
  • 59. Graphs vs. hypergraphs •  Graph based approaches have been popular for interactive segmentation –  Graph cut (Rother et al., 2004) –  Random walk (Grady, 2006) •  Hypergraphs vs. graphs for images –  Higher order relations among pixels that tend to form a segment are encoded as hyperedges, which are collections of vertices –  Model long-range dependencies among the entities (known and unknown labels)
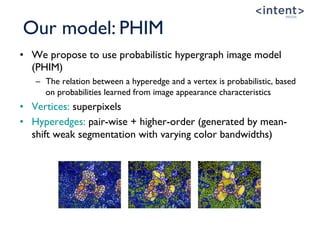
  • 60. Our model: PHIM •  We propose to use probabilistic hypergraph image model (PHIM) –  The relation between a hyperedge and a vertex is probabilistic, based on probabilities learned from image appearance characteristics •  Vertices: superpixels •  Hyperedges: pair-wise + higher-order (generated by mean- shift weak segmentation with varying color bandwidths)
  • 61. Our model: PHIM (cont’d) •  Feature vector Fs of a superpixel s contains average LUV color values •  Incidences: kernel density estimator taking superpixel features as the input •  Hyperedge weights: inhomogeneous hyperedges are down-weighted –  Reduces to standard graph based edge weights when the hyperedge is of size 2
  • 62. Laplacians on PHIM •  Normalized Laplacians on PHIM: induced quadratic form measures the smoothness of a function with respect to the underlying edge system –  We use probabilistic incidences (hv,e) in defining Laplacians on PHIM •  Notations –  f: vector of function values on vertices (+1 for object; -1 for background) –  H: probabilistic incidence matrix; W: hyperedge weight matrix –  De: hyperedge degree matrix; Dv: vertex degree matrix
  • 63. How to do segmentation •  Constrained smoothness minimization –  Essentially an interpolation, as we have confidence in user-supplied segment labels •  This interpolation can also be solved in an iterative manner using the natural random walk
  • 64. Dataset •  GrabCut dataset of 50 images (Rother et al., 2004) •  Seed pixels are provided in the form of trimaps •  Ground-truth segmentations are supplied
  • 65. Results on segmentation •  Error rates averaged over the GrabCut dataset of 50 images –  PHIM performs better than a standard graph –  Our error rate 5.33% is much better than 7.9% achieved in (Blake et al., 2006), and is comparable to state-of-the-art results from pixel-level optimization
  • 67. The end •  Thanks! •  References –  Ulrike von Luxburg, A Tutorial on Spectral Clustering, 2007 –  Charles Sutton and Andrew McCallum, An Introduction to Conditional Random Fields for Relational Learning, 2007 –  Raif Rustamov, Laplace-Beltrami Eigenfunctions for Deformation Invariant Shape Representation, 2007 –  Mikhail Belkin and Partha Niyogi, Laplacian Eigenmaps for Dimensionality Reduction and Data Representation, 2003 –  Mikhail Belkin and Partha Niyogi, Semi-Supervised Learning on Riemannian Manifolds, 2004 –  Mikhail Belkin, Partha Niyogi and Vikas Sindwani, Manifold Regularization: A Geometric Framework for Learning from Labeled and Unlabeled Examples, 2006 –  Mikhail Belkin and Partha Niyogi, Convergence of Laplacian Eigenmaps, 2008 –  Lei Ding and Alper Yilmaz, Learning Relations Among Movie Characters: A Social Network Perspective, 2010 –  Lei Ding and Alper Yilmaz, Interactive Image Segmentation Using Probabilistic Hypergraphs, 2010 –  Lei Ding and Alper Yilmaz, Inferring Social Relations from Visual Concepts, 2011