SlideShare a Scribd company logo
Stata Graphics

Harvard MIT Data Center

The Institute

for Quantitative Social Science
at Harvard University

(Harvard MIT Data Center)

Stata Graphics

1 / 38
Outline

1

Introduction

2

Univariate Graphics

3

Bivariate Graphics

4

More Fun with Twoway Line Graphs

5

Wrap-up

(Harvard MIT Data Center)

Stata Graphics

2 / 38
Introduction

Topic

1

Introduction

2

Univariate Graphics

3

Bivariate Graphics

4

More Fun with Twoway Line Graphs

5

Wrap-up

(Harvard MIT Data Center)

Stata Graphics

3 / 38
Introduction

Documents for today

USERNAME: dataclass PASSWORD: dataclass
Find class materials at: Scratch > StataStatistics
FIRST THING: copy this folder to your desktop!

(Harvard MIT Data Center)

Stata Graphics

4 / 38
Introduction

Organization

Please feel free to ask questions at any point if they are relevant to the
current topic (or if you are lost!)
There will be a Q&A after class for more specific, personalized questions
Collaboration with your neighbors is encouraged
If you are using a laptop, you will need to adjust paths accordingly
Make comments in your Do-file rather than on hand-outs
Save on flash drive or email to yourself

(Harvard MIT Data Center)

Stata Graphics

5 / 38
Introduction

Graphing Strategies
Keep it simple
Labels, labels, labels!!
Avoid cluttered graphs
Every part of the graph should be meaningful
Avoid:
Shading
Distracting colors
Decoration

Always know what you’re working with before you get started
Recognize scale of data
If you’re using multiple variables – how do their scales align?

Before any graphing procedure review variables with codebook, sum,
tab, etc.
HELPFUL STATA HINT: If you want your command to go on multiple
lines use /// at end of each line
(Harvard MIT Data Center)

Stata Graphics

6 / 38
Introduction

Terrible Graph

(Harvard MIT Data Center)

Stata Graphics

7 / 38
Introduction

Much Better Graph

(Harvard MIT Data Center)

Stata Graphics

8 / 38
Univariate Graphics

Topic

1

Introduction

2

Univariate Graphics

3

Bivariate Graphics

4

More Fun with Twoway Line Graphs

5

Wrap-up

(Harvard MIT Data Center)

Stata Graphics

9 / 38
Univariate Graphics

Our First Dataset

Time Magazine Public School Poll
Based on survey of 1,000 adults in U.S.
Conducted in August 2010
Questions regarding feelings about parental involvement, teachers union,
current potential for reform

Open Stata and call up the datafile for today
// Step 1: tell Stata where to find data:
cd /Users/dataclass/Desktop/StataGraphics/dataSets
// Step 2: call up our dataset:
use TimePollPubSchools.dta

(Harvard MIT Data Center)

Stata Graphics

10 / 38
Univariate Graphics

Single Continuous Variables

Example: Histograms
Stata assumes you’re working with continuous data
Very simple syntax:
hist varname

Put a comma after your varname and start adding options
bin(#) : change the number of bars that the graph displays
normal : overlay normal curve
addlabels : add actual values to bars

(Harvard MIT Data Center)

Stata Graphics

11 / 38
Univariate Graphics

Histogram Options

To change the numeric depiction of your data add these options after
the comma
Choose one: density fraction frequency percent

Be sure to properly describe your histogram:
title(insert name of graph)
subtitle(insert subtitle of graph)
note(insert note to appear at bottom of graph)
caption(insert caption to appear below notes)

(Harvard MIT Data Center)

Stata Graphics

12 / 38
Univariate Graphics

Histogram Example
hist F1, bin(10) percent title(TITLE) ///
subtitle(SUBTITLE) caption(CAPTION) note(NOTES)

(Harvard MIT Data Center)

Stata Graphics

13 / 38
Univariate Graphics

Axis Titles and Labels
Example: Histograms
Axis title options (default is variable label):
xtitle(insert x axis name)
ytitle(insert y axis name)

Don’t want axis titles?
xtitle("")
ytitle("")

Add labels to X or Y axis:
xlabel(insert x axis label)
ylabel(insert y axis label)

Tell Stata how to scale each axis
xlabel(start#(increment)end#)
xlabel(0(5)100)

This would label x-axis from 0-100 in increments of 5

(Harvard MIT Data Center)

Stata Graphics

14 / 38
Univariate Graphics

Axis Labels Example
hist F1, bin(10) percent title(TITLE) subtitle(SUBTITLE) ///
caption(CAPTION) note(NOTES) ///
xtitle(Here ’ s your x-axis title) ///
ytitle(here ’ s your y-axis title)

(Harvard MIT Data Center)

Stata Graphics

15 / 38
Univariate Graphics

Basic Graphing: Single Categorical Variables
We can also use the hist command for bar graphs
Simply specify "discrete" with options

Stata will produce one bar for each level (i.e. category) of variable
Use xlabel command to insert names of individual categories
hist F4, title(Racial breakdown of Time Poll Sample) xtitle(Race) ///
ytitle(Percent) xlabel(1 "White" 2 "Black" 3 "Asian" 4 "Hispanic" ///
5 "Other") discrete percent addlabels

(Harvard MIT Data Center)

Stata Graphics

16 / 38
Univariate Graphics

Exercise 1: Histograms Bar Graphs
1

Open the datafile, NatNeighCrimeStudy.dta.

2

Create a histogram of the tract-level poverty rate (variable name:
T_POVRTY).

3

Insert the normal curve over the histogram

4

Change the numeric representation on the Y-axis to "percent"

5

Add appropriate titles to the overall graph and the x axis and y axis.
Also, add a note that states the source of this data.

6

Open the datafile, TimePollPubSchools.dta

7

Create a histogram of the question, "What grade would you give your
child’s school" (variable name: Q11). Be sure to tell Stata that this is a
categorical variable.

8

Format this graph so that the axes have proper titles and labels. Also,
add an appropriate title to the overall graph that goes onto two lines.
Add a note stating the source of the data.

(Harvard MIT Data Center)

Stata Graphics

17 / 38
Univariate Graphics

Next Dataset:

National Neighborhood Crime Study (NNCS)
N=9,593 census tracts in 2000
Explore sources of variation in crime for communities in the United States
Tract-level data: crime, social disorganization, disadvantage,
socioeconomic inequality
City-level data: labor market, socioeconomic inequality, population
change

(Harvard MIT Data Center)

Stata Graphics

18 / 38
Bivariate Graphics

Topic

1

Introduction

2

Univariate Graphics

3

Bivariate Graphics

4

More Fun with Twoway Line Graphs

5

Wrap-up

(Harvard MIT Data Center)

Stata Graphics

19 / 38
Bivariate Graphics

The Twoway Family

twoway is basic Stata command for all twoway graphs
Use twoway anytime you want to make comparisons among variables
Can be used to combine graphs (i.e., overlay one graph with another
e.g., insert line of best fit over a scatter plot

Some basic examples:
use NatNeighCrimeStudy.dta
tw scatter T_PERCAP T_VIOLNT
tw dropline T_PERCAP T_VIOLNT
tw lfitci T_PERCAP T_VIOLNT

(Harvard MIT Data Center)

Stata Graphics

20 / 38
Bivariate Graphics

Twoway and the "by" Statement
twoway scatter T_PERCAP T_VIOLNT, by(DIVISION)

(Harvard MIT Data Center)

Stata Graphics

21 / 38
Bivariate Graphics

Twoway Title Options

Same title options as with histogram
title(insert name of graph)
subtitle(insert subtitle of graph)
note(insert note to appear at bottom of graph)
caption(insert caption to appear below notes)

(Harvard MIT Data Center)

Stata Graphics

22 / 38
Bivariate Graphics

Twoway Title Options Example

twoway scatter T_PERCAP T_VIOLNT, ///
title(Comparison of Per Capita Income ///
and Violent Crime Rate at Tract level) ///
xtitle(Violent Crime Rate) ytitle(Per Capita Income) ///
note(Source: National Neighborhood Crime Study 2000)

The title is a bit cramped–let’s fix that:
twoway scatter T_PERCAP T_VIOLNT, ///
title("Comparison of Per Capita Income" ///
"and Violent Crime Rate at Tract level") ///
xtitle(Violent Crime Rate) ytitle(Per Capita Income) ///
note(Source: National Neighborhood Crime Study 2000)

(Harvard MIT Data Center)

Stata Graphics

23 / 38
Bivariate Graphics

Twoway Symbol Options
A variety of symbol shapes are available: use palette symbolpalette
to seem them and msymbol() to set them

(Harvard MIT Data Center)

Stata Graphics

24 / 38
Bivariate Graphics

Twoway Symbol Options
twoway scatter T_PERCAP T_VIOLNT, ///
title("Comparison of Per Capita Income" ///
"and Violent Crime Rate at Tract level") ///
xtitle(Violent Crime Rate) ytitle(Per Capita Income) ///
note(Source: National Neighborhood Crime Study 2000) ///
msymbol(Sh) mcolor("red")

(Harvard MIT Data Center)

Stata Graphics

25 / 38
Bivariate Graphics

Overlaying Twoway Graphs

Very simple to combine multiple graphs. . . just put each graph command
in parentheses
twoway (scatter var1 var2) (lfit var1 var2)

Add individual options to each graph within the parentheses
Add overall graph options as usual following the comma
twoway (scatter var1 var2) (lfit var1 var2), options

(Harvard MIT Data Center)

Stata Graphics

26 / 38
Bivariate Graphics

Overlaying Points and Lines

twoway (scatter T_PERCAP T_VIOLNT) ///
(lfit T_PERCAP T_VIOLNT), ///
title("Comparison of Per Capita Income" ///
"and Violent Crime Rate at Tract level") ///
xtitle(Violent Crime Rate) ytitle(Per Capita Income) ///
note(Source: National Neighborhood Crime Study 2000)

(Harvard MIT Data Center)

Stata Graphics

27 / 38
Bivariate Graphics

Overlaying Points and Labels

twoway (scatter T_PERCAP T_VIOLNT if T_VIOLNT==1976, ///
mlabel(CITY)) (scatter T_PERCAP T_VIOLNT), ///
title("Comparison of Per Capita Income" ///
"and Violent Crime Rate at Tract level") ///
xlabel(0(200)2400) note(Source: National Neighborhood ///
Crime Study 2000) legend(off)

(Harvard MIT Data Center)

Stata Graphics

28 / 38
Bivariate Graphics

Exercise 2: The TwoWay Family
Open the datafile, NatNeighCrimeStudy.dta.
1

Create a basic twoway scatterplot that compares the city unemployment
rate (C_UNEMP) to the percent secondary sector low-wage jobs
(C_SSLOW)

2

Generate the same scatterplot, but this time, divide the plot by the
dummy variable indicating whether the city is located in the south or not
(C_SOUTH)

3

Change the color of the symbol that you use in this scatter plot

4

Change the type of symbol you use to a marker of your choice

5

Notice in your scatterplot that is broken down by C_SOUTH that there is
an outlier in the upper right hand corner of the "Not South" graph. Add
the city name label to this marker.

6

Review the options available under "help twowayoptions " and change one
aspect of your graph using an option that we haven’t already reviewed

(Harvard MIT Data Center)

Stata Graphics

29 / 38
More Fun with Twoway Line Graphs

Topic

1

Introduction

2

Univariate Graphics

3

Bivariate Graphics

4

More Fun with Twoway Line Graphs

5

Wrap-up

(Harvard MIT Data Center)

Stata Graphics

30 / 38
More Fun with Twoway Line Graphs

Line Graphs

Line graphs helpful for a variety of data
Especially any type of time series data

We’ll use data on US life expectancy from 1900-1999
webuse uslifeexp, clear

(Harvard MIT Data Center)

Stata Graphics

31 / 38
More Fun with Twoway Line Graphs

Line Graphs
webuse uslifeexp, clear
twoway (line le_wm year, mcolor("red")) ///
(line le_bm year, mcolor("green"))

(Harvard MIT Data Center)

Stata Graphics

32 / 38
More Fun with Twoway Line Graphs

Line Graphs
twoway (line (le_wfemale le_wmale le_bf le_bm) year, ///
lpattern(dot solid dot solid))

(Harvard MIT Data Center)

Stata Graphics

33 / 38
More Fun with Twoway Line Graphs

Stata Graphing Lines
palette linepalette

(Harvard MIT Data Center)

Stata Graphics

34 / 38
More Fun with Twoway Line Graphs

Exporting Graphs

From Stata, right click on image and select "save as" or try syntax:
graph export myfig.esp, replace

In Microsoft Word: insert > picture > from file
Or, right click on graph in Stata and copy and paste into Word

(Harvard MIT Data Center)

Stata Graphics

35 / 38
Wrap-up

Topic

1

Introduction

2

Univariate Graphics

3

Bivariate Graphics

4

More Fun with Twoway Line Graphs

5

Wrap-up

(Harvard MIT Data Center)

Stata Graphics

36 / 38
Wrap-up

Help Us Make This Workshop Better

Please take a moment to fill out a very short feedback form
These workshops exist for you–tell us what you need!
http://tinyurl.com/StataGraphicsFeedback

(Harvard MIT Data Center)

Stata Graphics

37 / 38
Wrap-up

Additional resources

training and consulting
IQSS workshops:
http://projects.iq.harvard.edu/rtc/filter_by/workshops
IQSS statistical consulting: http://rtc.iq.harvard.edu

Stata resources
UCLA website: http://www.ats.ucla.edu/stat/Stata/
Great for self-study
Links to resources

Stata website: http://www.stata.com/help.cgi?contents
Email list: http://www.stata.com/statalist/

(Harvard MIT Data Center)

Stata Graphics

38 / 38
Ad

More Related Content

What's hot (20)

Introduction to STATA - Ali Rashed
Introduction to STATA - Ali RashedIntroduction to STATA - Ali Rashed
Introduction to STATA - Ali Rashed
Economic Research Forum
 
Spss by vijay ambast
Spss by vijay ambastSpss by vijay ambast
Spss by vijay ambast
Vijay Ambast
 
The uses of Tables & graphs
The uses of Tables & graphsThe uses of Tables & graphs
The uses of Tables & graphs
Franco Jesús
 
Multivariate time series
Multivariate time seriesMultivariate time series
Multivariate time series
Luigi Piva CQF
 
Data Analysis and Statistics
Data Analysis and StatisticsData Analysis and Statistics
Data Analysis and Statistics
T.S. Lim
 
"A basic guide to SPSS"
"A basic guide to SPSS""A basic guide to SPSS"
"A basic guide to SPSS"
Bashir7576
 
Spss training notes
Spss training notesSpss training notes
Spss training notes
Mzee Theogene KUBAHONIYESU
 
Introduction to Stata
Introduction to Stata Introduction to Stata
Introduction to Stata
Samaa Hazem Hosny
 
Introduction to Rstudio
Introduction to RstudioIntroduction to Rstudio
Introduction to Rstudio
Olga Scrivner
 
Introduction to STATA(2).pdf
Introduction to STATA(2).pdfIntroduction to STATA(2).pdf
Introduction to STATA(2).pdf
Yomif3
 
Descriptive statistics
Descriptive statisticsDescriptive statistics
Descriptive statistics
Hiba Armouche
 
Construction of life table
Construction of life tableConstruction of life table
Construction of life table
pratapmshinde
 
Spss beginners
Spss beginnersSpss beginners
Spss beginners
Mbabazi Theos
 
INTRODUCTION TO BIO STATISTICS
INTRODUCTION TO BIO STATISTICS INTRODUCTION TO BIO STATISTICS
INTRODUCTION TO BIO STATISTICS
Meklelle university
 
SPSS introduction Presentation
SPSS introduction Presentation SPSS introduction Presentation
SPSS introduction Presentation
befikra
 
Spss
SpssSpss
Spss
salemhusin
 
Theory of estimation
Theory of estimationTheory of estimation
Theory of estimation
Tech_MX
 
Introduction To SPSS
Introduction To SPSSIntroduction To SPSS
Introduction To SPSS
ThankGod Damion Okpe
 
Descriptive statistics
Descriptive statisticsDescriptive statistics
Descriptive statistics
Attaullah Khan
 
Descriptive Statistics - Thiyagu K
Descriptive Statistics - Thiyagu KDescriptive Statistics - Thiyagu K
Descriptive Statistics - Thiyagu K
Thiyagu K
 
Spss by vijay ambast
Spss by vijay ambastSpss by vijay ambast
Spss by vijay ambast
Vijay Ambast
 
The uses of Tables & graphs
The uses of Tables & graphsThe uses of Tables & graphs
The uses of Tables & graphs
Franco Jesús
 
Multivariate time series
Multivariate time seriesMultivariate time series
Multivariate time series
Luigi Piva CQF
 
Data Analysis and Statistics
Data Analysis and StatisticsData Analysis and Statistics
Data Analysis and Statistics
T.S. Lim
 
"A basic guide to SPSS"
"A basic guide to SPSS""A basic guide to SPSS"
"A basic guide to SPSS"
Bashir7576
 
Introduction to Rstudio
Introduction to RstudioIntroduction to Rstudio
Introduction to Rstudio
Olga Scrivner
 
Introduction to STATA(2).pdf
Introduction to STATA(2).pdfIntroduction to STATA(2).pdf
Introduction to STATA(2).pdf
Yomif3
 
Descriptive statistics
Descriptive statisticsDescriptive statistics
Descriptive statistics
Hiba Armouche
 
Construction of life table
Construction of life tableConstruction of life table
Construction of life table
pratapmshinde
 
SPSS introduction Presentation
SPSS introduction Presentation SPSS introduction Presentation
SPSS introduction Presentation
befikra
 
Theory of estimation
Theory of estimationTheory of estimation
Theory of estimation
Tech_MX
 
Descriptive statistics
Descriptive statisticsDescriptive statistics
Descriptive statistics
Attaullah Khan
 
Descriptive Statistics - Thiyagu K
Descriptive Statistics - Thiyagu KDescriptive Statistics - Thiyagu K
Descriptive Statistics - Thiyagu K
Thiyagu K
 

Viewers also liked (13)

STATA - Graphing Data
STATA - Graphing DataSTATA - Graphing Data
STATA - Graphing Data
stata_org_uk
 
Model probit
Model probitModel probit
Model probit
Meina Zubayr
 
Logical Framework And Project Proposal
Logical Framework And Project ProposalLogical Framework And Project Proposal
Logical Framework And Project Proposal
rexcris
 
Probit analysis in toxicological studies
Probit analysis in toxicological studies Probit analysis in toxicological studies
Probit analysis in toxicological studies
kunthavai Nachiyar
 
Probit analysis
Probit analysisProbit analysis
Probit analysis
Pramod935
 
STATA - Probit Analysis
STATA - Probit AnalysisSTATA - Probit Analysis
STATA - Probit Analysis
stata_org_uk
 
Probit and logit model
Probit and logit modelProbit and logit model
Probit and logit model
Jithmi Roddrigo
 
STATA - Panel Regressions
STATA - Panel RegressionsSTATA - Panel Regressions
STATA - Panel Regressions
stata_org_uk
 
STATA - Download Examples
STATA - Download ExamplesSTATA - Download Examples
STATA - Download Examples
stata_org_uk
 
STATA - Time Series Analysis
STATA - Time Series AnalysisSTATA - Time Series Analysis
STATA - Time Series Analysis
stata_org_uk
 
Monitoring and Evaluation Framework
Monitoring and Evaluation FrameworkMonitoring and Evaluation Framework
Monitoring and Evaluation Framework
Dr. Joy Kenneth Sala Biasong
 
Project Monitoring & Evaluation
Project Monitoring & EvaluationProject Monitoring & Evaluation
Project Monitoring & Evaluation
Srinivasan Rengasamy
 
Monitoring & evaluation presentation[1]
Monitoring & evaluation presentation[1]Monitoring & evaluation presentation[1]
Monitoring & evaluation presentation[1]
skzarif
 
STATA - Graphing Data
STATA - Graphing DataSTATA - Graphing Data
STATA - Graphing Data
stata_org_uk
 
Logical Framework And Project Proposal
Logical Framework And Project ProposalLogical Framework And Project Proposal
Logical Framework And Project Proposal
rexcris
 
Probit analysis in toxicological studies
Probit analysis in toxicological studies Probit analysis in toxicological studies
Probit analysis in toxicological studies
kunthavai Nachiyar
 
Probit analysis
Probit analysisProbit analysis
Probit analysis
Pramod935
 
STATA - Probit Analysis
STATA - Probit AnalysisSTATA - Probit Analysis
STATA - Probit Analysis
stata_org_uk
 
STATA - Panel Regressions
STATA - Panel RegressionsSTATA - Panel Regressions
STATA - Panel Regressions
stata_org_uk
 
STATA - Download Examples
STATA - Download ExamplesSTATA - Download Examples
STATA - Download Examples
stata_org_uk
 
STATA - Time Series Analysis
STATA - Time Series AnalysisSTATA - Time Series Analysis
STATA - Time Series Analysis
stata_org_uk
 
Monitoring & evaluation presentation[1]
Monitoring & evaluation presentation[1]Monitoring & evaluation presentation[1]
Monitoring & evaluation presentation[1]
skzarif
 
Ad

Similar to Graphing stata (2 hour course) (20)

METODOLOGIA DEA EN STATA
METODOLOGIA DEA EN STATAMETODOLOGIA DEA EN STATA
METODOLOGIA DEA EN STATA
LuhSm
 
Week 2 Project - STAT 3001Student Name Type your name here.docx
Week 2 Project - STAT 3001Student Name Type your name here.docxWeek 2 Project - STAT 3001Student Name Type your name here.docx
Week 2 Project - STAT 3001Student Name Type your name here.docx
cockekeshia
 
Chapter 2
Chapter 2Chapter 2
Chapter 2
MaryWall14
 
SAMOA: A Platform for Mining Big Data Streams (Apache BigData Europe 2015)
SAMOA: A Platform for Mining Big Data Streams (Apache BigData Europe 2015)SAMOA: A Platform for Mining Big Data Streams (Apache BigData Europe 2015)
SAMOA: A Platform for Mining Big Data Streams (Apache BigData Europe 2015)
Nicolas Kourtellis
 
20151130
2015113020151130
20151130
chen chao
 
Computing and Data Analysis for Environmental Applications
Computing and Data Analysis for Environmental ApplicationsComputing and Data Analysis for Environmental Applications
Computing and Data Analysis for Environmental Applications
Statistics Assignment Help
 
Distributed Streams
Distributed StreamsDistributed Streams
Distributed Streams
Ashraf Bashir
 
Next directions in Mahout's recommenders
Next directions in Mahout's recommendersNext directions in Mahout's recommenders
Next directions in Mahout's recommenders
sscdotopen
 
Topic 4 intro spss_stata 30032012 sy_srini
Topic 4 intro spss_stata 30032012 sy_sriniTopic 4 intro spss_stata 30032012 sy_srini
Topic 4 intro spss_stata 30032012 sy_srini
SM Lalon
 
Graph Tea: Simulating Tool for Graph Theory & Algorithms
Graph Tea: Simulating Tool for Graph Theory & AlgorithmsGraph Tea: Simulating Tool for Graph Theory & Algorithms
Graph Tea: Simulating Tool for Graph Theory & Algorithms
IJMTST Journal
 
Oleksandr Frei and Murat Apishev - Parallel Non-blocking Deterministic Algori...
Oleksandr Frei and Murat Apishev - Parallel Non-blocking Deterministic Algori...Oleksandr Frei and Murat Apishev - Parallel Non-blocking Deterministic Algori...
Oleksandr Frei and Murat Apishev - Parallel Non-blocking Deterministic Algori...
AIST
 
JFree chart
JFree chartJFree chart
JFree chart
NexThoughts Technologies
 
R and Visualization: A match made in Heaven
R and Visualization: A match made in HeavenR and Visualization: A match made in Heaven
R and Visualization: A match made in Heaven
Edureka!
 
R programming & Machine Learning
R programming & Machine LearningR programming & Machine Learning
R programming & Machine Learning
AmanBhalla14
 
Data-Intensive Scalable Science
Data-Intensive Scalable ScienceData-Intensive Scalable Science
Data-Intensive Scalable Science
University of Washington
 
F14 lec12graphs
F14 lec12graphsF14 lec12graphs
F14 lec12graphs
ankush karwa
 
Matlab practical ---1.pdf
Matlab practical ---1.pdfMatlab practical ---1.pdf
Matlab practical ---1.pdf
Central university of Haryana
 
January 2016 Meetup: Speeding up (big) data manipulation with data.table package
January 2016 Meetup: Speeding up (big) data manipulation with data.table packageJanuary 2016 Meetup: Speeding up (big) data manipulation with data.table package
January 2016 Meetup: Speeding up (big) data manipulation with data.table package
Zurich_R_User_Group
 
Session 04 communicating results
Session 04 communicating resultsSession 04 communicating results
Session 04 communicating results
Sara-Jayne Terp
 
Session 04 communicating results
Session 04 communicating resultsSession 04 communicating results
Session 04 communicating results
bodaceacat
 
METODOLOGIA DEA EN STATA
METODOLOGIA DEA EN STATAMETODOLOGIA DEA EN STATA
METODOLOGIA DEA EN STATA
LuhSm
 
Week 2 Project - STAT 3001Student Name Type your name here.docx
Week 2 Project - STAT 3001Student Name Type your name here.docxWeek 2 Project - STAT 3001Student Name Type your name here.docx
Week 2 Project - STAT 3001Student Name Type your name here.docx
cockekeshia
 
SAMOA: A Platform for Mining Big Data Streams (Apache BigData Europe 2015)
SAMOA: A Platform for Mining Big Data Streams (Apache BigData Europe 2015)SAMOA: A Platform for Mining Big Data Streams (Apache BigData Europe 2015)
SAMOA: A Platform for Mining Big Data Streams (Apache BigData Europe 2015)
Nicolas Kourtellis
 
Computing and Data Analysis for Environmental Applications
Computing and Data Analysis for Environmental ApplicationsComputing and Data Analysis for Environmental Applications
Computing and Data Analysis for Environmental Applications
Statistics Assignment Help
 
Next directions in Mahout's recommenders
Next directions in Mahout's recommendersNext directions in Mahout's recommenders
Next directions in Mahout's recommenders
sscdotopen
 
Topic 4 intro spss_stata 30032012 sy_srini
Topic 4 intro spss_stata 30032012 sy_sriniTopic 4 intro spss_stata 30032012 sy_srini
Topic 4 intro spss_stata 30032012 sy_srini
SM Lalon
 
Graph Tea: Simulating Tool for Graph Theory & Algorithms
Graph Tea: Simulating Tool for Graph Theory & AlgorithmsGraph Tea: Simulating Tool for Graph Theory & Algorithms
Graph Tea: Simulating Tool for Graph Theory & Algorithms
IJMTST Journal
 
Oleksandr Frei and Murat Apishev - Parallel Non-blocking Deterministic Algori...
Oleksandr Frei and Murat Apishev - Parallel Non-blocking Deterministic Algori...Oleksandr Frei and Murat Apishev - Parallel Non-blocking Deterministic Algori...
Oleksandr Frei and Murat Apishev - Parallel Non-blocking Deterministic Algori...
AIST
 
R and Visualization: A match made in Heaven
R and Visualization: A match made in HeavenR and Visualization: A match made in Heaven
R and Visualization: A match made in Heaven
Edureka!
 
R programming & Machine Learning
R programming & Machine LearningR programming & Machine Learning
R programming & Machine Learning
AmanBhalla14
 
January 2016 Meetup: Speeding up (big) data manipulation with data.table package
January 2016 Meetup: Speeding up (big) data manipulation with data.table packageJanuary 2016 Meetup: Speeding up (big) data manipulation with data.table package
January 2016 Meetup: Speeding up (big) data manipulation with data.table package
Zurich_R_User_Group
 
Session 04 communicating results
Session 04 communicating resultsSession 04 communicating results
Session 04 communicating results
Sara-Jayne Terp
 
Session 04 communicating results
Session 04 communicating resultsSession 04 communicating results
Session 04 communicating results
bodaceacat
 
Ad

More from izahn (6)

Introduction to SAS
Introduction to SASIntroduction to SAS
Introduction to SAS
izahn
 
Stata datman
Stata datmanStata datman
Stata datman
izahn
 
Introduction to R Programming
Introduction to R ProgrammingIntroduction to R Programming
Introduction to R Programming
izahn
 
Introduction to R Graphics with ggplot2
Introduction to R Graphics with ggplot2Introduction to R Graphics with ggplot2
Introduction to R Graphics with ggplot2
izahn
 
R Regression Models with Zelig
R Regression Models with ZeligR Regression Models with Zelig
R Regression Models with Zelig
izahn
 
Introduction to the R Statistical Computing Environment
Introduction to the R Statistical Computing EnvironmentIntroduction to the R Statistical Computing Environment
Introduction to the R Statistical Computing Environment
izahn
 
Introduction to SAS
Introduction to SASIntroduction to SAS
Introduction to SAS
izahn
 
Stata datman
Stata datmanStata datman
Stata datman
izahn
 
Introduction to R Programming
Introduction to R ProgrammingIntroduction to R Programming
Introduction to R Programming
izahn
 
Introduction to R Graphics with ggplot2
Introduction to R Graphics with ggplot2Introduction to R Graphics with ggplot2
Introduction to R Graphics with ggplot2
izahn
 
R Regression Models with Zelig
R Regression Models with ZeligR Regression Models with Zelig
R Regression Models with Zelig
izahn
 
Introduction to the R Statistical Computing Environment
Introduction to the R Statistical Computing EnvironmentIntroduction to the R Statistical Computing Environment
Introduction to the R Statistical Computing Environment
izahn
 

Recently uploaded (20)

Marie Boran Special Collections Librarian Hardiman Library, University of Gal...
Marie Boran Special Collections Librarian Hardiman Library, University of Gal...Marie Boran Special Collections Librarian Hardiman Library, University of Gal...
Marie Boran Special Collections Librarian Hardiman Library, University of Gal...
Library Association of Ireland
 
CBSE - Grade 8 - Science - Chemistry - Metals and Non Metals - Worksheet
CBSE - Grade 8 - Science - Chemistry - Metals and Non Metals - WorksheetCBSE - Grade 8 - Science - Chemistry - Metals and Non Metals - Worksheet
CBSE - Grade 8 - Science - Chemistry - Metals and Non Metals - Worksheet
Sritoma Majumder
 
Presentation of the MIPLM subject matter expert Erdem Kaya
Presentation of the MIPLM subject matter expert Erdem KayaPresentation of the MIPLM subject matter expert Erdem Kaya
Presentation of the MIPLM subject matter expert Erdem Kaya
MIPLM
 
How to Manage Opening & Closing Controls in Odoo 17 POS
How to Manage Opening & Closing Controls in Odoo 17 POSHow to Manage Opening & Closing Controls in Odoo 17 POS
How to Manage Opening & Closing Controls in Odoo 17 POS
Celine George
 
YSPH VMOC Special Report - Measles Outbreak Southwest US 4-30-2025.pptx
YSPH VMOC Special Report - Measles Outbreak  Southwest US 4-30-2025.pptxYSPH VMOC Special Report - Measles Outbreak  Southwest US 4-30-2025.pptx
YSPH VMOC Special Report - Measles Outbreak Southwest US 4-30-2025.pptx
Yale School of Public Health - The Virtual Medical Operations Center (VMOC)
 
Social Problem-Unemployment .pptx notes for Physiotherapy Students
Social Problem-Unemployment .pptx notes for Physiotherapy StudentsSocial Problem-Unemployment .pptx notes for Physiotherapy Students
Social Problem-Unemployment .pptx notes for Physiotherapy Students
DrNidhiAgarwal
 
YSPH VMOC Special Report - Measles Outbreak Southwest US 5-3-2025.pptx
YSPH VMOC Special Report - Measles Outbreak  Southwest US 5-3-2025.pptxYSPH VMOC Special Report - Measles Outbreak  Southwest US 5-3-2025.pptx
YSPH VMOC Special Report - Measles Outbreak Southwest US 5-3-2025.pptx
Yale School of Public Health - The Virtual Medical Operations Center (VMOC)
 
Stein, Hunt, Green letter to Congress April 2025
Stein, Hunt, Green letter to Congress April 2025Stein, Hunt, Green letter to Congress April 2025
Stein, Hunt, Green letter to Congress April 2025
Mebane Rash
 
GDGLSPGCOER - Git and GitHub Workshop.pptx
GDGLSPGCOER - Git and GitHub Workshop.pptxGDGLSPGCOER - Git and GitHub Workshop.pptx
GDGLSPGCOER - Git and GitHub Workshop.pptx
azeenhodekar
 
How to manage Multiple Warehouses for multiple floors in odoo point of sale
How to manage Multiple Warehouses for multiple floors in odoo point of saleHow to manage Multiple Warehouses for multiple floors in odoo point of sale
How to manage Multiple Warehouses for multiple floors in odoo point of sale
Celine George
 
To study the nervous system of insect.pptx
To study the nervous system of insect.pptxTo study the nervous system of insect.pptx
To study the nervous system of insect.pptx
Arshad Shaikh
 
apa-style-referencing-visual-guide-2025.pdf
apa-style-referencing-visual-guide-2025.pdfapa-style-referencing-visual-guide-2025.pdf
apa-style-referencing-visual-guide-2025.pdf
Ishika Ghosh
 
Understanding P–N Junction Semiconductors: A Beginner’s Guide
Understanding P–N Junction Semiconductors: A Beginner’s GuideUnderstanding P–N Junction Semiconductors: A Beginner’s Guide
Understanding P–N Junction Semiconductors: A Beginner’s Guide
GS Virdi
 
Quality Contril Analysis of Containers.pdf
Quality Contril Analysis of Containers.pdfQuality Contril Analysis of Containers.pdf
Quality Contril Analysis of Containers.pdf
Dr. Bindiya Chauhan
 
LDMMIA Reiki Master Spring 2025 Mini Updates
LDMMIA Reiki Master Spring 2025 Mini UpdatesLDMMIA Reiki Master Spring 2025 Mini Updates
LDMMIA Reiki Master Spring 2025 Mini Updates
LDM Mia eStudios
 
Presentation on Tourism Product Development By Md Shaifullar Rabbi
Presentation on Tourism Product Development By Md Shaifullar RabbiPresentation on Tourism Product Development By Md Shaifullar Rabbi
Presentation on Tourism Product Development By Md Shaifullar Rabbi
Md Shaifullar Rabbi
 
Multi-currency in odoo accounting and Update exchange rates automatically in ...
Multi-currency in odoo accounting and Update exchange rates automatically in ...Multi-currency in odoo accounting and Update exchange rates automatically in ...
Multi-currency in odoo accounting and Update exchange rates automatically in ...
Celine George
 
New Microsoft PowerPoint Presentation.pptx
New Microsoft PowerPoint Presentation.pptxNew Microsoft PowerPoint Presentation.pptx
New Microsoft PowerPoint Presentation.pptx
milanasargsyan5
 
pulse ppt.pptx Types of pulse , characteristics of pulse , Alteration of pulse
pulse  ppt.pptx Types of pulse , characteristics of pulse , Alteration of pulsepulse  ppt.pptx Types of pulse , characteristics of pulse , Alteration of pulse
pulse ppt.pptx Types of pulse , characteristics of pulse , Alteration of pulse
sushreesangita003
 
2541William_McCollough_DigitalDetox.docx
2541William_McCollough_DigitalDetox.docx2541William_McCollough_DigitalDetox.docx
2541William_McCollough_DigitalDetox.docx
contactwilliamm2546
 
Marie Boran Special Collections Librarian Hardiman Library, University of Gal...
Marie Boran Special Collections Librarian Hardiman Library, University of Gal...Marie Boran Special Collections Librarian Hardiman Library, University of Gal...
Marie Boran Special Collections Librarian Hardiman Library, University of Gal...
Library Association of Ireland
 
CBSE - Grade 8 - Science - Chemistry - Metals and Non Metals - Worksheet
CBSE - Grade 8 - Science - Chemistry - Metals and Non Metals - WorksheetCBSE - Grade 8 - Science - Chemistry - Metals and Non Metals - Worksheet
CBSE - Grade 8 - Science - Chemistry - Metals and Non Metals - Worksheet
Sritoma Majumder
 
Presentation of the MIPLM subject matter expert Erdem Kaya
Presentation of the MIPLM subject matter expert Erdem KayaPresentation of the MIPLM subject matter expert Erdem Kaya
Presentation of the MIPLM subject matter expert Erdem Kaya
MIPLM
 
How to Manage Opening & Closing Controls in Odoo 17 POS
How to Manage Opening & Closing Controls in Odoo 17 POSHow to Manage Opening & Closing Controls in Odoo 17 POS
How to Manage Opening & Closing Controls in Odoo 17 POS
Celine George
 
Social Problem-Unemployment .pptx notes for Physiotherapy Students
Social Problem-Unemployment .pptx notes for Physiotherapy StudentsSocial Problem-Unemployment .pptx notes for Physiotherapy Students
Social Problem-Unemployment .pptx notes for Physiotherapy Students
DrNidhiAgarwal
 
Stein, Hunt, Green letter to Congress April 2025
Stein, Hunt, Green letter to Congress April 2025Stein, Hunt, Green letter to Congress April 2025
Stein, Hunt, Green letter to Congress April 2025
Mebane Rash
 
GDGLSPGCOER - Git and GitHub Workshop.pptx
GDGLSPGCOER - Git and GitHub Workshop.pptxGDGLSPGCOER - Git and GitHub Workshop.pptx
GDGLSPGCOER - Git and GitHub Workshop.pptx
azeenhodekar
 
How to manage Multiple Warehouses for multiple floors in odoo point of sale
How to manage Multiple Warehouses for multiple floors in odoo point of saleHow to manage Multiple Warehouses for multiple floors in odoo point of sale
How to manage Multiple Warehouses for multiple floors in odoo point of sale
Celine George
 
To study the nervous system of insect.pptx
To study the nervous system of insect.pptxTo study the nervous system of insect.pptx
To study the nervous system of insect.pptx
Arshad Shaikh
 
apa-style-referencing-visual-guide-2025.pdf
apa-style-referencing-visual-guide-2025.pdfapa-style-referencing-visual-guide-2025.pdf
apa-style-referencing-visual-guide-2025.pdf
Ishika Ghosh
 
Understanding P–N Junction Semiconductors: A Beginner’s Guide
Understanding P–N Junction Semiconductors: A Beginner’s GuideUnderstanding P–N Junction Semiconductors: A Beginner’s Guide
Understanding P–N Junction Semiconductors: A Beginner’s Guide
GS Virdi
 
Quality Contril Analysis of Containers.pdf
Quality Contril Analysis of Containers.pdfQuality Contril Analysis of Containers.pdf
Quality Contril Analysis of Containers.pdf
Dr. Bindiya Chauhan
 
LDMMIA Reiki Master Spring 2025 Mini Updates
LDMMIA Reiki Master Spring 2025 Mini UpdatesLDMMIA Reiki Master Spring 2025 Mini Updates
LDMMIA Reiki Master Spring 2025 Mini Updates
LDM Mia eStudios
 
Presentation on Tourism Product Development By Md Shaifullar Rabbi
Presentation on Tourism Product Development By Md Shaifullar RabbiPresentation on Tourism Product Development By Md Shaifullar Rabbi
Presentation on Tourism Product Development By Md Shaifullar Rabbi
Md Shaifullar Rabbi
 
Multi-currency in odoo accounting and Update exchange rates automatically in ...
Multi-currency in odoo accounting and Update exchange rates automatically in ...Multi-currency in odoo accounting and Update exchange rates automatically in ...
Multi-currency in odoo accounting and Update exchange rates automatically in ...
Celine George
 
New Microsoft PowerPoint Presentation.pptx
New Microsoft PowerPoint Presentation.pptxNew Microsoft PowerPoint Presentation.pptx
New Microsoft PowerPoint Presentation.pptx
milanasargsyan5
 
pulse ppt.pptx Types of pulse , characteristics of pulse , Alteration of pulse
pulse  ppt.pptx Types of pulse , characteristics of pulse , Alteration of pulsepulse  ppt.pptx Types of pulse , characteristics of pulse , Alteration of pulse
pulse ppt.pptx Types of pulse , characteristics of pulse , Alteration of pulse
sushreesangita003
 
2541William_McCollough_DigitalDetox.docx
2541William_McCollough_DigitalDetox.docx2541William_McCollough_DigitalDetox.docx
2541William_McCollough_DigitalDetox.docx
contactwilliamm2546
 

Graphing stata (2 hour course)

  • 1. Stata Graphics Harvard MIT Data Center The Institute for Quantitative Social Science at Harvard University (Harvard MIT Data Center) Stata Graphics 1 / 38
  • 2. Outline 1 Introduction 2 Univariate Graphics 3 Bivariate Graphics 4 More Fun with Twoway Line Graphs 5 Wrap-up (Harvard MIT Data Center) Stata Graphics 2 / 38
  • 3. Introduction Topic 1 Introduction 2 Univariate Graphics 3 Bivariate Graphics 4 More Fun with Twoway Line Graphs 5 Wrap-up (Harvard MIT Data Center) Stata Graphics 3 / 38
  • 4. Introduction Documents for today USERNAME: dataclass PASSWORD: dataclass Find class materials at: Scratch > StataStatistics FIRST THING: copy this folder to your desktop! (Harvard MIT Data Center) Stata Graphics 4 / 38
  • 5. Introduction Organization Please feel free to ask questions at any point if they are relevant to the current topic (or if you are lost!) There will be a Q&A after class for more specific, personalized questions Collaboration with your neighbors is encouraged If you are using a laptop, you will need to adjust paths accordingly Make comments in your Do-file rather than on hand-outs Save on flash drive or email to yourself (Harvard MIT Data Center) Stata Graphics 5 / 38
  • 6. Introduction Graphing Strategies Keep it simple Labels, labels, labels!! Avoid cluttered graphs Every part of the graph should be meaningful Avoid: Shading Distracting colors Decoration Always know what you’re working with before you get started Recognize scale of data If you’re using multiple variables – how do their scales align? Before any graphing procedure review variables with codebook, sum, tab, etc. HELPFUL STATA HINT: If you want your command to go on multiple lines use /// at end of each line (Harvard MIT Data Center) Stata Graphics 6 / 38
  • 7. Introduction Terrible Graph (Harvard MIT Data Center) Stata Graphics 7 / 38
  • 8. Introduction Much Better Graph (Harvard MIT Data Center) Stata Graphics 8 / 38
  • 9. Univariate Graphics Topic 1 Introduction 2 Univariate Graphics 3 Bivariate Graphics 4 More Fun with Twoway Line Graphs 5 Wrap-up (Harvard MIT Data Center) Stata Graphics 9 / 38
  • 10. Univariate Graphics Our First Dataset Time Magazine Public School Poll Based on survey of 1,000 adults in U.S. Conducted in August 2010 Questions regarding feelings about parental involvement, teachers union, current potential for reform Open Stata and call up the datafile for today // Step 1: tell Stata where to find data: cd /Users/dataclass/Desktop/StataGraphics/dataSets // Step 2: call up our dataset: use TimePollPubSchools.dta (Harvard MIT Data Center) Stata Graphics 10 / 38
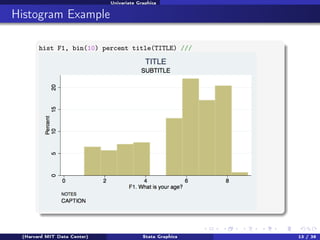
  • 11. Univariate Graphics Single Continuous Variables Example: Histograms Stata assumes you’re working with continuous data Very simple syntax: hist varname Put a comma after your varname and start adding options bin(#) : change the number of bars that the graph displays normal : overlay normal curve addlabels : add actual values to bars (Harvard MIT Data Center) Stata Graphics 11 / 38
  • 12. Univariate Graphics Histogram Options To change the numeric depiction of your data add these options after the comma Choose one: density fraction frequency percent Be sure to properly describe your histogram: title(insert name of graph) subtitle(insert subtitle of graph) note(insert note to appear at bottom of graph) caption(insert caption to appear below notes) (Harvard MIT Data Center) Stata Graphics 12 / 38
  • 13. Univariate Graphics Histogram Example hist F1, bin(10) percent title(TITLE) /// subtitle(SUBTITLE) caption(CAPTION) note(NOTES) (Harvard MIT Data Center) Stata Graphics 13 / 38
  • 14. Univariate Graphics Axis Titles and Labels Example: Histograms Axis title options (default is variable label): xtitle(insert x axis name) ytitle(insert y axis name) Don’t want axis titles? xtitle("") ytitle("") Add labels to X or Y axis: xlabel(insert x axis label) ylabel(insert y axis label) Tell Stata how to scale each axis xlabel(start#(increment)end#) xlabel(0(5)100) This would label x-axis from 0-100 in increments of 5 (Harvard MIT Data Center) Stata Graphics 14 / 38
  • 15. Univariate Graphics Axis Labels Example hist F1, bin(10) percent title(TITLE) subtitle(SUBTITLE) /// caption(CAPTION) note(NOTES) /// xtitle(Here ’ s your x-axis title) /// ytitle(here ’ s your y-axis title) (Harvard MIT Data Center) Stata Graphics 15 / 38
  • 16. Univariate Graphics Basic Graphing: Single Categorical Variables We can also use the hist command for bar graphs Simply specify "discrete" with options Stata will produce one bar for each level (i.e. category) of variable Use xlabel command to insert names of individual categories hist F4, title(Racial breakdown of Time Poll Sample) xtitle(Race) /// ytitle(Percent) xlabel(1 "White" 2 "Black" 3 "Asian" 4 "Hispanic" /// 5 "Other") discrete percent addlabels (Harvard MIT Data Center) Stata Graphics 16 / 38
  • 17. Univariate Graphics Exercise 1: Histograms Bar Graphs 1 Open the datafile, NatNeighCrimeStudy.dta. 2 Create a histogram of the tract-level poverty rate (variable name: T_POVRTY). 3 Insert the normal curve over the histogram 4 Change the numeric representation on the Y-axis to "percent" 5 Add appropriate titles to the overall graph and the x axis and y axis. Also, add a note that states the source of this data. 6 Open the datafile, TimePollPubSchools.dta 7 Create a histogram of the question, "What grade would you give your child’s school" (variable name: Q11). Be sure to tell Stata that this is a categorical variable. 8 Format this graph so that the axes have proper titles and labels. Also, add an appropriate title to the overall graph that goes onto two lines. Add a note stating the source of the data. (Harvard MIT Data Center) Stata Graphics 17 / 38
  • 18. Univariate Graphics Next Dataset: National Neighborhood Crime Study (NNCS) N=9,593 census tracts in 2000 Explore sources of variation in crime for communities in the United States Tract-level data: crime, social disorganization, disadvantage, socioeconomic inequality City-level data: labor market, socioeconomic inequality, population change (Harvard MIT Data Center) Stata Graphics 18 / 38
  • 19. Bivariate Graphics Topic 1 Introduction 2 Univariate Graphics 3 Bivariate Graphics 4 More Fun with Twoway Line Graphs 5 Wrap-up (Harvard MIT Data Center) Stata Graphics 19 / 38
  • 20. Bivariate Graphics The Twoway Family twoway is basic Stata command for all twoway graphs Use twoway anytime you want to make comparisons among variables Can be used to combine graphs (i.e., overlay one graph with another e.g., insert line of best fit over a scatter plot Some basic examples: use NatNeighCrimeStudy.dta tw scatter T_PERCAP T_VIOLNT tw dropline T_PERCAP T_VIOLNT tw lfitci T_PERCAP T_VIOLNT (Harvard MIT Data Center) Stata Graphics 20 / 38
  • 21. Bivariate Graphics Twoway and the "by" Statement twoway scatter T_PERCAP T_VIOLNT, by(DIVISION) (Harvard MIT Data Center) Stata Graphics 21 / 38
  • 22. Bivariate Graphics Twoway Title Options Same title options as with histogram title(insert name of graph) subtitle(insert subtitle of graph) note(insert note to appear at bottom of graph) caption(insert caption to appear below notes) (Harvard MIT Data Center) Stata Graphics 22 / 38
  • 23. Bivariate Graphics Twoway Title Options Example twoway scatter T_PERCAP T_VIOLNT, /// title(Comparison of Per Capita Income /// and Violent Crime Rate at Tract level) /// xtitle(Violent Crime Rate) ytitle(Per Capita Income) /// note(Source: National Neighborhood Crime Study 2000) The title is a bit cramped–let’s fix that: twoway scatter T_PERCAP T_VIOLNT, /// title("Comparison of Per Capita Income" /// "and Violent Crime Rate at Tract level") /// xtitle(Violent Crime Rate) ytitle(Per Capita Income) /// note(Source: National Neighborhood Crime Study 2000) (Harvard MIT Data Center) Stata Graphics 23 / 38
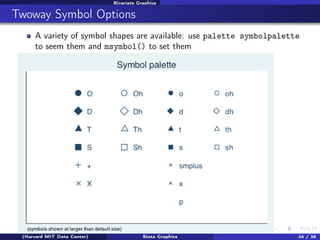
  • 24. Bivariate Graphics Twoway Symbol Options A variety of symbol shapes are available: use palette symbolpalette to seem them and msymbol() to set them (Harvard MIT Data Center) Stata Graphics 24 / 38
  • 25. Bivariate Graphics Twoway Symbol Options twoway scatter T_PERCAP T_VIOLNT, /// title("Comparison of Per Capita Income" /// "and Violent Crime Rate at Tract level") /// xtitle(Violent Crime Rate) ytitle(Per Capita Income) /// note(Source: National Neighborhood Crime Study 2000) /// msymbol(Sh) mcolor("red") (Harvard MIT Data Center) Stata Graphics 25 / 38
  • 26. Bivariate Graphics Overlaying Twoway Graphs Very simple to combine multiple graphs. . . just put each graph command in parentheses twoway (scatter var1 var2) (lfit var1 var2) Add individual options to each graph within the parentheses Add overall graph options as usual following the comma twoway (scatter var1 var2) (lfit var1 var2), options (Harvard MIT Data Center) Stata Graphics 26 / 38
  • 27. Bivariate Graphics Overlaying Points and Lines twoway (scatter T_PERCAP T_VIOLNT) /// (lfit T_PERCAP T_VIOLNT), /// title("Comparison of Per Capita Income" /// "and Violent Crime Rate at Tract level") /// xtitle(Violent Crime Rate) ytitle(Per Capita Income) /// note(Source: National Neighborhood Crime Study 2000) (Harvard MIT Data Center) Stata Graphics 27 / 38
  • 28. Bivariate Graphics Overlaying Points and Labels twoway (scatter T_PERCAP T_VIOLNT if T_VIOLNT==1976, /// mlabel(CITY)) (scatter T_PERCAP T_VIOLNT), /// title("Comparison of Per Capita Income" /// "and Violent Crime Rate at Tract level") /// xlabel(0(200)2400) note(Source: National Neighborhood /// Crime Study 2000) legend(off) (Harvard MIT Data Center) Stata Graphics 28 / 38
  • 29. Bivariate Graphics Exercise 2: The TwoWay Family Open the datafile, NatNeighCrimeStudy.dta. 1 Create a basic twoway scatterplot that compares the city unemployment rate (C_UNEMP) to the percent secondary sector low-wage jobs (C_SSLOW) 2 Generate the same scatterplot, but this time, divide the plot by the dummy variable indicating whether the city is located in the south or not (C_SOUTH) 3 Change the color of the symbol that you use in this scatter plot 4 Change the type of symbol you use to a marker of your choice 5 Notice in your scatterplot that is broken down by C_SOUTH that there is an outlier in the upper right hand corner of the "Not South" graph. Add the city name label to this marker. 6 Review the options available under "help twowayoptions " and change one aspect of your graph using an option that we haven’t already reviewed (Harvard MIT Data Center) Stata Graphics 29 / 38
  • 30. More Fun with Twoway Line Graphs Topic 1 Introduction 2 Univariate Graphics 3 Bivariate Graphics 4 More Fun with Twoway Line Graphs 5 Wrap-up (Harvard MIT Data Center) Stata Graphics 30 / 38
  • 31. More Fun with Twoway Line Graphs Line Graphs Line graphs helpful for a variety of data Especially any type of time series data We’ll use data on US life expectancy from 1900-1999 webuse uslifeexp, clear (Harvard MIT Data Center) Stata Graphics 31 / 38
  • 32. More Fun with Twoway Line Graphs Line Graphs webuse uslifeexp, clear twoway (line le_wm year, mcolor("red")) /// (line le_bm year, mcolor("green")) (Harvard MIT Data Center) Stata Graphics 32 / 38
  • 33. More Fun with Twoway Line Graphs Line Graphs twoway (line (le_wfemale le_wmale le_bf le_bm) year, /// lpattern(dot solid dot solid)) (Harvard MIT Data Center) Stata Graphics 33 / 38
  • 34. More Fun with Twoway Line Graphs Stata Graphing Lines palette linepalette (Harvard MIT Data Center) Stata Graphics 34 / 38
  • 35. More Fun with Twoway Line Graphs Exporting Graphs From Stata, right click on image and select "save as" or try syntax: graph export myfig.esp, replace In Microsoft Word: insert > picture > from file Or, right click on graph in Stata and copy and paste into Word (Harvard MIT Data Center) Stata Graphics 35 / 38
  • 36. Wrap-up Topic 1 Introduction 2 Univariate Graphics 3 Bivariate Graphics 4 More Fun with Twoway Line Graphs 5 Wrap-up (Harvard MIT Data Center) Stata Graphics 36 / 38
  • 37. Wrap-up Help Us Make This Workshop Better Please take a moment to fill out a very short feedback form These workshops exist for you–tell us what you need! http://tinyurl.com/StataGraphicsFeedback (Harvard MIT Data Center) Stata Graphics 37 / 38
  • 38. Wrap-up Additional resources training and consulting IQSS workshops: http://projects.iq.harvard.edu/rtc/filter_by/workshops IQSS statistical consulting: http://rtc.iq.harvard.edu Stata resources UCLA website: http://www.ats.ucla.edu/stat/Stata/ Great for self-study Links to resources Stata website: http://www.stata.com/help.cgi?contents Email list: http://www.stata.com/statalist/ (Harvard MIT Data Center) Stata Graphics 38 / 38