SlideShare a Scribd company logo
Step by step : How to use Microsoft Access to combine cost and usage data for ejournals
Scenario: A library has the cost for each subscribed ejournal, drawn from its ILS reporting
system, and exported into Excel and wants to combine this cost information with the usage data
available as Counter JR1 report, to obtain a cost per download report.

Step 1: Create and export a list of ejournal orders from the library’s ILS or vendor system into an
Excel spreadsheet. For example, create an Excel spreadsheet of economics ejournal subscription
orders. It is important that this report is as complete and “clean” as possible. Since the ISSN will
be the data element used as a matchpoint with the SQL Access query, it is important that the
ISSN number is formatted consistently as NNNN-NNNN.

Step by Step Access reports/ Teresa Negrucci, Resource Acq. & Mgmt. Librarian (teresanegrucci@brown.edu) Page

Page 1
Step 2: Download the Counter Journal Report 1 for the year, either from the publishers’ web site,
or through a third-party usage consolidation service, and export into an Excel spreadsheet.

Step by Step Access reports/ Teresa Negrucci, Resource Acq. & Mgmt. Librarian (teresanegrucci@brown.edu) Page

Page 2
Step 3: Import the Excel spreadsheets into Access as tables. In Microsoft Access, open a new
database, then click on the External data tab, and then the import from Excel icon. In the “Select
the source and destination of the data” dialog box, click on the “import the source data into a
new table in the current database” option and use the browse button to locate the Excel
spreadsheet.
Open a new database in Microsoft Access

Import each Excel spreadsheet into Access as tables

Step by Step Access reports/ Teresa Negrucci, Resource Acq. & Mgmt. Librarian (teresanegrucci@brown.edu) Page

Page 3
The Import Spreadsheet wizard will guide you, step by step, to import each Excel data sheet as
an Access table. Make sure that the data type assigned to each field is consistent for each table
that is being created. Access will not allow matching of a data field if field’s data type is not
consistent across each table.
Import Wizard prompt 1: Select the Excel spreadsheet to import

Import Wizard prompt 2: Confirm data fields (column headings) and data types to import

Step by Step Access reports/ Teresa Negrucci, Resource Acq. & Mgmt. Librarian (teresanegrucci@brown.edu) Page

Page 4
Import Wizard prompt 3: No primary key is needed

Import Wizard prompt 4: Name the table and click “finish” to import the data as a table

Step by Step Access reports/ Teresa Negrucci, Resource Acq. & Mgmt. Librarian (teresanegrucci@brown.edu) Page

Page 5
Step 4: Use the Query Design tool to create the SQL query in Access.
Once each spreadsheet is loaded as a table, click on the create tab, then the query design icon.
Note that each of the spreadsheets is now an Access table (left column of the screen). Highlight
and click each of the tables in the “show table” dialog box, and click “add.” This will add each of
the tables into the query display box.

Step by Step Access reports/ Teresa Negrucci, Resource Acq. & Mgmt. Librarian (teresanegrucci@brown.edu) Page

Page 6
The SQL query display box, with the two tables and their data fields in the query design area at
the top of the screen, and the query output box at the bottom of the screen.

By highlighting the data element in one table then dragging the cursor to the same data element
(for example, the ISSN) in the other table, Access will create a connection line (the join)
resulting in a SQL query that matches the data element in each table.

The actual SQL query, which can be viewed by changing the

view button to SQL view, is:

SELECT
FROM [Journal_Holdings_Report_(JR1)] INNER JOIN [Economic ejournal orders] ON
[Journal_Holdings_Report_(JR1)].ISSN = [Economic ejournal orders].[ISSN 1];
However, by staying in design view, you have a visual display of the query.

Step by Step Access reports/ Teresa Negrucci, Resource Acq. & Mgmt. Librarian (teresanegrucci@brown.edu) Page

Page 7
As a final step of creating the SQL query, you will need to add the output fields to the query
output box (bottom part of screen). Simply highlight the asterisk * in each of the tables, and drag
the asterisk to the query output box. This adds each of the data fields from each of the tables to
the results of the query.

Step by Step Access reports/ Teresa Negrucci, Resource Acq. & Mgmt. Librarian (teresanegrucci@brown.edu) Page

Page 8
Step 5: Run the query and view the results. Click the save icon, and name the query. Then click

the run icon

to run the query.

Step by Step Access reports/ Teresa Negrucci, Resource Acq. & Mgmt. Librarian (teresanegrucci@brown.edu) Page

Page 9
Step 6: Export the query results into Excel.
The results of the query, which combines the data from the two tables, will appear in the main
screen, or by clicking view icon
, for the data sheet view. These title results can then be cut
and pasted (up to 65,000 records at a time) into Excel. In this example, the ISSN 1 from the
economic ejournal order tables matched to the ISSN from the Counter JR1 report.

An additional query can be run, using the ISSN 2 from the economic ejournal order tables
matched to the ISSN from the Counter JR1 report, and the results exported into Excel.

Step by Step Access reports/ Teresa Negrucci, Resource Acq. & Mgmt. Librarian (teresanegrucci@brown.edu) Page

Page 10
Once the results are in Excel, you can use Excel’s “Remove duplicates” function to de-dupe the
results by a unique identifier, such as the Bib #.

Step 7: Calculate the cost per download. With the cost and usage data merged into a single Excel
spreadsheet, the formula function in Excel can then be used to calculate the cost per download.

Step by Step Access reports/ Teresa Negrucci, Resource Acq. & Mgmt. Librarian (teresanegrucci@brown.edu) Page

Page 11

More Related Content

What's hot (20)

PPTX
Formulas in ms excel for statistics(report2 in ict math ed)
Caryl Mae Puertollano
 
PPTX
MS Excel Pivot Table Reports & Charts
dnbakhan
 
DOCX
Pivot Table & Chart_Parakramesh Jaroli_Pacific University
Parakramesh Jaroli
 
PPTX
Starting With Microsoft Excel
Karla P. Corral
 
PPTX
Introduction to excel - application to statistics
zavenger
 
PPTX
Pivot table
Vijay Perepa
 
PPSX
Using financial functions in ms excel
PrakharLodha26
 
PPTX
Charts and pivot tables
UttaraChattopadhyay
 
PPTX
Excel to excel
AccXchange
 
PPT
Pivot Tables
Dr. C.V. Suresh Babu
 
DOCX
Assignment in era
SarahPaynandos
 
PDF
Excel Crash Course: Pivot Tables
Bobby Jones
 
PPTX
Uses of MSExcel
anam
 
PPTX
EXCEL
erikamdc
 
PDF
Microsoft Excel 2013 Basics course
Muhammad Shakir
 
PPTX
Introduction to SiteCatalyst ReportBuilder
Peter O'Neill
 
PDF
EX16_WD_CH03_GRADER_CAP_AS - Weather 1.0 (completed solution)
NinaDobrev22
 
PPT
Excel 2007 Get Started With Pivot Table Reports
Oklahoma Dept. Mental Health
 
PDF
X rec extened reconciliation using excel vba
senthilsundaresan
 
PPTX
Excel Pivot Tables
Matt Saragusa
 
Formulas in ms excel for statistics(report2 in ict math ed)
Caryl Mae Puertollano
 
MS Excel Pivot Table Reports & Charts
dnbakhan
 
Pivot Table & Chart_Parakramesh Jaroli_Pacific University
Parakramesh Jaroli
 
Starting With Microsoft Excel
Karla P. Corral
 
Introduction to excel - application to statistics
zavenger
 
Pivot table
Vijay Perepa
 
Using financial functions in ms excel
PrakharLodha26
 
Charts and pivot tables
UttaraChattopadhyay
 
Excel to excel
AccXchange
 
Pivot Tables
Dr. C.V. Suresh Babu
 
Assignment in era
SarahPaynandos
 
Excel Crash Course: Pivot Tables
Bobby Jones
 
Uses of MSExcel
anam
 
EXCEL
erikamdc
 
Microsoft Excel 2013 Basics course
Muhammad Shakir
 
Introduction to SiteCatalyst ReportBuilder
Peter O'Neill
 
EX16_WD_CH03_GRADER_CAP_AS - Weather 1.0 (completed solution)
NinaDobrev22
 
Excel 2007 Get Started With Pivot Table Reports
Oklahoma Dept. Mental Health
 
X rec extened reconciliation using excel vba
senthilsundaresan
 
Excel Pivot Tables
Matt Saragusa
 

Viewers also liked (17)

PPTX
Acquisitions for Newbies
Charleston Conference
 
PPTX
You Have a DDA E-book Plan, Now How Do You Manage It?: Streamlining Individua...
Charleston Conference
 
PPTX
ASERL's Collaborative Federal Depository Program
Charleston Conference
 
PDF
Meeting User Needs & Expectations: A Library’s Quest for Discovery
Charleston Conference
 
PPTX
Transformation of the Newspaper Business, by Chris Cowan
Charleston Conference
 
PPTX
Electronic Resources Management: Functional Integration in Technical Services
Charleston Conference
 
PPSX
The Individual in the Institution: Integrating the User Experience by Michael...
Charleston Conference
 
PPSX
Mobile Access, by Mark Johnson, Highwire
Charleston Conference
 
PPTX
Shared E-books from Coast to Coast: Consortial Programs in Florida and the Pa...
Charleston Conference
 
PPTX
Rebuilding the Plane While Flying: Library/Vendor Strategies for Approval Pla...
Charleston Conference
 
PPTX
If You Fund it, They Will Come: Leveraging Grants to Gain Faculty Collaboration
Charleston Conference
 
PPT
Launching an ePreferred Approval Plan, by Aisha Harvey, Duke University Libra...
Charleston Conference
 
PDF
How to Build a Digital Library
Charleston Conference
 
PPTX
120 to 12: Reducing days to shelf with vendor services, cat-on-receipt and au...
Charleston Conference
 
PPTX
Offthe shelfe bookforacademiclibrarians
Charleston Conference
 
PPTX
The Road Oft Traveled: Collection Analysis and Developmet in a Modern Academi...
Charleston Conference
 
PDF
Alphorm.com Formation Implémenter une PKI avec ADCS 2012 R2
Alphorm
 
Acquisitions for Newbies
Charleston Conference
 
You Have a DDA E-book Plan, Now How Do You Manage It?: Streamlining Individua...
Charleston Conference
 
ASERL's Collaborative Federal Depository Program
Charleston Conference
 
Meeting User Needs & Expectations: A Library’s Quest for Discovery
Charleston Conference
 
Transformation of the Newspaper Business, by Chris Cowan
Charleston Conference
 
Electronic Resources Management: Functional Integration in Technical Services
Charleston Conference
 
The Individual in the Institution: Integrating the User Experience by Michael...
Charleston Conference
 
Mobile Access, by Mark Johnson, Highwire
Charleston Conference
 
Shared E-books from Coast to Coast: Consortial Programs in Florida and the Pa...
Charleston Conference
 
Rebuilding the Plane While Flying: Library/Vendor Strategies for Approval Pla...
Charleston Conference
 
If You Fund it, They Will Come: Leveraging Grants to Gain Faculty Collaboration
Charleston Conference
 
Launching an ePreferred Approval Plan, by Aisha Harvey, Duke University Libra...
Charleston Conference
 
How to Build a Digital Library
Charleston Conference
 
120 to 12: Reducing days to shelf with vendor services, cat-on-receipt and au...
Charleston Conference
 
Offthe shelfe bookforacademiclibrarians
Charleston Conference
 
The Road Oft Traveled: Collection Analysis and Developmet in a Modern Academi...
Charleston Conference
 
Alphorm.com Formation Implémenter une PKI avec ADCS 2012 R2
Alphorm
 
Ad

Similar to Handouts how to use microsoft access to combine cost and usage data for ejournals (20)

PPTX
PPT On MS-Access 2007 | Full Concepts |
Umesh Kumar
 
DOCX
INTRODUCTION TO ACCESSOBJECTIVESDefine th.docx
mariuse18nolet
 
PPT
Overview of MS Access A Beginner's Guide to Creating and Managing Databases.ppt
CUO VEERANAN VEERANAN
 
PPTX
Microsoft access
ReshmiSV
 
PDF
Access2003
tanik363
 
PDF
Access2003
mrh1222
 
PPTX
Chapter 4 microsoft access 2010
home
 
PDF
Access 2010
Cikgu Syahidon
 
PPTX
220711130045_PRIYA_DAS_M.S___Access__ppt
Dr Aniket Sutradhar (Kalna College)
 
PPTX
Database Project
haleycockrell208
 
DOCX
1 Week 6 - What Well Be Working On This Week In th.docx
dorishigh
 
PPT
Access.01.ppt
KarenCato1
 
PPT
HARJOT.ppt
satgup78
 
PDF
Microsoft Access Notes 2007 Ecdl
Richard Butler
 
PPT
22_presentation.ppt
BhaktiSagarVideos
 
PPTX
Priyank Goel PPT.pptx
Namangupta562588
 
PPTX
Access Chapter 02
jgardne4
 
PDF
Operate Database Application UC info sheet.pdf
RemadanMohammed
 
PPT
Access 4 U
Sherry Knowles
 
PPTX
MS Access.pptx
GadgetGlitchKill
 
PPT On MS-Access 2007 | Full Concepts |
Umesh Kumar
 
INTRODUCTION TO ACCESSOBJECTIVESDefine th.docx
mariuse18nolet
 
Overview of MS Access A Beginner's Guide to Creating and Managing Databases.ppt
CUO VEERANAN VEERANAN
 
Microsoft access
ReshmiSV
 
Access2003
tanik363
 
Access2003
mrh1222
 
Chapter 4 microsoft access 2010
home
 
Access 2010
Cikgu Syahidon
 
220711130045_PRIYA_DAS_M.S___Access__ppt
Dr Aniket Sutradhar (Kalna College)
 
Database Project
haleycockrell208
 
1 Week 6 - What Well Be Working On This Week In th.docx
dorishigh
 
Access.01.ppt
KarenCato1
 
HARJOT.ppt
satgup78
 
Microsoft Access Notes 2007 Ecdl
Richard Butler
 
22_presentation.ppt
BhaktiSagarVideos
 
Priyank Goel PPT.pptx
Namangupta562588
 
Access Chapter 02
jgardne4
 
Operate Database Application UC info sheet.pdf
RemadanMohammed
 
Access 4 U
Sherry Knowles
 
MS Access.pptx
GadgetGlitchKill
 
Ad

Recently uploaded (20)

PDF
NLJUG Speaker academy 2025 - first session
Bert Jan Schrijver
 
PPTX
COMPARISON OF RASTER ANALYSIS TOOLS OF QGIS AND ARCGIS
Sharanya Sarkar
 
PDF
Bitcoin for Millennials podcast with Bram, Power Laws of Bitcoin
Stephen Perrenod
 
PPT
Ericsson LTE presentation SEMINAR 2010.ppt
npat3
 
PDF
The Rise of AI and IoT in Mobile App Tech.pdf
IMG Global Infotech
 
PDF
AI Agents in the Cloud: The Rise of Agentic Cloud Architecture
Lilly Gracia
 
PDF
LOOPS in C Programming Language - Technology
RishabhDwivedi43
 
PDF
🚀 Let’s Build Our First Slack Workflow! 🔧.pdf
SanjeetMishra29
 
PPTX
MuleSoft MCP Support (Model Context Protocol) and Use Case Demo
shyamraj55
 
PDF
Agentic AI lifecycle for Enterprise Hyper-Automation
Debmalya Biswas
 
PPTX
New ThousandEyes Product Innovations: Cisco Live June 2025
ThousandEyes
 
PDF
Go Concurrency Real-World Patterns, Pitfalls, and Playground Battles.pdf
Emily Achieng
 
PPTX
Agentforce World Tour Toronto '25 - MCP with MuleSoft
Alexandra N. Martinez
 
PPTX
Digital Circuits, important subject in CS
contactparinay1
 
PDF
POV_ Why Enterprises Need to Find Value in ZERO.pdf
darshakparmar
 
PDF
CIFDAQ Market Wrap for the week of 4th July 2025
CIFDAQ
 
PPTX
Designing_the_Future_AI_Driven_Product_Experiences_Across_Devices.pptx
presentifyai
 
PDF
“Computer Vision at Sea: Automated Fish Tracking for Sustainable Fishing,” a ...
Edge AI and Vision Alliance
 
PDF
ICONIQ State of AI Report 2025 - The Builder's Playbook
Razin Mustafiz
 
PDF
Future-Proof or Fall Behind? 10 Tech Trends You Can’t Afford to Ignore in 2025
DIGITALCONFEX
 
NLJUG Speaker academy 2025 - first session
Bert Jan Schrijver
 
COMPARISON OF RASTER ANALYSIS TOOLS OF QGIS AND ARCGIS
Sharanya Sarkar
 
Bitcoin for Millennials podcast with Bram, Power Laws of Bitcoin
Stephen Perrenod
 
Ericsson LTE presentation SEMINAR 2010.ppt
npat3
 
The Rise of AI and IoT in Mobile App Tech.pdf
IMG Global Infotech
 
AI Agents in the Cloud: The Rise of Agentic Cloud Architecture
Lilly Gracia
 
LOOPS in C Programming Language - Technology
RishabhDwivedi43
 
🚀 Let’s Build Our First Slack Workflow! 🔧.pdf
SanjeetMishra29
 
MuleSoft MCP Support (Model Context Protocol) and Use Case Demo
shyamraj55
 
Agentic AI lifecycle for Enterprise Hyper-Automation
Debmalya Biswas
 
New ThousandEyes Product Innovations: Cisco Live June 2025
ThousandEyes
 
Go Concurrency Real-World Patterns, Pitfalls, and Playground Battles.pdf
Emily Achieng
 
Agentforce World Tour Toronto '25 - MCP with MuleSoft
Alexandra N. Martinez
 
Digital Circuits, important subject in CS
contactparinay1
 
POV_ Why Enterprises Need to Find Value in ZERO.pdf
darshakparmar
 
CIFDAQ Market Wrap for the week of 4th July 2025
CIFDAQ
 
Designing_the_Future_AI_Driven_Product_Experiences_Across_Devices.pptx
presentifyai
 
“Computer Vision at Sea: Automated Fish Tracking for Sustainable Fishing,” a ...
Edge AI and Vision Alliance
 
ICONIQ State of AI Report 2025 - The Builder's Playbook
Razin Mustafiz
 
Future-Proof or Fall Behind? 10 Tech Trends You Can’t Afford to Ignore in 2025
DIGITALCONFEX
 

Handouts how to use microsoft access to combine cost and usage data for ejournals

  • 1. Step by step : How to use Microsoft Access to combine cost and usage data for ejournals Scenario: A library has the cost for each subscribed ejournal, drawn from its ILS reporting system, and exported into Excel and wants to combine this cost information with the usage data available as Counter JR1 report, to obtain a cost per download report. Step 1: Create and export a list of ejournal orders from the library’s ILS or vendor system into an Excel spreadsheet. For example, create an Excel spreadsheet of economics ejournal subscription orders. It is important that this report is as complete and “clean” as possible. Since the ISSN will be the data element used as a matchpoint with the SQL Access query, it is important that the ISSN number is formatted consistently as NNNN-NNNN. Step by Step Access reports/ Teresa Negrucci, Resource Acq. & Mgmt. Librarian ([email protected]) Page Page 1
  • 2. Step 2: Download the Counter Journal Report 1 for the year, either from the publishers’ web site, or through a third-party usage consolidation service, and export into an Excel spreadsheet. Step by Step Access reports/ Teresa Negrucci, Resource Acq. & Mgmt. Librarian ([email protected]) Page Page 2
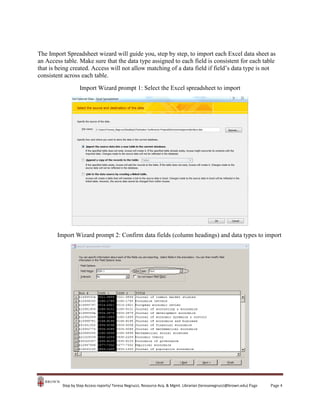
  • 3. Step 3: Import the Excel spreadsheets into Access as tables. In Microsoft Access, open a new database, then click on the External data tab, and then the import from Excel icon. In the “Select the source and destination of the data” dialog box, click on the “import the source data into a new table in the current database” option and use the browse button to locate the Excel spreadsheet. Open a new database in Microsoft Access Import each Excel spreadsheet into Access as tables Step by Step Access reports/ Teresa Negrucci, Resource Acq. & Mgmt. Librarian ([email protected]) Page Page 3
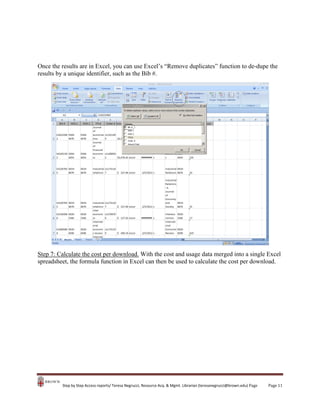
  • 4. The Import Spreadsheet wizard will guide you, step by step, to import each Excel data sheet as an Access table. Make sure that the data type assigned to each field is consistent for each table that is being created. Access will not allow matching of a data field if field’s data type is not consistent across each table. Import Wizard prompt 1: Select the Excel spreadsheet to import Import Wizard prompt 2: Confirm data fields (column headings) and data types to import Step by Step Access reports/ Teresa Negrucci, Resource Acq. & Mgmt. Librarian ([email protected]) Page Page 4
  • 5. Import Wizard prompt 3: No primary key is needed Import Wizard prompt 4: Name the table and click “finish” to import the data as a table Step by Step Access reports/ Teresa Negrucci, Resource Acq. & Mgmt. Librarian ([email protected]) Page Page 5
  • 6. Step 4: Use the Query Design tool to create the SQL query in Access. Once each spreadsheet is loaded as a table, click on the create tab, then the query design icon. Note that each of the spreadsheets is now an Access table (left column of the screen). Highlight and click each of the tables in the “show table” dialog box, and click “add.” This will add each of the tables into the query display box. Step by Step Access reports/ Teresa Negrucci, Resource Acq. & Mgmt. Librarian ([email protected]) Page Page 6
  • 7. The SQL query display box, with the two tables and their data fields in the query design area at the top of the screen, and the query output box at the bottom of the screen. By highlighting the data element in one table then dragging the cursor to the same data element (for example, the ISSN) in the other table, Access will create a connection line (the join) resulting in a SQL query that matches the data element in each table. The actual SQL query, which can be viewed by changing the view button to SQL view, is: SELECT FROM [Journal_Holdings_Report_(JR1)] INNER JOIN [Economic ejournal orders] ON [Journal_Holdings_Report_(JR1)].ISSN = [Economic ejournal orders].[ISSN 1]; However, by staying in design view, you have a visual display of the query. Step by Step Access reports/ Teresa Negrucci, Resource Acq. & Mgmt. Librarian ([email protected]) Page Page 7
  • 8. As a final step of creating the SQL query, you will need to add the output fields to the query output box (bottom part of screen). Simply highlight the asterisk * in each of the tables, and drag the asterisk to the query output box. This adds each of the data fields from each of the tables to the results of the query. Step by Step Access reports/ Teresa Negrucci, Resource Acq. & Mgmt. Librarian ([email protected]) Page Page 8
  • 9. Step 5: Run the query and view the results. Click the save icon, and name the query. Then click the run icon to run the query. Step by Step Access reports/ Teresa Negrucci, Resource Acq. & Mgmt. Librarian ([email protected]) Page Page 9
  • 10. Step 6: Export the query results into Excel. The results of the query, which combines the data from the two tables, will appear in the main screen, or by clicking view icon , for the data sheet view. These title results can then be cut and pasted (up to 65,000 records at a time) into Excel. In this example, the ISSN 1 from the economic ejournal order tables matched to the ISSN from the Counter JR1 report. An additional query can be run, using the ISSN 2 from the economic ejournal order tables matched to the ISSN from the Counter JR1 report, and the results exported into Excel. Step by Step Access reports/ Teresa Negrucci, Resource Acq. & Mgmt. Librarian ([email protected]) Page Page 10
  • 11. Once the results are in Excel, you can use Excel’s “Remove duplicates” function to de-dupe the results by a unique identifier, such as the Bib #. Step 7: Calculate the cost per download. With the cost and usage data merged into a single Excel spreadsheet, the formula function in Excel can then be used to calculate the cost per download. Step by Step Access reports/ Teresa Negrucci, Resource Acq. & Mgmt. Librarian ([email protected]) Page Page 11