SlideShare a Scribd company logo
19/11/2020
How IBM's Massive
POWER9 UNIX
Servers Benefit from
InfluxDB and Grafana
Technology
Nigel Griffiths Advanced Technology, IBM, UK
- These are my personal opinions -
IBM email: nag@uk.ibm.com
Open Source: nigelargriffiths@hotmail.com
@mr_nmon twitter
http://tinyurl.com/njmon - njmon sourceforge project
http://tinyurl.com/AIXpert - My 135 Blog
https://www.youtube.com/user/nigelargriffiths - 215
Grafana LabsInfluxdata
300,000++ people are IBMers
Benchmark Centres, Demonstrations, Services people, Cloud Offerings
Very roughly
• 1/3rd Software
• 1/3rd Services
• (technical + business)
• 1/3rd Hardware (Systems)
• (servers + storage)
One chart on
1
2
19/11/2020
1/3rd Hardware (Systems)
• (servers + storage)
• POWER (IBM chip POWER9)
• OS: Linux, AIX (UNIX), IBM i
• 192 CPU cores, 1536 HW threads
• 64 TB memory, 64 adapters
• Z (mainframe, IBM chip z15)
• OS: z/OS, LinuxONE for Linux
• Storage
• FlashSystem, SAN, NVMe, . . .
Second chart on
POWER9 Servers Enterprise
E950
E980
S922
S924
Scale-Out
Midrange
2U or 4U
1 or 2 socket
SMT=8
4 to 24 CPU cores
4 TB RAM
4U
4 socket
SMT=8
16 to 48 CPU cores
16 TB RAM
7U to 22U
16 socket
SMT=8
192 CPU cores
(1536 programs running
at the same time)
64 TB RAM
3
4
19/11/2020
My claim to fame?
Started 25 years ago
nmon  Nigel’s Monitor
OS performance data
On screen or CSV file
Various graphing tool
For AIX and Linux (any HW)
nmon for AIX now part of AIX
nmon for Linux open source
1,040,108+ downloads (today)
My claim to fame?
Started 25 years ago
nmon  Nigel’s Monitor
OS performance data
On screen or CSV file
Various graphing tool
For AIX and Linux (any HW)
nmon for AIX now part of AIX
nmon for Linux open source
1,040,108+ downloads (today)
Things have changed
since starting nmon
- CPUs x 200,000 faster
- RAM x 1 million larger
- Network x 10,000 rate
- Disks, SSD & NVMe
- x 500,000 larger
- x 10,000 faster
- nmon file format
= quirky & !standard
5
6
19/11/2020
In 2018:
What would I do differently?
Every possible statistic
Standard format [not .csv]
Central database [not local files]
Live graphs
In 2018:
What would I do differently?
7
8
19/11/2020
Every possible statistic DONE
Standard format: JSON + LP
Central database: InfluxDB
Live graphs: Grafana
In 2018:
What would I do differently?
Every possible statistic DONE
Standard format: JSON + LP
Central database: InfluxDB
Live graphs: Grafana
JSON  elastic & Splunk
LP  telegraf  Prometheus
In 2018:
What would I do differently?
9
10
19/11/2020
In 2020:
njmon = JSON output to
njmond.py central daemon
nimon = InfluxDB Line Protocol
direct to InfluxDB
What to know more?
http://nmon.sourceforge.net/njmon
In 2020:
Improved handling of JSON data
Continues as JSON popular
useful format, especially Python
But added:
InfluxDB Line Protocol for direct
nimon agent to remote InfluxDB
Wow!!
Every release is like Xmas
 we get new toys (graphs)
- Even a webpage with samples
Lets talk about
Grafana!
11
12
19/11/2020
1
2
3
1. My logo = cool
2. Donut graph, yum
3. Dark mode: Helps you sleep at the desk!
4. LED graphic equaliser: draws attention to red stats
5. Button single stat and graph: high density
6. Blue Ridge Mountain range graph
7. Carpet graph – see later
4
5
6
Lets talk about
Grafana!
Open Source from IBMers
So AIX benefits from the latest Time-Series database
& graph engines from Nigel “Mr nmon” Griffiths
Stats:
CPU
RAM
Disks
Paging
Volume Groups
Logical Volumes
Networks
Adapters
Kernel stats
Tapes
Uptime
User count
AIO
File systems
System Calls
Processes
NFS
GPFS Spectrum Scale
VIOS virtual disks
VIOS SEA
VIOS virtual networks
VIOS SSP
Linux NVIDIA GPUs
AIX rPerf
Recent updates:
- New faster centralized collector
- New direct to InfluxDB = nimon
- New YouTube videos for Sys Admins
- New Grafana graph templates
See https://tinyurl.com/njmon
Very simple endpoint install
InfluxDB and Grafana install in 10 minutes
Grafana starter dashboards but prime value
is creating any graph you want in seconds
JSON output for Elastic (ELK) & Splunk
Line Protocol for InfluxDB & Prometheus
End-points
with njmon
13
14
19/11/2020
Grafana
njmond.py
JSON
njmon -e
Python
Client
Python
Client
beats
PrometheusTelegraf
Direct
Direct
JSON
New
New
InfluxDB
InfluxDB
n[ji]mon
Time-Series
Infrastructure
njmon -w
JSON
JSON
JSON
Line Protocol
Line Protocol
Boot Strap
+
InfluxDB Grafana
Both offer a Cloud Service
- Pay you bill & they run it
- Remote access to save data
- Remote access for graphing
Both in-house Enterprise
- You buy and run on your kit
- Get extra features
- Get full support
Both offer Open Source
- Free access to the code
- Free downloads pre-compiled
- For Linux – AMD64, ARM
- Also MacOS and Windows!
Both available on POWER8 +
POWER9 on Linux (RHEL &
SUSE) & AIX via our friends at
https://power-devops.com
15
16
19/11/2020
Boot Strap
+
InfluxDB Grafana
1
Install is very quick
1 minute download
6 minute install
3 minute setup + firewall + start up
Just take the defaults
Influx CLI: create database njmon
Boot Strap
+
InfluxDB Grafana
VIOS 2.2.6
VIOS 3.1.0
AIX 6.1
AIX 7.1
AIX 7.2
Ubuntu 18/20
SLES 12/15
RHEL 7/8
Each end-point needs an agent
- Single small binary + manual pages
- “ninstall” script
1
2
Install is very quick
1 minute download
6 minute install
3 minute setup + firewall + start up
Just take the defaults
Influx CLI: create database njmon
17
18
19/11/2020
Boot Strap
+
InfluxDB Grafana
VIOS 2.2.6
VIOS 3.1.0
AIX 6.1
AIX 7.1
AIX 7.2
Ubuntu 18/20
SLES 12/15
RHEL 7/8
Each end-point needs an agent
- Single small binary + manual pages
- “ninstall” script
Each end-point: add a crontab entry
0 * * * * /usr/lbin/nimon -c 60 -k -i influx -p 8086
1
2
3
Install is very quick
1 minute download
6 minute install
3 minute setup + firewall + start up
Just take the defaults
Influx CLI: create database njmon
Boot Strap
+
InfluxDB Grafana
VIOS 2.2.6
VIOS 3.1.0
AIX 6.1
AIX 7.1
AIX 7.2
Ubuntu 18/20
SLES 12/15
RHEL 7/8
Each end-point needs an agent
- Single small binary + manual pages
- “ninstall” script
Each end-point: add a crontab entry
0 * * * * /usr/lbin/nimon -c 60 -k -i influx -p 8086
Access Grafana via a browser
Settings: add influx/njmon datasource
From https://grafana.com/dashboards
Import njmon AIX & Linux dashboards
Enjoy
1
2
3
4
Install is very quick
1 minute download
6 minute install
3 minute setup + firewall + start up
Just take the defaults
Influx CLI: create database njmon
19
20
19/11/2020
Any one heard of the
Dolly Parton curve?
Any one heard of the
Dolly Parton curve?
TIME
CPUBUSY
PMPMAM
Lunch
AM
AfternoonMorning Batch
100%
21
22
19/11/2020
Any one heard of the
Dolly Parton curve?
Three Crunch points
TIME
CPUBUSY
PMPMAM
Lunch
AM
AfternoonMorning Batch
100%
Any one heard of the
Dolly Parton curve?
Three Crunch points
TIME
CPUBUSY
PMPMAM
Lunch
AM
AfternoonMorning Batch
100%
Problems:
Averaging the whole day hides the three crunch points
Periodic over a day and over a week (typical busier on Friday)
Periodic over a month (end of month extra reporting) and end of year!
Batch overrun times
23
24
19/11/2020
Heat map for whole days using the Grafana Carpet Plugin
This is a excellent way to determining the busy day + busy hours = first step for trend forecasting
WeekWeekWeek
Heat map for whole days using the Grafana Carpet Plugin
This is a excellent way to determining the busy day + busy hours = first step for trend forecasting
Heat Map Warning: There are always red parts!
WeekWeekWeek
Interesting Peaks 8 to 10
am & 2 pm
Tuesday to Friday
Busy day is Thursday
25
26
19/11/2020
My to do list:
Work out how to graph CPU on
successive Fridays 8 am to 10 pm
Batch overrun can be handled
with alerts but still need trending
Ideas to nag@uk.ibm.com
Could be done in:
InfluxDB “flux” or
Grafana Alerts
Some ideas
Fri Fri Fri Fri Friday
(1) Remove the weeds
(2) One graph with overlay
selected time periods
(3)
27
28
19/11/2020
Two recent ideas:
1. Not easy to document
measures & statistics names!
[Tried to find out how many stats from Linux statd?]
2. Capturing ad-hoc stats on Big
Production Servers
Answers: AIXpert Blog
29
30
19/11/2020
Grafana
| CPU
| Memory
| Disks
| Network
| Kernel
| Processes
InfluxDB
Measure for AIX and Linux
Saving other statistics to the same njmon database.
If you can get the data via a script, you can send it
on with the same njmon tags in 1/100th of a second.
Then graph OS stats & your stats at the same time.
Measure Statistics
RDBMS script:
measure* -g rdbms -G commits=986.34,rollbacks=23.1,hitratio=99.3
Sales script:
measure* -g sales -G itemsold=32984,avgcost=79.99,profit=-0.003
Users script:
measure* -g user -G online=65389,online_mins=184,click_pm=18.2
IT-tasks times script:
measure* -g tasks -G dataload=47_min,backupmin=124,batch_min=84
* Also need InfluxDB: hostname + port & Influx-DB-name
Pi Returning temp of Zero
Pi fell off Network
Effect of outside air
temperature rising to 32C
Raspberry Pi 3
MicroSD card
With five
temperature
probes
31
32
19/11/2020
njmon Graphing LAB
+ InfluxDB & Grafana 7.1
- Wednesday
Nigel GriffithsTechnical Staff Member
nag@uk.ibm.com
@mr_nmon & on LinkedIn
https://www.youtube.com/nigelargriffiths
http://tinyurl.com/AIXpert
Cloud VM’s for AIX provided by
IBM TechU
Oct 2020 | Virtual
YouTube:- https://youtu.be/XKs5dKGuFe8
If you want to
know more . . .
Project Website
https://tinyurl.com/njmon
AIXpert Blog Articles
https://www.ibm.com/support
/pages/aixpert-blog-nigel-
griffiths-mrnmon
YouTube Videos
- Details on the Next slide
AIX Performance
Tuning Lab
Monitoring Students
33
34
19/11/2020
https://www.youtube.com/user/nigelargriffiths
https://www.youtube.com/watch?v=wN5GNc9HH7Y&list=PLKQlFnmiWVydb5QdX2wz9iRfJkuuB2ec1
13 videos
~16,000 Views
up to Oct 2020
~3 hours
Now a 13 part YouTube playlist
njmon + InfluxDB + Grafana
for monitoring AIX & Linux
Performance data
Summary:
nmon not going away
• On screen or data capture
• Stable down stream infrastructure
• Very popular & part of AIX
njmon for new age online tooling
• Lightweight single binary agent coded in C
• Loads more stats
• Real-time, data stream, flexible
• Python’s JSON parser = fast and cool
• Or direct to InfluxDB
• AIX vast array of perfstat stats + VIOS stats
• Linux nmon & njmon code synergy
• 100’s of new stats including GPU & GPFS
email nigelargriffiths@hotmail.com
Questions
https://tinyurl.com/njmon
https://www.linkedin.com/in/nigel-griffiths
35
36
19/11/2020
37
38
19/11/2020
39
40
19/11/2020
41

More Related Content

What's hot (20)

PPTX
Netflix viewing data architecture evolution - QCon 2014
Philip Fisher-Ogden
 
PPT
AIXpert - AIX Security expert
dlfrench
 
PPT
Daos
Ulrich Krause
 
PDF
SQLd360
Mauro Pagano
 
PDF
Hands-on DNSSEC Deployment
Bangladesh Network Operators Group
 
PPTX
re:Invent 2022 DAT326 Deep dive into Amazon Aurora and its innovations
Grant McAlister
 
PDF
Cloud DW technology trends and considerations for enterprises to apply snowflake
SANG WON PARK
 
PDF
AWS LambdaとDynamoDBがこんなにツライはずがない #ssmjp
Masahiro NAKAYAMA
 
PPTX
IBM Spectrum Scale Authentication For Object - Deep Dive
Smita Raut
 
PDF
Ansible
Kamil Lelonek
 
PPTX
Ibm spectrum scale fundamentals workshop for americas part 5 ess gnr-usecases...
xKinAnx
 
PDF
Amazon QLDB를 통한 원장 기반 운전 면허 검증 서비스 구현 - 윤석찬 :: AWS Unboxing 온라인 세미나
Amazon Web Services Korea
 
PDF
Configuration Management in Ansible
Bangladesh Network Operators Group
 
PPTX
10 Tips for AIX Security
HelpSystems
 
PDF
Nové vlastnosti Oracle Database Appliance
MarketingArrowECS_CZ
 
PPTX
Achieving High Availability in PostgreSQL
Mydbops
 
PPTX
INF107 - Integrating HCL Domino and Microsoft 365
Dylan Redfield
 
PPTX
Apache Kafka at LinkedIn
Discover Pinterest
 
PPTX
Autoscaling Flink with Reactive Mode
Flink Forward
 
PDF
AWS Kubernetes 서비스 자세히 살펴보기 (정영준 & 이창수, AWS 솔루션즈 아키텍트) :: AWS DevDay2018
Amazon Web Services Korea
 
Netflix viewing data architecture evolution - QCon 2014
Philip Fisher-Ogden
 
AIXpert - AIX Security expert
dlfrench
 
SQLd360
Mauro Pagano
 
Hands-on DNSSEC Deployment
Bangladesh Network Operators Group
 
re:Invent 2022 DAT326 Deep dive into Amazon Aurora and its innovations
Grant McAlister
 
Cloud DW technology trends and considerations for enterprises to apply snowflake
SANG WON PARK
 
AWS LambdaとDynamoDBがこんなにツライはずがない #ssmjp
Masahiro NAKAYAMA
 
IBM Spectrum Scale Authentication For Object - Deep Dive
Smita Raut
 
Ansible
Kamil Lelonek
 
Ibm spectrum scale fundamentals workshop for americas part 5 ess gnr-usecases...
xKinAnx
 
Amazon QLDB를 통한 원장 기반 운전 면허 검증 서비스 구현 - 윤석찬 :: AWS Unboxing 온라인 세미나
Amazon Web Services Korea
 
Configuration Management in Ansible
Bangladesh Network Operators Group
 
10 Tips for AIX Security
HelpSystems
 
Nové vlastnosti Oracle Database Appliance
MarketingArrowECS_CZ
 
Achieving High Availability in PostgreSQL
Mydbops
 
INF107 - Integrating HCL Domino and Microsoft 365
Dylan Redfield
 
Apache Kafka at LinkedIn
Discover Pinterest
 
Autoscaling Flink with Reactive Mode
Flink Forward
 
AWS Kubernetes 서비스 자세히 살펴보기 (정영준 & 이창수, AWS 솔루션즈 아키텍트) :: AWS DevDay2018
Amazon Web Services Korea
 

Similar to How IBM's Massive POWER9 UNIX Servers Benefit from InfluxDB and Grafana Technology (20)

PPTX
Discover How IBM Uses InfluxDB and Grafana to Help Clients Monitor Large Prod...
InfluxData
 
PDF
Getting started with influx Db and Grafana Installation Guide
Soumil Shahsoumil
 
PDF
Timeseries - data visualization in Grafana
OCoderFest
 
PDF
Beautiful Monitoring With Grafana and InfluxDB
leesjensen
 
PPTX
InfluxDb and Grafana fighting with data
Ivan Vaskevych
 
PDF
Why Open Source Works for DevOps Monitoring
DevOps.com
 
PDF
Flux QL - Nexgen Management of Time Series Inspired by JS
Ivo Andreev
 
PPTX
CCI2019 - Monitorare SQL Server Senza Andare in Bancarotta
walk2talk srl
 
PDF
Intro to InfluxDB
InfluxData
 
PDF
How the Automation of a Benchmark Famework Keeps Pace with the Dev Cycle at I...
DevOps.com
 
PDF
Virtual training intro to InfluxDB - June 2021
InfluxData
 
PDF
[4DEV][Łódź] Ivan Vaskevych - InfluxDB and Grafana fighting together with IoT...
PROIDEA
 
PPTX
How Texas Instruments Uses InfluxDB to Uphold Product Standards and to Improv...
InfluxData
 
PPTX
Paul Dix [InfluxData] | InfluxDays Keynote: Future of InfluxDB | InfluxDays N...
InfluxData
 
PPTX
Why You Should NOT Be Using an RDBS for Time-stamped Data
DevOps.com
 
PPTX
Why You Should NOT Be Using an RDBMS for Time-stamped Data
DevOps.com
 
PDF
Devoxx france 2015 influx db
Nicolas Muller
 
PDF
Devoxx france 2015 influxdb
Nicolas Muller
 
PDF
Intro to Time Series
InfluxData
 
Discover How IBM Uses InfluxDB and Grafana to Help Clients Monitor Large Prod...
InfluxData
 
Getting started with influx Db and Grafana Installation Guide
Soumil Shahsoumil
 
Timeseries - data visualization in Grafana
OCoderFest
 
Beautiful Monitoring With Grafana and InfluxDB
leesjensen
 
InfluxDb and Grafana fighting with data
Ivan Vaskevych
 
Why Open Source Works for DevOps Monitoring
DevOps.com
 
Flux QL - Nexgen Management of Time Series Inspired by JS
Ivo Andreev
 
CCI2019 - Monitorare SQL Server Senza Andare in Bancarotta
walk2talk srl
 
Intro to InfluxDB
InfluxData
 
How the Automation of a Benchmark Famework Keeps Pace with the Dev Cycle at I...
DevOps.com
 
Virtual training intro to InfluxDB - June 2021
InfluxData
 
[4DEV][Łódź] Ivan Vaskevych - InfluxDB and Grafana fighting together with IoT...
PROIDEA
 
How Texas Instruments Uses InfluxDB to Uphold Product Standards and to Improv...
InfluxData
 
Paul Dix [InfluxData] | InfluxDays Keynote: Future of InfluxDB | InfluxDays N...
InfluxData
 
Why You Should NOT Be Using an RDBS for Time-stamped Data
DevOps.com
 
Why You Should NOT Be Using an RDBMS for Time-stamped Data
DevOps.com
 
Devoxx france 2015 influx db
Nicolas Muller
 
Devoxx france 2015 influxdb
Nicolas Muller
 
Intro to Time Series
InfluxData
 
Ad

More from DevOps.com (20)

PDF
Modernizing on IBM Z Made Easier With Open Source Software
DevOps.com
 
PPTX
Comparing Microsoft SQL Server 2019 Performance Across Various Kubernetes Pla...
DevOps.com
 
PPTX
Comparing Microsoft SQL Server 2019 Performance Across Various Kubernetes Pla...
DevOps.com
 
PDF
Next Generation Vulnerability Assessment Using Datadog and Snyk
DevOps.com
 
PPTX
Vulnerability Discovery in the Cloud
DevOps.com
 
PDF
2021 Open Source Governance: Top Ten Trends and Predictions
DevOps.com
 
PDF
A New Year’s Ransomware Resolution
DevOps.com
 
PPTX
Getting Started with Runtime Security on Azure Kubernetes Service (AKS)
DevOps.com
 
PDF
Don't Panic! Effective Incident Response
DevOps.com
 
PDF
Creating a Culture of Chaos: Chaos Engineering Is Not Just Tools, It's Culture
DevOps.com
 
PDF
Role Based Access Controls (RBAC) for SSH and Kubernetes Access with Teleport
DevOps.com
 
PDF
Monitoring Serverless Applications with Datadog
DevOps.com
 
PDF
Deliver your App Anywhere … Publicly or Privately
DevOps.com
 
PPTX
Securing medical apps in the age of covid final
DevOps.com
 
PDF
How to Build a Healthy On-Call Culture
DevOps.com
 
PPTX
The Evolving Role of the Developer in 2021
DevOps.com
 
PDF
Service Mesh: Two Big Words But Do You Need It?
DevOps.com
 
PPTX
Secure Data Sharing in OpenShift Environments
DevOps.com
 
PPTX
How to Govern Identities and Access in Cloud Infrastructure: AppsFlyer Case S...
DevOps.com
 
PDF
Elevate Your Enterprise Python and R AI, ML Software Strategy with Anaconda T...
DevOps.com
 
Modernizing on IBM Z Made Easier With Open Source Software
DevOps.com
 
Comparing Microsoft SQL Server 2019 Performance Across Various Kubernetes Pla...
DevOps.com
 
Comparing Microsoft SQL Server 2019 Performance Across Various Kubernetes Pla...
DevOps.com
 
Next Generation Vulnerability Assessment Using Datadog and Snyk
DevOps.com
 
Vulnerability Discovery in the Cloud
DevOps.com
 
2021 Open Source Governance: Top Ten Trends and Predictions
DevOps.com
 
A New Year’s Ransomware Resolution
DevOps.com
 
Getting Started with Runtime Security on Azure Kubernetes Service (AKS)
DevOps.com
 
Don't Panic! Effective Incident Response
DevOps.com
 
Creating a Culture of Chaos: Chaos Engineering Is Not Just Tools, It's Culture
DevOps.com
 
Role Based Access Controls (RBAC) for SSH and Kubernetes Access with Teleport
DevOps.com
 
Monitoring Serverless Applications with Datadog
DevOps.com
 
Deliver your App Anywhere … Publicly or Privately
DevOps.com
 
Securing medical apps in the age of covid final
DevOps.com
 
How to Build a Healthy On-Call Culture
DevOps.com
 
The Evolving Role of the Developer in 2021
DevOps.com
 
Service Mesh: Two Big Words But Do You Need It?
DevOps.com
 
Secure Data Sharing in OpenShift Environments
DevOps.com
 
How to Govern Identities and Access in Cloud Infrastructure: AppsFlyer Case S...
DevOps.com
 
Elevate Your Enterprise Python and R AI, ML Software Strategy with Anaconda T...
DevOps.com
 
Ad

Recently uploaded (20)

PDF
UiPath DevConnect 2025: Agentic Automation Community User Group Meeting
DianaGray10
 
PDF
“Voice Interfaces on a Budget: Building Real-time Speech Recognition on Low-c...
Edge AI and Vision Alliance
 
PDF
Kit-Works Team Study_20250627_한달만에만든사내서비스키링(양다윗).pdf
Wonjun Hwang
 
PDF
NASA A Researcher’s Guide to International Space Station : Physical Sciences ...
Dr. PANKAJ DHUSSA
 
PPTX
From Sci-Fi to Reality: Exploring AI Evolution
Svetlana Meissner
 
DOCX
Python coding for beginners !! Start now!#
Rajni Bhardwaj Grover
 
PPTX
Agentforce World Tour Toronto '25 - MCP with MuleSoft
Alexandra N. Martinez
 
PDF
Book industry state of the nation 2025 - Tech Forum 2025
BookNet Canada
 
DOCX
Cryptography Quiz: test your knowledge of this important security concept.
Rajni Bhardwaj Grover
 
PDF
Staying Human in a Machine- Accelerated World
Catalin Jora
 
PDF
Mastering Financial Management in Direct Selling
Epixel MLM Software
 
PPTX
The Project Compass - GDG on Campus MSIT
dscmsitkol
 
PDF
“NPU IP Hardware Shaped Through Software and Use-case Analysis,” a Presentati...
Edge AI and Vision Alliance
 
PPT
Ericsson LTE presentation SEMINAR 2010.ppt
npat3
 
PDF
[Newgen] NewgenONE Marvin Brochure 1.pdf
darshakparmar
 
PDF
The 2025 InfraRed Report - Redpoint Ventures
Razin Mustafiz
 
PDF
Agentic AI lifecycle for Enterprise Hyper-Automation
Debmalya Biswas
 
PDF
Peak of Data & AI Encore AI-Enhanced Workflows for the Real World
Safe Software
 
PDF
Newgen Beyond Frankenstein_Build vs Buy_Digital_version.pdf
darshakparmar
 
PDF
Automating Feature Enrichment and Station Creation in Natural Gas Utility Net...
Safe Software
 
UiPath DevConnect 2025: Agentic Automation Community User Group Meeting
DianaGray10
 
“Voice Interfaces on a Budget: Building Real-time Speech Recognition on Low-c...
Edge AI and Vision Alliance
 
Kit-Works Team Study_20250627_한달만에만든사내서비스키링(양다윗).pdf
Wonjun Hwang
 
NASA A Researcher’s Guide to International Space Station : Physical Sciences ...
Dr. PANKAJ DHUSSA
 
From Sci-Fi to Reality: Exploring AI Evolution
Svetlana Meissner
 
Python coding for beginners !! Start now!#
Rajni Bhardwaj Grover
 
Agentforce World Tour Toronto '25 - MCP with MuleSoft
Alexandra N. Martinez
 
Book industry state of the nation 2025 - Tech Forum 2025
BookNet Canada
 
Cryptography Quiz: test your knowledge of this important security concept.
Rajni Bhardwaj Grover
 
Staying Human in a Machine- Accelerated World
Catalin Jora
 
Mastering Financial Management in Direct Selling
Epixel MLM Software
 
The Project Compass - GDG on Campus MSIT
dscmsitkol
 
“NPU IP Hardware Shaped Through Software and Use-case Analysis,” a Presentati...
Edge AI and Vision Alliance
 
Ericsson LTE presentation SEMINAR 2010.ppt
npat3
 
[Newgen] NewgenONE Marvin Brochure 1.pdf
darshakparmar
 
The 2025 InfraRed Report - Redpoint Ventures
Razin Mustafiz
 
Agentic AI lifecycle for Enterprise Hyper-Automation
Debmalya Biswas
 
Peak of Data & AI Encore AI-Enhanced Workflows for the Real World
Safe Software
 
Newgen Beyond Frankenstein_Build vs Buy_Digital_version.pdf
darshakparmar
 
Automating Feature Enrichment and Station Creation in Natural Gas Utility Net...
Safe Software
 

How IBM's Massive POWER9 UNIX Servers Benefit from InfluxDB and Grafana Technology

  • 1. 19/11/2020 How IBM's Massive POWER9 UNIX Servers Benefit from InfluxDB and Grafana Technology Nigel Griffiths Advanced Technology, IBM, UK - These are my personal opinions - IBM email: [email protected] Open Source: [email protected] @mr_nmon twitter http://tinyurl.com/njmon - njmon sourceforge project http://tinyurl.com/AIXpert - My 135 Blog https://www.youtube.com/user/nigelargriffiths - 215 Grafana LabsInfluxdata 300,000++ people are IBMers Benchmark Centres, Demonstrations, Services people, Cloud Offerings Very roughly • 1/3rd Software • 1/3rd Services • (technical + business) • 1/3rd Hardware (Systems) • (servers + storage) One chart on 1 2
  • 2. 19/11/2020 1/3rd Hardware (Systems) • (servers + storage) • POWER (IBM chip POWER9) • OS: Linux, AIX (UNIX), IBM i • 192 CPU cores, 1536 HW threads • 64 TB memory, 64 adapters • Z (mainframe, IBM chip z15) • OS: z/OS, LinuxONE for Linux • Storage • FlashSystem, SAN, NVMe, . . . Second chart on POWER9 Servers Enterprise E950 E980 S922 S924 Scale-Out Midrange 2U or 4U 1 or 2 socket SMT=8 4 to 24 CPU cores 4 TB RAM 4U 4 socket SMT=8 16 to 48 CPU cores 16 TB RAM 7U to 22U 16 socket SMT=8 192 CPU cores (1536 programs running at the same time) 64 TB RAM 3 4
  • 3. 19/11/2020 My claim to fame? Started 25 years ago nmon  Nigel’s Monitor OS performance data On screen or CSV file Various graphing tool For AIX and Linux (any HW) nmon for AIX now part of AIX nmon for Linux open source 1,040,108+ downloads (today) My claim to fame? Started 25 years ago nmon  Nigel’s Monitor OS performance data On screen or CSV file Various graphing tool For AIX and Linux (any HW) nmon for AIX now part of AIX nmon for Linux open source 1,040,108+ downloads (today) Things have changed since starting nmon - CPUs x 200,000 faster - RAM x 1 million larger - Network x 10,000 rate - Disks, SSD & NVMe - x 500,000 larger - x 10,000 faster - nmon file format = quirky & !standard 5 6
  • 4. 19/11/2020 In 2018: What would I do differently? Every possible statistic Standard format [not .csv] Central database [not local files] Live graphs In 2018: What would I do differently? 7 8
  • 5. 19/11/2020 Every possible statistic DONE Standard format: JSON + LP Central database: InfluxDB Live graphs: Grafana In 2018: What would I do differently? Every possible statistic DONE Standard format: JSON + LP Central database: InfluxDB Live graphs: Grafana JSON  elastic & Splunk LP  telegraf  Prometheus In 2018: What would I do differently? 9 10
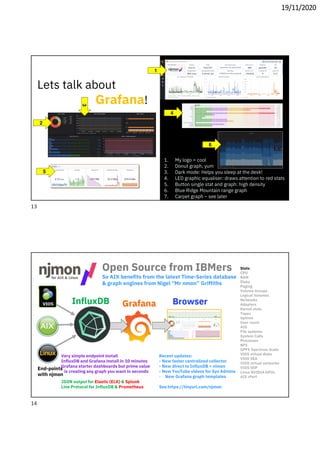
  • 6. 19/11/2020 In 2020: njmon = JSON output to njmond.py central daemon nimon = InfluxDB Line Protocol direct to InfluxDB What to know more? http://nmon.sourceforge.net/njmon In 2020: Improved handling of JSON data Continues as JSON popular useful format, especially Python But added: InfluxDB Line Protocol for direct nimon agent to remote InfluxDB Wow!! Every release is like Xmas  we get new toys (graphs) - Even a webpage with samples Lets talk about Grafana! 11 12
  • 7. 19/11/2020 1 2 3 1. My logo = cool 2. Donut graph, yum 3. Dark mode: Helps you sleep at the desk! 4. LED graphic equaliser: draws attention to red stats 5. Button single stat and graph: high density 6. Blue Ridge Mountain range graph 7. Carpet graph – see later 4 5 6 Lets talk about Grafana! Open Source from IBMers So AIX benefits from the latest Time-Series database & graph engines from Nigel “Mr nmon” Griffiths Stats: CPU RAM Disks Paging Volume Groups Logical Volumes Networks Adapters Kernel stats Tapes Uptime User count AIO File systems System Calls Processes NFS GPFS Spectrum Scale VIOS virtual disks VIOS SEA VIOS virtual networks VIOS SSP Linux NVIDIA GPUs AIX rPerf Recent updates: - New faster centralized collector - New direct to InfluxDB = nimon - New YouTube videos for Sys Admins - New Grafana graph templates See https://tinyurl.com/njmon Very simple endpoint install InfluxDB and Grafana install in 10 minutes Grafana starter dashboards but prime value is creating any graph you want in seconds JSON output for Elastic (ELK) & Splunk Line Protocol for InfluxDB & Prometheus End-points with njmon 13 14
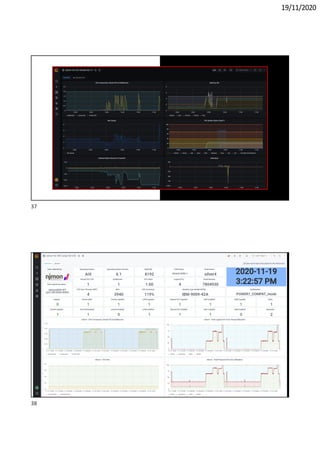
  • 8. 19/11/2020 Grafana njmond.py JSON njmon -e Python Client Python Client beats PrometheusTelegraf Direct Direct JSON New New InfluxDB InfluxDB n[ji]mon Time-Series Infrastructure njmon -w JSON JSON JSON Line Protocol Line Protocol Boot Strap + InfluxDB Grafana Both offer a Cloud Service - Pay you bill & they run it - Remote access to save data - Remote access for graphing Both in-house Enterprise - You buy and run on your kit - Get extra features - Get full support Both offer Open Source - Free access to the code - Free downloads pre-compiled - For Linux – AMD64, ARM - Also MacOS and Windows! Both available on POWER8 + POWER9 on Linux (RHEL & SUSE) & AIX via our friends at https://power-devops.com 15 16
  • 9. 19/11/2020 Boot Strap + InfluxDB Grafana 1 Install is very quick 1 minute download 6 minute install 3 minute setup + firewall + start up Just take the defaults Influx CLI: create database njmon Boot Strap + InfluxDB Grafana VIOS 2.2.6 VIOS 3.1.0 AIX 6.1 AIX 7.1 AIX 7.2 Ubuntu 18/20 SLES 12/15 RHEL 7/8 Each end-point needs an agent - Single small binary + manual pages - “ninstall” script 1 2 Install is very quick 1 minute download 6 minute install 3 minute setup + firewall + start up Just take the defaults Influx CLI: create database njmon 17 18
  • 10. 19/11/2020 Boot Strap + InfluxDB Grafana VIOS 2.2.6 VIOS 3.1.0 AIX 6.1 AIX 7.1 AIX 7.2 Ubuntu 18/20 SLES 12/15 RHEL 7/8 Each end-point needs an agent - Single small binary + manual pages - “ninstall” script Each end-point: add a crontab entry 0 * * * * /usr/lbin/nimon -c 60 -k -i influx -p 8086 1 2 3 Install is very quick 1 minute download 6 minute install 3 minute setup + firewall + start up Just take the defaults Influx CLI: create database njmon Boot Strap + InfluxDB Grafana VIOS 2.2.6 VIOS 3.1.0 AIX 6.1 AIX 7.1 AIX 7.2 Ubuntu 18/20 SLES 12/15 RHEL 7/8 Each end-point needs an agent - Single small binary + manual pages - “ninstall” script Each end-point: add a crontab entry 0 * * * * /usr/lbin/nimon -c 60 -k -i influx -p 8086 Access Grafana via a browser Settings: add influx/njmon datasource From https://grafana.com/dashboards Import njmon AIX & Linux dashboards Enjoy 1 2 3 4 Install is very quick 1 minute download 6 minute install 3 minute setup + firewall + start up Just take the defaults Influx CLI: create database njmon 19 20
  • 11. 19/11/2020 Any one heard of the Dolly Parton curve? Any one heard of the Dolly Parton curve? TIME CPUBUSY PMPMAM Lunch AM AfternoonMorning Batch 100% 21 22
  • 12. 19/11/2020 Any one heard of the Dolly Parton curve? Three Crunch points TIME CPUBUSY PMPMAM Lunch AM AfternoonMorning Batch 100% Any one heard of the Dolly Parton curve? Three Crunch points TIME CPUBUSY PMPMAM Lunch AM AfternoonMorning Batch 100% Problems: Averaging the whole day hides the three crunch points Periodic over a day and over a week (typical busier on Friday) Periodic over a month (end of month extra reporting) and end of year! Batch overrun times 23 24
  • 13. 19/11/2020 Heat map for whole days using the Grafana Carpet Plugin This is a excellent way to determining the busy day + busy hours = first step for trend forecasting WeekWeekWeek Heat map for whole days using the Grafana Carpet Plugin This is a excellent way to determining the busy day + busy hours = first step for trend forecasting Heat Map Warning: There are always red parts! WeekWeekWeek Interesting Peaks 8 to 10 am & 2 pm Tuesday to Friday Busy day is Thursday 25 26
  • 14. 19/11/2020 My to do list: Work out how to graph CPU on successive Fridays 8 am to 10 pm Batch overrun can be handled with alerts but still need trending Ideas to [email protected] Could be done in: InfluxDB “flux” or Grafana Alerts Some ideas Fri Fri Fri Fri Friday (1) Remove the weeds (2) One graph with overlay selected time periods (3) 27 28
  • 15. 19/11/2020 Two recent ideas: 1. Not easy to document measures & statistics names! [Tried to find out how many stats from Linux statd?] 2. Capturing ad-hoc stats on Big Production Servers Answers: AIXpert Blog 29 30
  • 16. 19/11/2020 Grafana | CPU | Memory | Disks | Network | Kernel | Processes InfluxDB Measure for AIX and Linux Saving other statistics to the same njmon database. If you can get the data via a script, you can send it on with the same njmon tags in 1/100th of a second. Then graph OS stats & your stats at the same time. Measure Statistics RDBMS script: measure* -g rdbms -G commits=986.34,rollbacks=23.1,hitratio=99.3 Sales script: measure* -g sales -G itemsold=32984,avgcost=79.99,profit=-0.003 Users script: measure* -g user -G online=65389,online_mins=184,click_pm=18.2 IT-tasks times script: measure* -g tasks -G dataload=47_min,backupmin=124,batch_min=84 * Also need InfluxDB: hostname + port & Influx-DB-name Pi Returning temp of Zero Pi fell off Network Effect of outside air temperature rising to 32C Raspberry Pi 3 MicroSD card With five temperature probes 31 32
  • 17. 19/11/2020 njmon Graphing LAB + InfluxDB & Grafana 7.1 - Wednesday Nigel GriffithsTechnical Staff Member [email protected] @mr_nmon & on LinkedIn https://www.youtube.com/nigelargriffiths http://tinyurl.com/AIXpert Cloud VM’s for AIX provided by IBM TechU Oct 2020 | Virtual YouTube:- https://youtu.be/XKs5dKGuFe8 If you want to know more . . . Project Website https://tinyurl.com/njmon AIXpert Blog Articles https://www.ibm.com/support /pages/aixpert-blog-nigel- griffiths-mrnmon YouTube Videos - Details on the Next slide AIX Performance Tuning Lab Monitoring Students 33 34
  • 18. 19/11/2020 https://www.youtube.com/user/nigelargriffiths https://www.youtube.com/watch?v=wN5GNc9HH7Y&list=PLKQlFnmiWVydb5QdX2wz9iRfJkuuB2ec1 13 videos ~16,000 Views up to Oct 2020 ~3 hours Now a 13 part YouTube playlist njmon + InfluxDB + Grafana for monitoring AIX & Linux Performance data Summary: nmon not going away • On screen or data capture • Stable down stream infrastructure • Very popular & part of AIX njmon for new age online tooling • Lightweight single binary agent coded in C • Loads more stats • Real-time, data stream, flexible • Python’s JSON parser = fast and cool • Or direct to InfluxDB • AIX vast array of perfstat stats + VIOS stats • Linux nmon & njmon code synergy • 100’s of new stats including GPU & GPFS email [email protected] Questions https://tinyurl.com/njmon https://www.linkedin.com/in/nigel-griffiths 35 36