


Ad
More Related Content
What's hot (20)
Similar to How to Improve the Observability of Apache Cassandra and Kafka applications with Prometheus and OpenTracing (20)


Ad
More from Paul Brebner (20)


Ad
Recently uploaded (20)

![Download Wondershare Filmora Crack [2025] With Latest](https://cdn.slidesharecdn.com/ss_thumbnails/neo4j-howkgsareshapingthefutureofgenerativeaiatawssummitlondonapril2024-240426125209-2d9db05d-250419-250428115407-a04afffa-thumbnail.jpg?width=560&fit=bounds)


![Get & Download Wondershare Filmora Crack Latest [2025]](https://cdn.slidesharecdn.com/ss_thumbnails/revolutionizingresidentialwi-fi-250422112639-60fb726f-250429170801-59e1b240-thumbnail.jpg?width=560&fit=bounds)


How to Improve the Observability of Apache Cassandra and Kafka applications with Prometheus and OpenTracing
- 1. How to Improve the Observability of Apache Cassandra and Kafka applications with Prometheus and OpenTracing March 27 2019 Paul Brebner Technology Evangelist instaclustr.com
- 2. As distributed applications grow more complex, dynamic, and massively scalable, “observability” becomes more critical. Observability is the practice of using metrics, monitoring and distributed tracing to understand how a system works. Observability Critical
- 3. As distributed cloud applications grow more complex, dynamic, and massively scalable, “observability” becomes more critical. Observability is the practice of using metrics, monitoring and distributed tracing to understand how a system works. And find the invisible cows Observability Critical
- 5. Open APM Land scape In this webinar we’ll explore two complementary Open Source technologies: - Prometheus for monitoring application metrics, and - OpenTracing and Jaeger for distributed tracing. We’ll discover how they improve the observability of - an Anomaly Detection application, - deployed on AWS Kubernetes, and - using Instaclustr managed Apache Cassandra and Kafka clusters.
- 6. Goal To increase the observability of this anomaly detection application Kubernetes Cluster ?
- 8. Observability Goal 1: Metrics T P S TPS TPS T i m e R o w s Anomalies Producer rate Consumer rate Anomaly checks rate Detector duration Rows returned anomaly rate
- 10. 1 2 3 Overview Prometheus for Monitoring OpenTracing for Distributed Tracing Conclusions
- 11. Monitoring with Prometheus Popular Open Source monitoring system from Soundcloud Now Cloud Native Computing Foundation (CNCF)
- 13. Prometheus Server Server responsible for service discovery, pulling metrics from monitored applications, storing metrics, and analysis of time series data
- 14. Prometheus GUI Built in simple graphing GUI, and native support for Grafana
- 15. Prometheus Optional Push gateway Alerting Optional push gateway and alerting Optional push gateway and alerting
- 16. Prometheus How does metrics capture work? Instrumentation and Agents (Exporters) - Client libraries for instrumenting applications in multiple programming languages - Java client collects JVM metrics and enables custom application metrics - Node exporter for host hardware metrics
- 17. Prometheus Data Model ■ Metrics ● Time series data ᐨ timestamp and value; name, key:value pairs ● By convention name includes ᐨ thing being monitored, logical type, and units ᐨ e.g. http_requests_total, http_duration_seconds ■ Prometheus automatically adds labels ● Job, host:port ■ Metric types (only relevant for instrumentation) ● Counter (increasing values) ● Gauge (values up and down) ● Histogram ● Summary
- 18. Target metrics Business metric (Anomaly checks/s) Diagnostic metrics T P S TPS TPS T i m e R o w s Anomalies Producer rate Consumer rate Anomaly checks rate Detector duration Rows returned anomaly rate
- 19. Steps Basic ■ Create and register Prometheus Metric types ● (e.g. Counter) for each timeseries type (e.g. throughputs) including name and units ■ Instrument the code ● e.g. increment the count, using name of the component (e.g. producer, consumer, etc) as label ■ Create HTTP server in code ■ Tell Prometheus where to scrape from (config file) ■ Run Prometheus Server ■ Browse to Prometheus server ■ View and select metrics, check that there’s data ■ Construct expression ■ Graph the expression ■ Run and configure Grafana for better graphs
- 20. Instrumentation Counter example // Use a single Counter for throughput metrics // for all stages of the pipeline // stages are distinguished by labels static final Counter pipelineCounter = Counter .build() .name(appName + "_requests_total") .help("Count of executions of pipeline stages") .labelNames("stage") .register(); . . . // After successful execution of each stage: // increment producer/consumer/detector rate count pipelineCounter.labels(“producer”).inc(); . . . pipelineCounter.labels(“consumer”).inc(); . . . pipelineCounter.labels(“detector”).inc();
- 21. Instrumentation Gauge example // A Gauge can go up and down // Used to measure the current value of some variable. // pipelineGauge will measure duration of each labelled stage static final Gauge pipelineGauge = Gauge .build() .name(appName + "_duration_seconds") .help("Gauge of stage durations in seconds") .labelNames("stage") .register(); . . . // in detector pipeline, compute duration and set long duration = nowTime – startTime; pipelineGauge.labels(”detector”).setToTime(duration);
- 22. HTTP Server For metric pulls // Metrics are pulled by Prometheus // Create an HTTP server as the endpoint to pull from // If there are multiple processes running on the same server // then you need different port numbers // Add IPs and port numbers to the Prometheus configuration // file. HTTPServer server = null; try { server = new HTTPServer(1234); } catch (IOException e) { e.printStackTrace(); }
- 23. Using Prometheus Configure Run ■ Configure Prometheus with IP and Ports to poll. ● Edit the default Prometheus.yml file ● Includes polling frequency, timeouts etc ● Ok for testing but doesn’t scale for production systems ■ Get, install and run Prometheus. ● Initially just running locally.
- 24. Graphs Counter ■ Browse to Prometheus Server URL ■ No default dashboards ■ View and select metrics ■ Execute them to graph ■ Counter value increases over time
- 25. Rate Graph using irate function ■ Enter expressions, e.g. irate function ■ Expression language has multiple data types and many functions
- 26. Gauge graph Pipeline stage durations in seconds ■ Doesn’t need a function as it’s a Gauge
- 27. Grafana Prometheus GUI ok for debugging Grafana better for production ■ Install and run Grafana ■ Browse to Grafana URL, create a Prometheus data source, add a Prometheus Graph. ■ Can enter multiple Prometheus expressions and graph them on the same graph. ■ Example shows rate and duration metrics
- 28. Simple Test configuration Prometheus Server outside Kubernetes cluster, pulls metrics from Pods Dynamic/many Pods are a challenge ■ IP addresses to pull from are dynamic ● Have to update Prometheus pull configurations ● In production too many Pods to do this manually
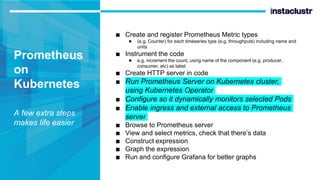
- 29. Prometheus on Kubernetes A few extra steps makes life easier ■ Create and register Prometheus Metric types ● (e.g. Counter) for each timeseries type (e.g. throughputs) including name and units ■ Instrument the code ● e.g. increment the count, using name of the component (e.g. producer, consumer, etc) as label ■ Create HTTP server in code ■ Run Prometheus Server on Kubernetes cluster, using Kubernetes Operator ■ Configure so it dynamically monitors selected Pods ■ Enable ingress and external access to Prometheus server ■ Browse to Prometheus server ■ View and select metrics, check that there’s data ■ Construct expression ■ Graph the expression ■ Run and configure Grafana for better graphs
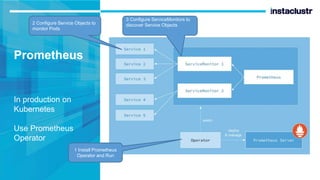
- 30. Prometheus In production on Kubernetes Use Prometheus Operator
- 31. Prometheus In production on Kubernetes Use Prometheus Operator 1 Install Prometheus Operator and Run
- 32. Prometheus In production on Kubernetes Use Prometheus Operator 1 Install Prometheus Operator and Run 2 Configure Service Objects to monitor Pods
- 33. Prometheus In production on Kubernetes Use Prometheus Operator 1 Install Prometheus Operator and Run 2 Configure Service Objects to monitor Pods 3 Configure ServiceMonitors to discover Service Objects
- 34. Prometheus In production on Kubernetes Use Prometheus Operator 1 Install Prometheus Operator and Run 2 Configure Service Objects to monitor Pods 3 Configure ServiceMonitors to discover Service Objects 4 Configure Prometheus objects to specify which ServiceMonitors should be included
- 35. Prometheus In production on Kubernetes Use Prometheus Operator 1 Install Prometheus Operator and Run 2 Configure Service Objects to monitor Pods 3 Configure ServiceMonitors to discover Service Objects 4 Configure Prometheus objects to specify which ServiceMonitors should be included 5 Allow ingress to Prometheus by using a Kubernetes NodePort Service 6 Create Role-based access control rules for both Prometheus and Prometheus Operator 7 Configure AWS EC2 firewalls
- 36. Weavescope Prometheus now magically monitors Pods as they come and go Showing Prometheus monitoring Pods Prometheus Operator Pods
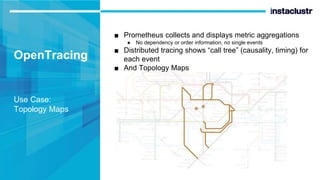
- 37. OpenTracing Use Case: Topology Maps ■ Prometheus collects and displays metric aggregations ● No dependency or order information, no single events ■ Distributed tracing shows “call tree” (causality, timing) for each event ■ And Topology Maps
- 38. OpenTracing Standard API for distributed tracing ■ Specification, not implementation ■ Need ● Application instrumentation ● OpenTracing tracer Traced Applications API Tracer implementations Open Source, Datadog
- 39. Spans Smallest logical unit of work in distributed system ■ Spans are smallest logical unit of work ● Have name, start time, duration, associated component ■ Simplest trace is a single span
- 40. Trace Multi-span trace ■ Spans can be related ● ChildOf = synchronous dependency (wait) ● FollowsFrom = asynchronous relationships (no wait) ■ A Trace is a DAG of Spans. ● 1 or more Spans.
- 41. Instrumentation ■ Language specific client instrumentation ● Used to create spans in the application within the same process ■ Contributed libraries for frameworks ● E.g. Elasticsearch, Cassandra, Kafka etc ● Used to create spans across process boundaries (Kafka producers -> consumers) ■ Choose and Instantiate a Tracer implementation // Example instrumentation for consumer -> detector spans static Tracer tracer = initTracer(”AnomaliaMachina"); . . . Span span1 = tracer.buildSpan(”consumer").start(); . . . span1.finish(); Span span2 = tracer .buildSpan(”detector") .addReference(References.CHILD_OF, span1.context()) .start(); . . . span2.finish(); Steps
- 42. Tracing across process boundaries Inject/extract metadata ■ To trace across process boundaries (processes, servers, clouds) OpenTracing injects metadata into the cross-process call flows to build traces across heterogeneous systems. ■ Inject and extract a spanContext, how depends on protocol.
- 43. How to do this for Kafka? Producer Automatically inserts a span context into Kafka headers using Interceptors // Register tracer with GlobalTracer: GlobalTracer.register(tracer); // Add TracingProducerInterceptor to sender properties: senderProps.put(ProducerConfig.INTERCEPTOR_CLASSES_CONFIG, TracingProducerInterceptor.class.getName()); // Instantiate KafkaProducer KafkaProducer<Integer, String> producer = new KafkaProducer<>(senderProps); // Send producer.send(...); // 3rd party library // https://github.com/opentracing-contrib/java-kafka-client
- 44. Consumer side Extract spanContext // Once you have a consumer record, extract // the span context and // create a new FOLLOWS_FROM span SpanContext spanContext = tracer.extract(Format.Builtin.TEXT_MAP, new MyHeadersMapExtractAdapter(record.headers(), false)); newSpan = tracer.buildSpan("consumer").addReference(Refe rences.FOLLOWS_FROM, spanContext).start();
- 46. Jaeger Tracer How to use? • Tracers can have different architectures and protocols • Jaeger should scale well in production as • It can use Cassandra and Spark • Uses adaptive sampling • Need to instantiate a Jaeger tracer in your code
- 47. Jaeger GUI ■ Install and start Jaeger ■ Browse to Jaeger URL ■ Find traces by name, operation, and filter. ■ Select to drill down for more detail.
- 48. Jaeger Single trace ■ Insight into total trace time, relationships and times of spans ■ This is a trace of a single event through the anomaly detector pipeline ● Producer (async) ● Consumer (async) ● Detector (async, with sync children) ᐨ CassandraWrite ᐨ CassandraRead ᐨ AnomalyDetector
- 49. Jaeger Dependencies view ■ Correctly shows anomaly detector topology ■ Only metric is number of spans observed ■ Can’t select subset of traces, or filter ■ Force directed view, select node and highlights dependencies
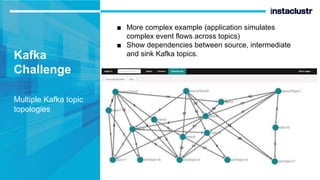
- 50. Kafka Challenge Multiple Kafka topic topologies ■ More complex example (application simulates complex event flows across topics) ■ Show dependencies between source, intermediate and sink Kafka topics.
- 51. Conclusions Observations & Alternatives ■ Topology view is basic (c.f. some commercial APMs) ■ Still need Prometheus for metrics ● in theory OpenTracing has everything needed for metrics. ■ Other OpenTracing tracers may be worth trying, e.g. Datadog ■ OpenCensus is a competing approach. ■ Manual instrumentation is tedious and potentially error prone, many commercial APMs use byte-code injection to avoid this problem ■ The future? Kubernetes based service mesh frameworks could construct traces for microservices without instrumentation ● as they have visibility into how Pods interact with each other and external systems ● and Pods only contain a single microservice, not a monolithic application
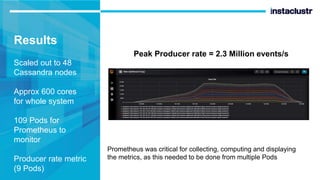
- 52. Results Scaled out to 48 Cassandra nodes Approx 600 cores for whole system 109 Pods for Prometheus to monitor Producer rate metric (9 Pods) Peak Producer rate = 2.3 Million events/s Prometheus was critical for collecting, computing and displaying the metrics, as this needed to be done from multiple Pods
- 53. Business metric Detector rate 100 Pods 220,000 anomaly checks/s computed from 100 stacked metrics Anomaly Checks/s = 220,000 Prometheus was critical for tuning the system to achieve near perfect linear scalability - used metrics for consumer and detector rate to tune thread pool sizes to optimize anomaly checks/s, for increasingly bigger systems. OpenTracing and Jaeger was useful during test deployment - to check/debug if components were working together as expected - but didn’t use in final production deployment - as more set-up required using the Jaeger Kubernetes Operator: https://github.com/jaegertracing/jaeger-operator
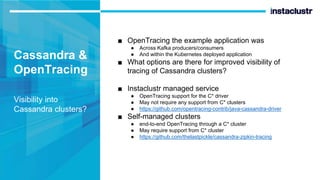
- 54. Cassandra & OpenTracing Visibility into Cassandra clusters? ■ OpenTracing the example application was ● Across Kafka producers/consumers ● And within the Kubernetes deployed application ■ What options are there for improved visibility of tracing of Cassandra clusters? ■ Instaclustr managed service ● OpenTracing support for the C* driver ● May not require any support from C* clusters ● https://github.com/opentracing-contrib/java-cassandra-driver ■ Self-managed clusters ● end-to-end OpenTracing through a C* cluster ● May require support from C* cluster ● https://github.com/thelastpickle/cassandra-zipkin-tracing
- 55. Cassandra & Prometheus Visibility into Cassandra clusters? Option 1 Instaclustr managed service ■ Prometheus monitoring of the example application ● limited to application metrics collected from Kubernetes Pods ■ What options are there for integration with Casandra Cluster metrics? ■ Instaclustr managed Cassandra ● 3rd party Prometheus exporter, native integration planned ● https://www.instaclustr.com/support/api-integrations/integrations/using- instaclustr-monitoring-api-prometheus/
- 56. Cassandra & Prometheus Visibility into Cassandra clusters? Option 2 Self-managed clusters ■ Instaclustr OpenSource contributions (under development) ● cassandra-exporter exports Cassandra metrics to Prometheus ᐨ https://github.com/instaclustr/cassandra-exporter ● Kubernetes Operator for Apache Cassandra ᐨ https://github.com/instaclustr/cassandra-operator/ ● The Cassandra operator will create the appropriate objects to inform the Prometheus operator about the metrics endpoints available from Cassandra ■ Instaclustr customers can then use ● Prometheus to monitor their own applications ● Prometheus federation to scrape the Cassandra Prometheus server to integrate application and cluster metrics ᐨ https://prometheus.io/docs/prometheus/latest/federation/
- 57. Prometheus Federation Federation Prometheus servers can pull metrics from other Prometheus servers
- 58. More information? Anomalia Machina Blogs: Massively Scalable Anomaly Detection with Apache Kafka and Cassandra ■ Anomalia Machina 5 – Application Monitoring with Prometheus ● https://www.instaclustr.com/anomalia-machina-5-1-application- monitoring-prometheus-massively-scalable-anomaly-detection- apache-kafka-cassandra/ ■ Anomalia Machina 6 – Application Tracing with OpenTracing ● https://www.instaclustr.com/anomalia-machina-6-application- tracing-opentracing-massively-scalable-anomaly-detection-apache- kafka-cassandra/ ■ Anomalia Machina 8 – Production Application Deployment with Kubernetes ● https://www.instaclustr.com/anomalia-machina-8-production- application-deployment-kubernetes-massively-scalable-anomaly- detection-apache-kafka-cassandra/ ● Enabling Ingress into Kubernetes: Connecting Prometheus to the Application running in Kubernetes ■ Anomalia Machina 10 – Final Results (soon) ● Using Prometheus Operator ■ All Blogs
- 59. The End Instaclustr Managed Platform Multiple Open Source Technologies and Providers www.instaclustr.com/platform/