How to pinpoint and fix sources of performance problems in your SAP BusinessObjects BI reports and dashboards
3 likes12,477 views

This presentation demonstrates how to pinpoint performance bottlenecks in SAP BusinessObjects reports and dashboards. It explores tools that can collect and analyze data from the various components involved, such as the front-end applications, servers, databases, and network. Specific examples are provided on how to use traces, logs, and other tools to measure and break down the timing of different workflows involving Web Intelligence, Design Studio, and SAP HANA. The goal is to identify where time is spent and determine if improvements can be made to content design, system resources, configuration, or queries.


![Web Intelligence refresh via JDBC to SAP HANA sidecar
· The output will be captured in the CSJNIEngine_trace file
· Output looks something like this:
13:46:01.479|+0000|Information| |==| | |CSJNIEngine|14160|1471|Thread-1459
|{|431|4|3|4|BIlaunchpad.WebApp|BOESERVER|webiserver_ACC_PROC_2.WebIntelligenceProcessingServe
r.processDPCommandsEx|localhost:14160:13844.107885:1|CSJNI.JNIbeforeIncomingCall| BOESERVER
START OUTGOING CALL execute: FROM [CSJNI.JNIbeforeIncomingCall# BOESERVER]-
13:46:01.503|+0000|Information| |==| | |CSJNIEngine|14160|1471|Thread-1459
|}|431|2|3|2|BIlaunchpad.WebApp| BOESERVER
|webiserver_ACC_PROC_2.WebIntelligenceProcessingServer.processDPCommandsEx| BOESERVER
|CSJNI.JNIbeforeIncomingCall| BOESERVER ||CS::JAVA::fetch: 00.025-
13:46:01.505|+0000|Error| |==|E| |CSJNIEngine|14160|1471|Thread-1459
|}|431|3|3|1|BIlaunchpad.WebApp| BOESERVER
|webiserver_ACC_PROC_2.WebIntelligenceProcessingServer.processDPCommandsEx| BOESERVER
|CSJNI.JNIbeforeIncomingCall| BOESERVER ||END INCOMING CALL SPENT [04.029] FROM
[webiserver_ACC_PROC_2.WebIntelligenceProcessingServer.processDPCommandsEx#] TO
[CSJNI.JNIbeforeIncomingCall# BOESERVER]](https://image.slidesharecdn.com/howtopinpointandfixsourcesofperformanceproblemsinsapbusinessobjectsbireportsanddashboards-160405093334/85/How-to-pinpoint-and-fix-sources-of-performance-problems-in-your-SAP-BusinessObjects-BI-reports-and-dashboards-28-320.jpg)


Get the crosstab data (GET_CROSSTAB_DATA)-
(cont. overleaf)](https://image.slidesharecdn.com/howtopinpointandfixsourcesofperformanceproblemsinsapbusinessobjectsbireportsanddashboards-160405093334/85/How-to-pinpoint-and-fix-sources-of-performance-problems-in-your-SAP-BusinessObjects-BI-reports-and-dashboards-38-320.jpg)

Get the crosstab data (GET_CROSSTAB_DATA)-
· Most transactions occur within the executeBIRequest call. Here is the start of the main
executeBIRequest:
12:00:21.847|+0100|Information| |==| | |aps_ACC_PROC_2.AnalysisApplicationService|
3744|184296|Transport:Shared-1170/56|{|383|1|1|2|BIlaunchpad.WebApp| BOESERVER
|BIlaunchpad.WebApp| BOESERVER |.START OUTGOING CALL Outgoing: FROM [.executeBIRequest#
BOESERVER](https://image.slidesharecdn.com/howtopinpointandfixsourcesofperformanceproblemsinsapbusinessobjectsbireportsanddashboards-160405093334/85/How-to-pinpoint-and-fix-sources-of-performance-problems-in-your-SAP-BusinessObjects-BI-reports-and-dashboards-39-320.jpg)
![SAP BO Design Studio refresh via JDBC BICS to SAP HANA
· Here is a call which is triggered by executeBIRequest, and has been “outsourced” by the AAS to the
Security Token Server (STS) – this call resolves SSO (SAML, in this example):
12:00:21.972|+0100|Information| |==| | |aps_ACC_PROC_2.AnalysisApplicationService|
3744|184296|Transport:Shared-1170/56|}|411|0|1|2|BIlaunchpad.WebApp| BOESERVER
|BIlaunchpad.WebApp| BOESERVER |.executeBIRequest| BOESERVER END OUTGOING CALL Outgoing:
SPENT [00.255] FROM [.executeBIRequest#BOESERVER]TO [.getSAMLSSOResponseByHostAndPort#
BOESERVER ]-
· There are many smaller operations (e.g., creation of controller session, fetching of BIAPP through
CORBA layer, creation of components), all accounting for tiny amounts of time
- Only look for expensive calls when looking for bottlenecks
- Adding up expensive calls will account for vast majority of measured execution time
- The sum of all the smaller calls makes up for any “missing” time](https://image.slidesharecdn.com/howtopinpointandfixsourcesofperformanceproblemsinsapbusinessobjectsbireportsanddashboards-160405093334/85/How-to-pinpoint-and-fix-sources-of-performance-problems-in-your-SAP-BusinessObjects-BI-reports-and-dashboards-40-320.jpg)


Ad
More Related Content
What's hot (20)
Viewers also liked (16)


Ad
Similar to How to pinpoint and fix sources of performance problems in your SAP BusinessObjects BI reports and dashboards (20)


Ad
Recently uploaded (20)


How to pinpoint and fix sources of performance problems in your SAP BusinessObjects BI reports and dashboards
- 1. How to Pinpoint and fix sources of performance problems in SAP BusinessObjects BI reports and dashboards
- 2. This presentation demonstrates best practice for pinpointing the cause of poor response times in reports and dashboards. Whether it’s front-end report design, server resources/configuration, back-end data execution, or specific product code calls that require optimization, we look at how to determine where time is spent during various workflows. We explore which tools can be used to collect and analyse data, as well as how to interpret the information: identifying performance bottlenecks with real-life examples, and exploring how different components in the architectural workflow can influence execution times. Introduction
- 3. Performance Measurement Agenda Performance Analysis Data Interpretation Tools Closing Remarks Xoomworks BI
- 5. Best practice when measuring performance · Architectural workflows within SAP BusinessObjects Enterprise can be complex · When a performance concern is raised, it can be a challenge to identify the root cause - Front end/ inefficient report design? - Are you using the best application for the job at hand? - SAP BusinessObjects and database – insufficient capacity, incorrect configuration? + Inefficient distribution of servers across cluster + Inadequate or inefficient heap assignment + Suboptimal configuration of services; missing SAP Notes and fixes - Other factors + Room to improve your database query? + Network latency? + End-user laptop configuration causing a bottleneck
- 6. Best practice when measuring performance · The front-end application (e.g., WebI) is frequently blamed since this is the only part users interact with….… · Another frequently cited concern is lack of server resources · These concerns can be easily investigated, verified, and addressed or put to rest
- 7. Best practice when measuring performance · Start by analyzing a workflow in isolation - Where possible, take measurements in an environment where you can control the load - If production-like resources are not available, be prepared to extrapolate - If using tools to generate load, be sure to set realistic active concurrency · Take multiple measurements at different times during the day - Time may vary even in the same workflow – always take an average - Don’t forget to account for system/database/client cache · Do some sites suffer more than others? - Is number of users at that site a factor? Bandwidth issues? - Are jobs running overnight which affect different time zones? - How far is that location from your data? Network round trip/latency?
- 8. Best practice when measuring performance · Once you have consistent measurements, check all processing layers involved and determine time spent within each layer - How much time is spent in the database running the query? - How much time is spent bringing data back from the data source? - How much time is spent building each page and delivering it to the user? · This will help identify which areas you may need to revisit: - Content design: Are you trying to fit too much into one report or database query? - Environment sizing or configuration: Are additional resources required? - Jobs and data loading: Can the schedule be adjusted? - Customisation or call stack: Is it time to raise a Support case?
- 10. Analysing performance using some example workflows: 1. Web Intelligence refresh via OLAP BICS to BW on SAP HANA 2. Web Intelligence refresh via JDBC to SAP HANA sidecar 3. SAP BusinessObjects Design Studio refresh via JDBC BICS to SAP HANA 4. AD or SAP logon into BI launchpad 5. OLAP refresh via OLAP BICS in SAP BusinessObjects BI 4.1 to BW on SAP HANA
- 11. · Web Intelligence (WebI) is an ad hoc reporting application that allows end users to define queries and design reports, or to modify existing reports depending on requirements · To optimize report performance or find potential bottlenecks: - Capture SAP BusinessObjects traces + Use SAP Client Plug-in (see SAP Note 1861180) + This tags each step with a unique correlationID - Measure front-end execution using, e.g., HttpWatch - Record BW execution time using ST12 - Review BW stats with ST13 BIIPTOOLS Web Intelligence refresh via OLAP BICS to BW on SAP HANA
- 12. WebI refresh via OLAP BICS to BW on SAP HANA · Workflow starts when user clicks button in browser - HttpWatch, Fiddler, etc. will accurately record start (and end) of execution · Take several measurements without traces to establish a baseline · With a consistent measurement, now perform same workflow but with traces enabled - Be aware of overhead introduced by the traces –overhead can be significant! - Consider overhead in your final assessment · Gather and filter the traces based on tag generated by the SAP Client Plug-in - This will enable you to follow the workflow through the traces - Several trace analysis tools are provided by SAP + E.g. FlexiLogReader (refer to SAP Knowledge Base Article 2203047)
- 13. WebI refresh via OLAP BICS to BW on SAP HANA · In this example workflow, several servers will be called - WebI Processing Server sees incoming call from HttpServletRequest - We can follow the function call stack which will invoke other servers as required + Calls to CMS (for security and core processing queries) + Calls to Security Token Server (STS) to resolve single sign-on to BW + DSLBridge (hosted in an APS) to fetch data from BW and to build transient universe · Traces show the architecture involved – investigate time spent in each processing layer · Add up time spent for all “HttpServletRequest” calls - Does this match time measured by, e.g., HttpWatch, Fiddler, etc.? - Small discrepancies to be expected - Time recorded in front end, but not traced, is activity outside of SAP BusinessObjects + E.g. time spent processing by client browser
- 14. Use the following tools to capture information during the workflow: · SAP Client Plug-in (set trace level to high) - Can also activate traces via CMC, though transactions won’t be tagged · HttpWatch or Fiddler (or equivalent) can measure front-end execution time - Will also show the HTTP requests involved · Use ST12 transaction in BW for user ID executing the query - Only capture RFC calls (at this stage) WebI refresh via OLAP BICS to BW on SAP HANA
- 15. WebI refresh via OLAP BICS to BW on SAP HANA After workflow has completed: · Save the HttpWatch output as a .hwl file · Stop recording with SAP Client Plug-in and collect relevant trace files - BI launchpad - WIPS - DSLBridge - CMS - STS · Stop ST12 and collect output, pick up statistics in ST13/BIIPTOOLS · Both ST12 and BIIPTOOLS output can be saved to Excel for offline analysis
- 16. WebI refresh via OLAP BICS to BW on SAP HANA · For comprehensive traces, use SAP Client Plug-in on “high” setting · But this creates a problem – activity will be logged on virtually all trace files (even those not relevant to our workflow) - “High” will pick up unimportant communication between internal components - This background noise is not important to us · To see which components are of interest in any workflow, first run the traces on “low” - Then gather ALL trace files with .glf file extension - Search all .glf files for correlationID tag from businesstransaction.xml - There is less “noise” – we only find hits in the files that are important to us · Now run traces again on “high” setting to record your workflow - Gather only trace files you identified as important, and ignore the rest
- 17. · Various tools can be used to search multiple trace files for the correlationID tag (E.g., Notepad++, UltraEdit, etc.) · Relevant traces shown here: - BI launchpad - WIPS - DSLBridge - CMS - STS WebI refresh via OLAP BICS to BW on SAP HANA
- 18. Analysis of trace files · Use SAP tools (e.g., GLF Viewer, FlexiLogReader) to review trace files · Filter by correlationID from businesstransaction.xml - This removes “background noise” and you can now focus on activity from your workflow · Use indents and/or color to highlight each function call - Can now easily find start/end of function calls - Makes it easy to see how long each step takes · Add threadID column - Can now see and filter by individual threads · Scan transaction times, and look for “jumps” - This is when activity is happening outside the traces E.g. when activity is happening in data source
- 19. Analysis of trace files · When bringing the results together, you’ll see time spent on operations like: - DPCommandsEx - answerPrompts - openDocumentMDP - getSessionInfosEx - getMap, getPages, getBlobInfo, etc. · Follow incoming/outgoing function calls from Tomcat layer to WIPS, and from WIPS to other services · For activity outside SAP BusinessObjects (e.g., in BW), details of time spent can be found using tools provided by that particular module/interface (e.g., ST12, ST13) - SAP BusinessObjects traces can only record overall time for database activity - Traces contain no detail/granularity on transactions inside the data source
- 20. Analysis of trace files · The illustration below brings together HttpWatch, traces, ST12, and ST13 data. Total execution was measured as 12.822s, and I accounted for 12.109s in the breakdown:
- 21. Breakdown of findings Total execution time as seenby user was recorded using HttpWatch, and was comprised of: · BI4 Platform time - CMS authorization (STS was used, because of SSO to BW) - DSLBridge - WebI Processing Server (WIPS) · Data source time (BW on SAP HANA) - Query execution time - Calculation in database · Transfer time between database and BI4 platform · Time outside BI4 traces – e.g., processing time in client browser or laptop
- 22. Breakdown of findings: BI platform time (captured in BI4 trace files) · CMS authorization (STS was used, because of SSO to BW) - Security/authorization checks can be expensive + Can we simplify security (e.g., reduce group membership) to improve response times? · DSLBridge - Query execution plan (QXP) and transient/lean universe generation + More objects in the BEx query means more expensive QXP + Challenge the business users – Do they really need/use ALL those objects? + Can you satisfy business requirements using several smaller, leaner queries/reports? · WebI Processing Server (WIPS) - Microcube population, rendering report for display, calculation of variables, etc. + Check for expensive pagination functions –e.g. GetPages + Can report-level calculations be pushed down to the database?
- 23. Breakdown of findings: Data source time (in our case BW on SAP HANA) · Not captured in BI4 traces – this is found in ST12 and ST13 BIIPTOOLS output - Query execution time + Can you add more mandatory prompts to restrict the dataset? - OLAP calculations + Can any more calculations be pushed down to HANA? - OLAP processing: data is sorted and formatted according to query design - Receive data from OLAP processor and put into transfer structure in BICS interface · Data transfer from BW to BI Layer - DSL (WebI) BICS time: data transfer and preparation for WebI usage
- 24. Points to consider Is the poor performance an intermittent problem? · Data loading can affect data manager time · Check content design for functions which cause cache to be ignored! - Taking measurements throughout the day may help you pinpoint this - Refer to earlier section on best practice in testing methodology Are clients making full use of all available caching mechanisms? · Refer to ‘Best Practices for Web Intelligence Report Design’ (link in resource library at end of presentation) - See section “Do not (accidentally) disable the cache mechanism of Web Intelligence”
- 25. Points to consider Metadata transmission can be expensive · This may be influenced by content design e.g. transient/lean universe generation – Can you reduce number of key fields and/or characteristics? - Too many prompt responses can result in high send time in the RFC record · This may also be influenced by BW configuration - Activate compression via BASXML flag for the relevant BICS calls affected (e.g., BICS_PROV_GET_INITIAL_STATE)
- 26. Web Intelligence refresh via JDBC to SAP HANA sidecar The methodology we previously described applies here too · However, data fetch for JDBC is now done by the WIPS itself (INPROC) · WIPS doesn’t outsource to a “third party” to communicate with the data source - In previous workflow, data fetch was handled by DSLBridge - Connection Server (CS) would be used for relational data sources · Communication with data source is handled by the CS JNI Engine inside the WIPS · To trace activity in the JNI call stack we must update the cs.cfg (file located in:<boeinstalldir>/dataAccess/connectionServer)
- 27. Web Intelligence refresh via JDBC to SAP HANA sidecar · Update the following to enable tracing: · If SSO is used, then JDBC will either use XML-based SAML, or Kerberos AD · Time spent will show in the WIPS and STS output
- 28. Web Intelligence refresh via JDBC to SAP HANA sidecar · The output will be captured in the CSJNIEngine_trace file · Output looks something like this: 13:46:01.479|+0000|Information| |==| | |CSJNIEngine|14160|1471|Thread-1459 |{|431|4|3|4|BIlaunchpad.WebApp|BOESERVER|webiserver_ACC_PROC_2.WebIntelligenceProcessingServe r.processDPCommandsEx|localhost:14160:13844.107885:1|CSJNI.JNIbeforeIncomingCall| BOESERVER START OUTGOING CALL execute: FROM [CSJNI.JNIbeforeIncomingCall# BOESERVER]- 13:46:01.503|+0000|Information| |==| | |CSJNIEngine|14160|1471|Thread-1459 |}|431|2|3|2|BIlaunchpad.WebApp| BOESERVER |webiserver_ACC_PROC_2.WebIntelligenceProcessingServer.processDPCommandsEx| BOESERVER |CSJNI.JNIbeforeIncomingCall| BOESERVER ||CS::JAVA::fetch: 00.025- 13:46:01.505|+0000|Error| |==|E| |CSJNIEngine|14160|1471|Thread-1459 |}|431|3|3|1|BIlaunchpad.WebApp| BOESERVER |webiserver_ACC_PROC_2.WebIntelligenceProcessingServer.processDPCommandsEx| BOESERVER |CSJNI.JNIbeforeIncomingCall| BOESERVER ||END INCOMING CALL SPENT [04.029] FROM [webiserver_ACC_PROC_2.WebIntelligenceProcessingServer.processDPCommandsEx#] TO [CSJNI.JNIbeforeIncomingCall# BOESERVER]
- 29. SAP BO Design Studio refresh via JDBC BICS to SAP HANA Scenario: User executes Design Studio (DS) content via OpenDocument syntax from HANA XS portal · Review content design for complexity, and simplify where possible - Do separate components sit within one iframe? - Are any custom (SDK) components being used? Key areas for this workflow: · Enterprise session generation (logon) initiated via OpenDocument call · JavaScript and other static content processing and cache validation on client side
- 30. SAP BO Design Studio refresh via JDBC BICS to SAP HANA Key areas for this workflow (Cont.): · Session generation for Analysis Application Service (AAS) on BI4 Platform · Processing of Design Studio content components including: - Validate security, retrieve report from File Repository - Establish JDBC connection to HANA, resolve trust to HANA if SSO being used - BICS script execution on HANA, data fetching
- 31. SAP BO Design Studio refresh via JDBC BICS to SAP HANA
- 32. SAP BO Design Studio refresh via JDBC BICS to SAP HANA Use HttpWatch, Fiddler, etc. · Measures overall execution time as experienced by user · Importantly, also records the static content downloaded on the client · Compare initial execution to subsequent executions - Static content should be cached and re-used after initial load
- 33. SAP BO Design Studio refresh via JDBC BICS to SAP HANA Enable of profiling parameter in the URL which opens your Design Studio content · Create OpenDoc link with your DS content, add “&profiling=X” to end of OpenDoc URL · This generates DS statistics on client rendering and Java server time Check for consistent behaviour with different browsers · Is performance better/worse in IE vs. Chrome? · Is performance better/worse in different versions of same browser?
- 34. SAP BO Design Studio refresh via JDBC BICS to SAP HANA Use the SAP Client Plug-in (low setting) to generate trace output – alternatively, enable Tomcat and Analysis Application Server traces · Take several measurements to ensure consistent readings and establish baseline/average. · Compare response times for the Initial load without client cache: - New Enterprise session generation for logon to BOE platform (AD SSO into application layer) - All static content (JavaScript/CSS) must be loaded by the client - New CMS queries for security validation · The Initial load with client cache: - New Enterprise session generation for BOE platform (AD SSO into application layer) - All static content should now be read from local cache - New CMS queries for security validation
- 35. SAP BO Design Studio refresh via JDBC BICS to SAP HANA · The Subsequent reload with client cache: - Enterprise session already exists and all static content should now be read from cache · Find the start and end for your execution in the Tomcat web app output 12:00:18.950|+0100|Information| |==| | |BIlaunchpad| 4540|1552|http-apr-8443-exec-13| |1|0|1|0|BIlaunchpad.WebApp| BOESERVER |BIlaunchpad.WebApp| BOESERVER |BIPSDK.EnterpriseSession:getService| BOESERVER |com.crystaldecisions.sdk.framework.internal.EnterpriseSession||getService(): service=InfoStore, server=- 12:00:49.954|+0100|Information| |==| | |BIlaunchpad| 4540| 63|http-apr-8443-exec- 5|}|24|1|0|1|BIlaunchpad.WebApp| BOESERVER |-|-|BIlaunchpad.WebApp| BOESERVER |HttpServletRequest: 00.046
- 36. SAP BO Design Studio refresh via JDBC BICS to SAP HANA · This time should match the HttpWatch total time - Difference between start of first request and end of final request should match time recorded in HttpWatch - Very easy to find this in traces if using SAP Client Plug-in, as transactions are tagged - Remember – a small discrepancy to be expected · Now bring results together to consider end-to-end workflow - AAS from BI4 Platform - Tomcat web app trace from SAP HANA XS - BICS profiling output (Java statistics) - HttpWatch capture
- 37. SAP BO Design Studio refresh via JDBC BICS to SAP HANA · If using the SAP Client Plug-in, use the correlationID (in businesstransaction.xml) to filter out background noise and see only relevant activity inside BI4 Platform traces · When you’re looking for potential bottleneck, start by zooming into the most time-consuming calls
- 38. SAP BO Design Studio refresh via JDBC BICS to SAP HANA · “Int.do” in HttpWatch trigger BICS script execution/data fetch on SAP HANA - 15.12s recorded in HttpWatch + 23.094 15.120 3892 6442 POST 200 html https:// BOESERVER /BOE/portal/1502261134/zenwebclient/int.do · This triggers main executeBIRequest function – which can be seen in AAS traces - 14.83s recorded in trace files (remember: small discrepancy always expected) 12:00:42.954|+0100|Debug| |<<| | | BOESERVER|13296|157637|Transport:Shared-1439/56| |23|1|1|1|BIlaunchpad.WebApp| BOESERVER|BIlaunchpad.WebApp| BOESERVER |.executeBIRequest| BOESERVER|0|||||interface com.sap.ip.bi.base.application.IApplication|BI-RA-AD|[BICS HANA](14833ms) Get the crosstab data (GET_CROSSTAB_DATA)- (cont. overleaf)
- 39. SAP BO Design Studio refresh via JDBC BICS to SAP HANA · This triggers main executeBIRequest function – which can be seen in AAS traces (Cont.) 12:00:42.954|+0100|Debug| |<<| | | BOESERVER|13296|157637|Transport:Shared-1439/56| |23|1|1|1|BIlaunchpad.WebApp| BOESERVER|BIlaunchpad.WebApp| BOESERVER |.executeBIRequest| BOESERVER|0|||||interface com.sap.ip.bi.base.application.IApplication|BI-RA-AD|[BICS HANA](14833ms) Get the crosstab data (GET_CROSSTAB_DATA)- · Most transactions occur within the executeBIRequest call. Here is the start of the main executeBIRequest: 12:00:21.847|+0100|Information| |==| | |aps_ACC_PROC_2.AnalysisApplicationService| 3744|184296|Transport:Shared-1170/56|{|383|1|1|2|BIlaunchpad.WebApp| BOESERVER |BIlaunchpad.WebApp| BOESERVER |.START OUTGOING CALL Outgoing: FROM [.executeBIRequest# BOESERVER
- 40. SAP BO Design Studio refresh via JDBC BICS to SAP HANA · Here is a call which is triggered by executeBIRequest, and has been “outsourced” by the AAS to the Security Token Server (STS) – this call resolves SSO (SAML, in this example): 12:00:21.972|+0100|Information| |==| | |aps_ACC_PROC_2.AnalysisApplicationService| 3744|184296|Transport:Shared-1170/56|}|411|0|1|2|BIlaunchpad.WebApp| BOESERVER |BIlaunchpad.WebApp| BOESERVER |.executeBIRequest| BOESERVER END OUTGOING CALL Outgoing: SPENT [00.255] FROM [.executeBIRequest#BOESERVER]TO [.getSAMLSSOResponseByHostAndPort# BOESERVER ]- · There are many smaller operations (e.g., creation of controller session, fetching of BIAPP through CORBA layer, creation of components), all accounting for tiny amounts of time - Only look for expensive calls when looking for bottlenecks - Adding up expensive calls will account for vast majority of measured execution time - The sum of all the smaller calls makes up for any “missing” time
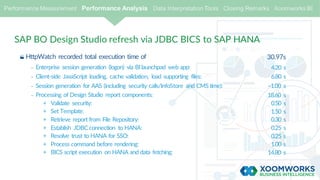
- 41. SAP BO Design Studio refresh via JDBC BICS to SAP HANA · HttpWatch recorded total execution time of - Enterprise session generation (logon) via BI launchpad web app: - Client-side JavaScript loading, cache validation, load supporting files: - Session generation for AAS (including security calls/InfoStore and CMS time): - Processing of Design Studio report components: + Validate security: + Set Template: + Retrieve report from File Repository: + Establish JDBC connection to HANA: + Resolve trust to HANA for SSO: + Process command before rendering: + BICS script execution on HANA and data fetching: 30.97s 4.20 s 6.80 s ~1.00 s 18.60 s 0.50 s 1.50 s 0.30 s 0.25 s 0.25 s 1.00 s 14.80 s
- 42. SAP BO Design Studio refresh via JDBC BICS to SAP HANA · Compression can have a significant impact on initial load time - Be aware of existing product defect ADAPT01704289 + Refer to SAP Note 1906557 (see resource library) - SAP have identified root cause as a bug in JVM/Tomcat + To overcome this issue, use latest SAP JVM 6.1 Patch Collection 65 (build 6.1.070) + Confirm that this SAP JVM is compatible with your version of BI4 · Parallel processing for Design Studio - To prevent deadlocks, Design Studio uses a Java-based version of BICS - Prior to version 1.5, DS could only process sequentially - Parallel processing now available from version 1.5 + Apply SP2 to resolve parallel processing bug when using SDK components
- 43. SAP BO Design Studio refresh via JDBC BICS to SAP HANA Be aware that: · Cache validation has a significant impact on initial load time - Cache-Control is configured to 10 years and used in combination with a “Last-modified” property - After AAS restart, last modified time gets updated - In a clustered BI4 environment (i.e., with AAS on different nodes), last modified property won’t be the same across all nodes, due to different AAS restart timestamps - This results in client browser cache being ignored + Every time the content is opened it is treated as an initial load - SAP improved Design Studio at 1.3 SP2 to improve the way it handles static content
- 44. SAP BO Design Studio refresh via JDBC BICS to SAP HANA Be aware that: · If using custom SDK components, initial response time may seem excessive - Gathering resources from SDK components takes longer than normal - This is because SDK components are stored in BI4 as repository objects (BLOBS) - Resultant processing in the web tier represents an additional overhead + Resources only need to be fetched once – and then can be cached + They are subsequently read from cache, improving response times for users
- 45. AD or SAP logon into BI Launchpad · Each authentication type has its own plug-in - There are client-side SDK plug-ins and server-side (CMS) plug-ins, client tools may also use web services, etc. · User logon is initiated by client-side plug-in - Handshake occurs between the client-side and the CMS plug-ins. On successful handshake, the CMS permits logon · Plug-ins may need to perform different functions, depending on authentication type. Regardless of authentication type, CMS security sub-system performs the following: - Ensures user count does not exceed the maximum allowed for current license key - Creates a session InfoObject and increments the license count - Creates the logon token InfoObject (a unique string instead of username/password) - Optionally creates the user InfoObject if it does not already exist - It is dependent on settings in Authentication tab in CMC
- 46. AD or SAP logon into BI Launchpad · Enterprise authentication logon requires the secEnterprise client-side plug-in - Plug-in encrypts the user name and password - Plug-in stores this in a security buffer, and hands the security buffer to CMS - CMS security sub-system calls the object sub-system to verify user InfoObject exists and pwd matches + If these criteria are satisfied and security allows, the user is allowed to log on · AD authentication logon requires the secWinAD client-side plug-in - Queries the Domain Controller (DC) to authenticate the user - On successful authentication, a token from DC gets passed to the server-side secWinAD plug-in on CMS - Server-side plug-in verifies group membership by searching through group graph + Group graph includes information about User Groups and how they relate to each other
- 47. AD or SAP logon into BI Launchpad Use case scenario: users report very slow Logon to BI Platform · With use of a viewer like HttpWatch, monitor HTTP(S) traffic on the client · For each call you can see execution time in seconds, which protocol used, bytes received, and if static content is read from the cache
- 48. AD or SAP logon into BI Launchpad · In the example shown, a particular call stands out: Vintela request - https://BOEserver:8443/BOE/portal/1502261134/BIPCoreWeb/VintelaServlet?vint_backURL=%2FInfoVie w%2Flogon.faces&vint_cms=%40bi4-CMS · Use SAP Client Plug-in to trace the workflow:
- 49. AD or SAP logon into BI Launchpad · We see one call taking nearly 10s to get a response · Make use of network analysis tool (e.g. Wireshark) to inspect traffic during that call · In this real-life example, a network utility (nbstat) revealed a NetBIOS packet querying for a computer name · Problem was caused by poor server-side WINS configuration, and initial NetBIOS request timing out for each of the 3 NICs before eventually coming back · WINS determines the IP address associated with a particular network computer · After disabling WINS on all NICs, nbtstat failed immediately – did not expire/time out
- 50. AD or SAP logon into BI Launchpad · With no NetBIOS queries left pending, SSO logon was no longer held up · WINS – netbios over TCP/IP – LMHOSTS are mainly for legacy netbios-based apps · SAP BusinessObjects does not require NetBIOS for authentication, and name resolution should always use DNS
- 51. OLAP refresh via OLAP BICS in SAP BOBI 4.1 to BW on SAP HANA · In this section, we investigate performance of Analysis, edition for OLAP (aOLAP) · aOLAP is designed for query and analysis against multi-dimensional data sources · The multi-dimensional analysis server (MDAS) handles aOLAP workspaces - MDAS is hosted by an Adaptive Processing Server (APS) · For a typical aOLAP refresh via BICS to BW on SAP HANA, we see interaction between various layers and servers using same methodology as previously discussed - For process operations outside the BI4 platform, use BW statistics, ST12, etc. + BW statistics and ST12 provide extra detail that can’t be recorded in the BI4 traces
- 52. OLAP refresh via OLAP BICS in SAP BOBI 4.1 to BW on SAP HANA Total execution time (e.g., from HttpWatch) will comprise: · CMS time (and STS time, if using SSO to BW) · MDAS function calls for query execution (BICS calls) · Database processing: - HANA DB retrieval times (depending on how much data the query asks for) - OLAP Calculations (most calculations will be processed in OLAP, check possibility to push down to HANA) - OLAP processing time - BICS interface (BI/BW) - Data transfer from BW to BI Layer · Display in BI launchpad and client rendering time
- 53. OLAP refresh via OLAP BICS in SAP BOBI 4.1 to BW on SAP HANA · BW back-end statistics for aOLAP workflows can be generated by enabling BICS profiling - This is controlled via a properties file on the BOE server running the MDAS service: <BOE install dir>javapjsservicesMDASresourcescombusinessobjectsmultidimensional servicesmdas.properties · If multidimensional.services.bics.profiling.enabled is set to true: - OLAP statistics in table RSDDSTAT_OLAP are generated - Data Manager statistics in table RSDDSTAT_DM are generated · This means a RSBOLAP_BICS_STATISTIC_INFO function for almost every activity - This can have a significant impact on aOLAP performance as experienced by end users! + E.g. time taken to display a prompt to the user: we measured 11.5s with and 5s without profiling + E.g. time taken to execute a data fetch: we measured 45s with and 32s without profiling
- 54. OLAP refresh via OLAP BICS in SAP BOBI 4.1 to BW on SAP HANA · When a BEx query is connected to multiple sheets in an aOLAP workspace, check that aOLAP is only loading the active tab · MDAS may perform the loadQuery for ALL tabs, having huge impact on response times (see example of a workspace containing 12 sheets below) - There is only one getRepresentation call, but the MDAS issues a loadQuery for all 11 (inactive) sheets too! - SAP Development Group provided code optimization via ADAPT01730767 to address the overhead in the call stack when using multi-tabs
- 55. Performance impact of “lazy loading” #1 · aOLAP can be configured to always load queries when workspace is opened, or only load queries when explicitly requested by user interaction - Only loading when asked is referred to by SAP as “lazy loading” · To enable lazy loading, make a configuration change in the mdaclient.properties file on the server running Tomcat: - Configure whether queries are lazy loaded when first accessed to retrieve data or preloaded when the workspace is opened.#query.lazyload=false
- 56. Performance impact of “lazy loading” #2 · There is another configuration setting on the MDAS stack that SAP refers to as “lazy loading” - Lazy loading also means to prevent pre-load of metadata from BW with MDAS - Controls whether metadata hierarchies and attributes are pre-loaded all at once or are lazy loaded when their dimension is expanded by the user - To enable pre-load of metadata, make a configuration change in mdas.properties + multidimensional.services.preload.metadata=true · Both lazy loading options should be assessed for potential performance
- 57. Other performance considerations · If you take an aOLAP workspace from BI4.0 and open it in BI4.1, an in-situ upgrade of the internal workspace takes place to allow for new capabilities delivered with BI4.1 - Upgrade causes several seconds delay when first opening the workspace in BI4.1 - Happens each time the workspace is opened in BI4.1 until upgraded version is saved + After an upgrade, ask users to open and then save the workspace + The in-situ upgrade will not happen again · Maximum Member Selector Size - Maximum Member Selector Size is set to 100,000 by default and acts as a safety belt limit + Regardless of how many members exist, we never fetch more than this number of members + E.g. if set to 500, then in the first SQL statement you will find out if there are more than 500 entries
- 58. Other performance considerations · Member Selector Cache Limit - If Maximum Member Selector Size is less than or equal to Member Selector Cache Limit then members will be cached in MDAS for faster access on future queries - This is only applicable in flattened hierarchies
- 60. Tools to use to interpret the data, and accounting for time spent in each processing layer The following tools were used to aid the analysis exercise for the examples outlined in this presentation: · SAP Client Plug-in: a BI4 trace utility provided by SAP (SAP article 1861180) · Wireshark: freely available network analyzer · HttpWatch, Fiddler: freely available HTTP viewer and web debugger · GLF Viewer: a log file viewer provided by SAP - This has been superseded by FlexiLogReader (SAP KB article 2203047) · Notepad++: a freely available editor that supports several programming languages · nbtstat: diagnostic tool for NetBIOS over TCP/IP (part of the Windows OS) Performance Measurement Performance Analysis Data Interpretation Tools Closing Remarks Xoomworks BI
- 61. Closing Remarks
- 62. 1. Simplify and isolate your workflow, and get a consistent baseline measurement 2. Examine which processing layers are involved, and understand how the various layers interact with each other 3. Use the best tools to gather traces for the problem workflow and simplify your analysis 4. Break down the total runtime into different processing layers to see where the hold-up is 7 Take Home Messages
- 63. 5. Don’t forget that delays can occur outside the traces – e.g., in end-user laptop! 6. Verify if active concurrency, data volumes, or core processing play a factor in performance degradation 7. If appropriate, then embark on a tuning exercise based on your findings • Challenge user requirements – outline/demonstrate benefit of a smaller BEx query! • Review server resources, consider distribution and/or configuration changes • If necessary, raise a Support case to highlight inefficient/incorrectproduct behaviour 7 Take Home Messages Cont.
- 64. “Having the strong technical capability of Xoomworks behind us has enabled us to prove what SAP BusinessObjectscan achieve, and that’s how we’ve managed to build up and maintain a single platform concept for all our management information.” The Solution Delivery Manager for a major petro-chemical company. “Their consultants were very diligent, spending a lot of time working on the material for the training so that they were very well prepared for the sessions.” Raf Wayne, CTO, Neural Technologies Limited.
- 65. THANK YOU To find out more: Visit our website at www.xoomworks.com Email us at [email protected]
- 66. Resource Library: Mentioned links · Best Practices for Web Intelligence Report Design - Slide 24: http://scn.sap.com/docs/DOC-58532 · SAP Note 1906557 – Tomcat crash due to EXCEPTION_ACCESS_VIOLATIONin the zip.dll with Java_java_util_zip_ZipEntry_initFields - Slide 42: http://service.sap.com/sap/support/notes/1906557 * * Requires login credentials to the SAP Service Marketplace
- 67. Resource Library: Further information · Toby Johnston, “BI Platform E2E tracing with Solution Manager E2E Trace Analysis” (SCN, September 2013). · Matthew Shaw, “Standard BI Platform log tracing” (SCN, January 2015). · SAP, “2103024 - *** MASTER NOTE *** How To Trace Business Objects 4.0 and 4.1 (Servers and Clients)” (SAP, December 2015). * · Toby Johnston, “Wily Introscope for BI Platform 4.0: Why it is important and how to get started” (SCN, August 2012). · “Official Product Tutorials – SAP BusinessObjects Business Intelligence Platform 4.x” (SCN, July 2015). - Process flows for SAP BusinessObjects 4.x * Requires login credentials to the SAP Service Marketplace