SlideShare a Scribd company logo
2
How To Successfully Implement
Self-Service Analytics
3
Hundreds of resources
Visit the Resource Library
on the Senturus website
to download this presentation
and explore other assets:
senturus.com/resources
3
4
Introductions
Michael Weinhauer
BI Consultant
Senturus, Inc.
4
Principle BI Analytics Architect
Senturus, Inc.
Pedro Ining
Agenda
• Introductions
• Self-service analytics
- Self-service defined
- Misconceptions
- Best practices
- Requirements
- Cognos architectures
• Senturus overview
• Additional resources
• Q&A
5
Enjoy the full webinar presentation
This slide deck is from the webinar How To Successfully
Implement Self-Service Analytics
To view the FREE video recording and download this deck,
go to https://senturus.com/resources/how-to-successfully-
implement-self-service-analytics
6
Explosive growth in self-service BI
7
What is self-service BI?
Self-service BI allows business users to access more
data sources on their own, model their own data and then
create reports or dashboard visualizations with very little
help from IT.
This can lead to faster and more agile data analytics as
compared with traditional BI development.
8
The promise of self-service
• Giving business users direct access to data and reporting tools
will remove the reporting burden from IT
• Analytical decisions can happen more quickly in an agile
fashion, applying actionable insights will drive business growth
• New modern BI tools will provide more visual, insightful and
automated analysis
But then why do so many self-service BI efforts go wrong?
9
Common misconceptions
• Install and build it; we’re done
• Eliminates the need for IT
• A modern self-service BI tool will be a successful project
• User’s will automatically understand how to use the tool
10
Focus areas for implementation
11
Best practices Requirements
discovery
Cognos self-
service
architectures
Best practices
• Data governance
• Requirements ”discovery”
• Semantic layer
• Training
• Performance tuning
• Recognize not all areas are suited self-service
12
Requirements
Discover vs. gathering
• Determine and understand the client’s goal
• Understand the current business process or workflow
• Discuss existing pain points
• Consolidate with a user story
13
Requirements
Determine and understand the client’s goal
• A discussion that is independent of the BI tool’s features
• A user’s goal is often in lock step with their job
responsibilities
14
Requirements
15
Understand the user’s business process or workflow
Requirements
Understand user issues with their current workflow
16
Requirements
Create a user story based on your findings
17
John is an HR analyst. He has been requested to analyze workforce FTE Headcount. The company periodically
reviews the current workforce to determine where it currently stands and how FTE headcount compares to the
same period last year. His management team would also like to see the tenure of the workforce. They are
interested in seeing the breakdown by organization and location.
John has been working with the current version of the Cognos Headcount package. John sat with some analysts to
understand the components of the package and how to query the package. He knows enough to be able to extract
data for reporting in Excel. He has never been able to calculate the change in FTE headcount Year-over-Year in
Cognos and finds the task is easier if he just extracts various slices of the data into Excel for final reporting.
In addition, John needed to integrate other data sets into his final reporting that are not currently available in the
headcount package. Data points such as employee’s location and his service date are not available. He has been
able to retrieve files directly from PeopleSoft and integrates that data into his final report.
Based on the various data extracts, John prepares a final report for his management which is primarily made up of
Excel sheets in a workbook.
Like what you see?
To view the video recording and download the slide deck go
to https://senturus.com/resources/how-to-successfully-
implement-self-service-analytics
Visit our website to access our library of free BI knowledge
resources including events, blogs, demos, whitepapers, other
on-demand webinars and our dashboard gallery
https://senturus.com/senturus-resources/
18
Cognos self-service
semantic layer architectures
19
Cognos 11 key self-service enablers
• FM packages (classic but still useful)
• Data modules – newest modeling tool for end users
• Data sets – ability for users to extract subsets of data
• Dashboards – getting easier with each release
• Reporting – workhorse of analytic tool set
20
IT driven enterprise model
21
IT driven with Cognos data modules
22
End user driven model
23
Hybrid model
24
Summary
• Self-service BI implementations really require a tight partnership
with your business sponsors
• Involve your business sponsors early in the game
• The snazzy BI tool will not mean automatic success
• But a good tool that is implemented properly will be a good
foundation
Technology + Business Partnership = Success
25
Additional resources
On-demand webinar: Cognos Framework Manager vs. Data
Modules
https://senturus.com/resources/cognos-framework-manager-vs-data-modules/
Blog: Cognos Framework Manager vs. Data Modules
https://senturus.com/blog/cognos-framework-manager-vs-data-modules/
On-demand webinar: Cognos Data Modules New Capabilities
•https://senturus.com/resources/cognos-data-modules-new-capabilities/
26
Like what you see?
To view the video recording and download the slide deck go
to https://senturus.com/resources/how-to-successfully-
implement-self-service-analytics
Visit our website to access our library of free BI knowledge
resources including events, blogs, demos, whitepapers, other
on-demand webinars and our dashboard gallery
https://senturus.com/senturus-resources/
27
The authority in
business intelligence
Exclusively focused on BI,
Senturus is unrivaled in its
expertise across the BI stack.
28
Decisions and actionsBusiness needs
Bridging the data and decisioning gap
29
Analysis-ready data
Full spectrum BI services
•Dashboards, reporting and visualizations
•Data preparation and modern data warehousing
•Hybrid BI environments (migrations, security, etc.)
•Software to enable bimodal BI and platform migrations
•BI support retainer (expertise on demand)
•Training and mentoring
30
A long, strong history of success
•19+ years
•1300+ clients
•2500+ projects
31
Expand your
knowledge
Find more resources
on the Senturus website:
senturus.com/senturus-resources
32
Complete BI training
33
Instructor-led online courses Self-paced learning
MentoringTailored group sessions
More additional resources
34
Insider viewpointsTechnical tipsUnbiased product reviews
Product demos Upcoming eventsMore on this subject
© 2020 by Senturus, Inc. This presentation may not be reused or distributed without the written consent of Senturus, Inc.
www.senturus.com 888 601 6010 info@senturus.com
Thank You
Ad

More Related Content

Similar to How to Successfully Implement Cognos Self-Service (20)

Every kpi dashboard list
Every kpi dashboard listEvery kpi dashboard list
Every kpi dashboard list
zainksa
 
5 Data Integration Options for Microsoft Power BI
5 Data Integration Options for Microsoft Power BI5 Data Integration Options for Microsoft Power BI
5 Data Integration Options for Microsoft Power BI
Senturus
 
Sap business Objects certification note paper1
Sap business Objects certification note paper1Sap business Objects certification note paper1
Sap business Objects certification note paper1
Sandeep Sharma IIMK Smart City,IoT,Bigdata,Cloud,BI,DW
 
Power bi proof of concept
Power bi proof of conceptPower bi proof of concept
Power bi proof of concept
harrow812arhed
 
The Ultimate Guide To Embedded Analytics
The Ultimate Guide To Embedded Analytics The Ultimate Guide To Embedded Analytics
The Ultimate Guide To Embedded Analytics
Poojitha B
 
Finally! A Way to Make SharePoint Useful
Finally! A Way to Make SharePoint UsefulFinally! A Way to Make SharePoint Useful
Finally! A Way to Make SharePoint Useful
AIIM International
 
Business Intelligence is more than just pretty visuals
Business Intelligence is more than just pretty visualsBusiness Intelligence is more than just pretty visuals
Business Intelligence is more than just pretty visuals
Vincent Woon
 
Power BI vs Tableau - An Overview from EPC Group.pptx
Power BI vs Tableau - An Overview from EPC Group.pptxPower BI vs Tableau - An Overview from EPC Group.pptx
Power BI vs Tableau - An Overview from EPC Group.pptx
EPC Group
 
(Worthy & Heatley Networking Kimberly N. WorthyCIS 4.docx
(Worthy & Heatley Networking Kimberly N. WorthyCIS 4.docx(Worthy & Heatley Networking Kimberly N. WorthyCIS 4.docx
(Worthy & Heatley Networking Kimberly N. WorthyCIS 4.docx
mercysuttle
 
DBA Role Shift in a DevOps World
DBA Role Shift in a DevOps WorldDBA Role Shift in a DevOps World
DBA Role Shift in a DevOps World
Datavail
 
Back to Basics: How to Modernize Reports and Dashboards
Back to Basics: How to Modernize Reports and DashboardsBack to Basics: How to Modernize Reports and Dashboards
Back to Basics: How to Modernize Reports and Dashboards
Inside Analysis
 
An In-Depth Look at Pinpointing and Addressing Sources of Performance Problem...
An In-Depth Look at Pinpointing and Addressing Sources of Performance Problem...An In-Depth Look at Pinpointing and Addressing Sources of Performance Problem...
An In-Depth Look at Pinpointing and Addressing Sources of Performance Problem...
BI Brainz
 
Houston UiPath Community - Document Understanding Solution Accelerators
Houston UiPath Community - Document Understanding Solution AcceleratorsHouston UiPath Community - Document Understanding Solution Accelerators
Houston UiPath Community - Document Understanding Solution Accelerators
DianaGray10
 
Agile BI Demystified
Agile BI DemystifiedAgile BI Demystified
Agile BI Demystified
Senturus
 
Measuring User Adoption of Your Cognos BI System
Measuring User Adoption of Your Cognos BI SystemMeasuring User Adoption of Your Cognos BI System
Measuring User Adoption of Your Cognos BI System
Senturus
 
Planning for a Power BI Enterprise Deployment
Planning for a Power BI Enterprise DeploymentPlanning for a Power BI Enterprise Deployment
Planning for a Power BI Enterprise Deployment
Senturus
 
8 Steps to BI Success - Choosing The Ideal Business Intelligence Solution
8 Steps to BI Success - Choosing The Ideal Business Intelligence Solution8 Steps to BI Success - Choosing The Ideal Business Intelligence Solution
8 Steps to BI Success - Choosing The Ideal Business Intelligence Solution
Christian Ofori-Boateng
 
Using Cognos Analytics Explorations
Using Cognos Analytics ExplorationsUsing Cognos Analytics Explorations
Using Cognos Analytics Explorations
Senturus
 
Cognos Analytics v11: A Closer Look
Cognos Analytics v11: A Closer Look Cognos Analytics v11: A Closer Look
Cognos Analytics v11: A Closer Look
Senturus
 
Business Intelligence Module 5
Business Intelligence Module 5Business Intelligence Module 5
Business Intelligence Module 5
Home
 
Every kpi dashboard list
Every kpi dashboard listEvery kpi dashboard list
Every kpi dashboard list
zainksa
 
5 Data Integration Options for Microsoft Power BI
5 Data Integration Options for Microsoft Power BI5 Data Integration Options for Microsoft Power BI
5 Data Integration Options for Microsoft Power BI
Senturus
 
Power bi proof of concept
Power bi proof of conceptPower bi proof of concept
Power bi proof of concept
harrow812arhed
 
The Ultimate Guide To Embedded Analytics
The Ultimate Guide To Embedded Analytics The Ultimate Guide To Embedded Analytics
The Ultimate Guide To Embedded Analytics
Poojitha B
 
Finally! A Way to Make SharePoint Useful
Finally! A Way to Make SharePoint UsefulFinally! A Way to Make SharePoint Useful
Finally! A Way to Make SharePoint Useful
AIIM International
 
Business Intelligence is more than just pretty visuals
Business Intelligence is more than just pretty visualsBusiness Intelligence is more than just pretty visuals
Business Intelligence is more than just pretty visuals
Vincent Woon
 
Power BI vs Tableau - An Overview from EPC Group.pptx
Power BI vs Tableau - An Overview from EPC Group.pptxPower BI vs Tableau - An Overview from EPC Group.pptx
Power BI vs Tableau - An Overview from EPC Group.pptx
EPC Group
 
(Worthy & Heatley Networking Kimberly N. WorthyCIS 4.docx
(Worthy & Heatley Networking Kimberly N. WorthyCIS 4.docx(Worthy & Heatley Networking Kimberly N. WorthyCIS 4.docx
(Worthy & Heatley Networking Kimberly N. WorthyCIS 4.docx
mercysuttle
 
DBA Role Shift in a DevOps World
DBA Role Shift in a DevOps WorldDBA Role Shift in a DevOps World
DBA Role Shift in a DevOps World
Datavail
 
Back to Basics: How to Modernize Reports and Dashboards
Back to Basics: How to Modernize Reports and DashboardsBack to Basics: How to Modernize Reports and Dashboards
Back to Basics: How to Modernize Reports and Dashboards
Inside Analysis
 
An In-Depth Look at Pinpointing and Addressing Sources of Performance Problem...
An In-Depth Look at Pinpointing and Addressing Sources of Performance Problem...An In-Depth Look at Pinpointing and Addressing Sources of Performance Problem...
An In-Depth Look at Pinpointing and Addressing Sources of Performance Problem...
BI Brainz
 
Houston UiPath Community - Document Understanding Solution Accelerators
Houston UiPath Community - Document Understanding Solution AcceleratorsHouston UiPath Community - Document Understanding Solution Accelerators
Houston UiPath Community - Document Understanding Solution Accelerators
DianaGray10
 
Agile BI Demystified
Agile BI DemystifiedAgile BI Demystified
Agile BI Demystified
Senturus
 
Measuring User Adoption of Your Cognos BI System
Measuring User Adoption of Your Cognos BI SystemMeasuring User Adoption of Your Cognos BI System
Measuring User Adoption of Your Cognos BI System
Senturus
 
Planning for a Power BI Enterprise Deployment
Planning for a Power BI Enterprise DeploymentPlanning for a Power BI Enterprise Deployment
Planning for a Power BI Enterprise Deployment
Senturus
 
8 Steps to BI Success - Choosing The Ideal Business Intelligence Solution
8 Steps to BI Success - Choosing The Ideal Business Intelligence Solution8 Steps to BI Success - Choosing The Ideal Business Intelligence Solution
8 Steps to BI Success - Choosing The Ideal Business Intelligence Solution
Christian Ofori-Boateng
 
Using Cognos Analytics Explorations
Using Cognos Analytics ExplorationsUsing Cognos Analytics Explorations
Using Cognos Analytics Explorations
Senturus
 
Cognos Analytics v11: A Closer Look
Cognos Analytics v11: A Closer Look Cognos Analytics v11: A Closer Look
Cognos Analytics v11: A Closer Look
Senturus
 
Business Intelligence Module 5
Business Intelligence Module 5Business Intelligence Module 5
Business Intelligence Module 5
Home
 

More from Senturus (20)

Power BI Gateway: Understanding, Installing, Configuring
Power BI Gateway: Understanding, Installing, ConfiguringPower BI Gateway: Understanding, Installing, Configuring
Power BI Gateway: Understanding, Installing, Configuring
Senturus
 
Cognos Performance Tuning Tips & Tricks
Cognos Performance Tuning Tips & TricksCognos Performance Tuning Tips & Tricks
Cognos Performance Tuning Tips & Tricks
Senturus
 
Power Automate for Power BI: Getting Started
Power Automate for Power BI: Getting StartedPower Automate for Power BI: Getting Started
Power Automate for Power BI: Getting Started
Senturus
 
Tips for Installing Cognos Analytics 11.2.1x
Tips for Installing Cognos Analytics 11.2.1xTips for Installing Cognos Analytics 11.2.1x
Tips for Installing Cognos Analytics 11.2.1x
Senturus
 
How to Prepare for a BI Migration
How to Prepare for a BI MigrationHow to Prepare for a BI Migration
How to Prepare for a BI Migration
Senturus
 
4 Common Analytics Reporting Errors to Avoid
4 Common Analytics Reporting Errors to Avoid4 Common Analytics Reporting Errors to Avoid
4 Common Analytics Reporting Errors to Avoid
Senturus
 
Extending Power BI Functionality with R
Extending Power BI Functionality with RExtending Power BI Functionality with R
Extending Power BI Functionality with R
Senturus
 
Take Control of Your Cloud
Take Control of Your CloudTake Control of Your Cloud
Take Control of Your Cloud
Senturus
 
Using Python with Power BI
Using Python with Power BIUsing Python with Power BI
Using Python with Power BI
Senturus
 
Streamline Cognos Migrations & Consolidations
Streamline Cognos Migrations & ConsolidationsStreamline Cognos Migrations & Consolidations
Streamline Cognos Migrations & Consolidations
Senturus
 
What’s New in Cognos 11.2.1
What’s New in Cognos 11.2.1What’s New in Cognos 11.2.1
What’s New in Cognos 11.2.1
Senturus
 
Power BI Report Builder & Paginated Reports
Power BI Report Builder & Paginated Reports Power BI Report Builder & Paginated Reports
Power BI Report Builder & Paginated Reports
Senturus
 
Tableau: 6 Ways to Publish & Share Dashboards
Tableau: 6 Ways to Publish & Share DashboardsTableau: 6 Ways to Publish & Share Dashboards
Tableau: 6 Ways to Publish & Share Dashboards
Senturus
 
Cognos Analytics 11.2 New Features
Cognos Analytics 11.2 New FeaturesCognos Analytics 11.2 New Features
Cognos Analytics 11.2 New Features
Senturus
 
Azure Synapse vs. Snowflake: The Data Warehouse Dating Game
Azure Synapse vs. Snowflake: The Data Warehouse Dating GameAzure Synapse vs. Snowflake: The Data Warehouse Dating Game
Azure Synapse vs. Snowflake: The Data Warehouse Dating Game
Senturus
 
Secrets of High Performing Report Development Teams
Secrets of High Performing Report Development TeamsSecrets of High Performing Report Development Teams
Secrets of High Performing Report Development Teams
Senturus
 
Power BI: Data Cleansing & Power Query Editor
Power BI: Data Cleansing & Power Query EditorPower BI: Data Cleansing & Power Query Editor
Power BI: Data Cleansing & Power Query Editor
Senturus
 
Cognos Data Module Architectures & Use Cases
Cognos Data Module Architectures & Use CasesCognos Data Module Architectures & Use Cases
Cognos Data Module Architectures & Use Cases
Senturus
 
Getting Started with (Just Enough) Data Governance
Getting Started with (Just Enough) Data GovernanceGetting Started with (Just Enough) Data Governance
Getting Started with (Just Enough) Data Governance
Senturus
 
10 Reasons Snowflake Is Great for Analytics
10 Reasons Snowflake Is Great for Analytics10 Reasons Snowflake Is Great for Analytics
10 Reasons Snowflake Is Great for Analytics
Senturus
 
Power BI Gateway: Understanding, Installing, Configuring
Power BI Gateway: Understanding, Installing, ConfiguringPower BI Gateway: Understanding, Installing, Configuring
Power BI Gateway: Understanding, Installing, Configuring
Senturus
 
Cognos Performance Tuning Tips & Tricks
Cognos Performance Tuning Tips & TricksCognos Performance Tuning Tips & Tricks
Cognos Performance Tuning Tips & Tricks
Senturus
 
Power Automate for Power BI: Getting Started
Power Automate for Power BI: Getting StartedPower Automate for Power BI: Getting Started
Power Automate for Power BI: Getting Started
Senturus
 
Tips for Installing Cognos Analytics 11.2.1x
Tips for Installing Cognos Analytics 11.2.1xTips for Installing Cognos Analytics 11.2.1x
Tips for Installing Cognos Analytics 11.2.1x
Senturus
 
How to Prepare for a BI Migration
How to Prepare for a BI MigrationHow to Prepare for a BI Migration
How to Prepare for a BI Migration
Senturus
 
4 Common Analytics Reporting Errors to Avoid
4 Common Analytics Reporting Errors to Avoid4 Common Analytics Reporting Errors to Avoid
4 Common Analytics Reporting Errors to Avoid
Senturus
 
Extending Power BI Functionality with R
Extending Power BI Functionality with RExtending Power BI Functionality with R
Extending Power BI Functionality with R
Senturus
 
Take Control of Your Cloud
Take Control of Your CloudTake Control of Your Cloud
Take Control of Your Cloud
Senturus
 
Using Python with Power BI
Using Python with Power BIUsing Python with Power BI
Using Python with Power BI
Senturus
 
Streamline Cognos Migrations & Consolidations
Streamline Cognos Migrations & ConsolidationsStreamline Cognos Migrations & Consolidations
Streamline Cognos Migrations & Consolidations
Senturus
 
What’s New in Cognos 11.2.1
What’s New in Cognos 11.2.1What’s New in Cognos 11.2.1
What’s New in Cognos 11.2.1
Senturus
 
Power BI Report Builder & Paginated Reports
Power BI Report Builder & Paginated Reports Power BI Report Builder & Paginated Reports
Power BI Report Builder & Paginated Reports
Senturus
 
Tableau: 6 Ways to Publish & Share Dashboards
Tableau: 6 Ways to Publish & Share DashboardsTableau: 6 Ways to Publish & Share Dashboards
Tableau: 6 Ways to Publish & Share Dashboards
Senturus
 
Cognos Analytics 11.2 New Features
Cognos Analytics 11.2 New FeaturesCognos Analytics 11.2 New Features
Cognos Analytics 11.2 New Features
Senturus
 
Azure Synapse vs. Snowflake: The Data Warehouse Dating Game
Azure Synapse vs. Snowflake: The Data Warehouse Dating GameAzure Synapse vs. Snowflake: The Data Warehouse Dating Game
Azure Synapse vs. Snowflake: The Data Warehouse Dating Game
Senturus
 
Secrets of High Performing Report Development Teams
Secrets of High Performing Report Development TeamsSecrets of High Performing Report Development Teams
Secrets of High Performing Report Development Teams
Senturus
 
Power BI: Data Cleansing & Power Query Editor
Power BI: Data Cleansing & Power Query EditorPower BI: Data Cleansing & Power Query Editor
Power BI: Data Cleansing & Power Query Editor
Senturus
 
Cognos Data Module Architectures & Use Cases
Cognos Data Module Architectures & Use CasesCognos Data Module Architectures & Use Cases
Cognos Data Module Architectures & Use Cases
Senturus
 
Getting Started with (Just Enough) Data Governance
Getting Started with (Just Enough) Data GovernanceGetting Started with (Just Enough) Data Governance
Getting Started with (Just Enough) Data Governance
Senturus
 
10 Reasons Snowflake Is Great for Analytics
10 Reasons Snowflake Is Great for Analytics10 Reasons Snowflake Is Great for Analytics
10 Reasons Snowflake Is Great for Analytics
Senturus
 
Ad

Recently uploaded (20)

Medical Dataset including visualizations
Medical Dataset including visualizationsMedical Dataset including visualizations
Medical Dataset including visualizations
vishrut8750588758
 
VKS-Python Basics for Beginners and advance.pptx
VKS-Python Basics for Beginners and advance.pptxVKS-Python Basics for Beginners and advance.pptx
VKS-Python Basics for Beginners and advance.pptx
Vinod Srivastava
 
IAS-slides2-ia-aaaaaaaaaaain-business.pdf
IAS-slides2-ia-aaaaaaaaaaain-business.pdfIAS-slides2-ia-aaaaaaaaaaain-business.pdf
IAS-slides2-ia-aaaaaaaaaaain-business.pdf
mcgardenlevi9
 
Conic Sectionfaggavahabaayhahahahahs.pptx
Conic Sectionfaggavahabaayhahahahahs.pptxConic Sectionfaggavahabaayhahahahahs.pptx
Conic Sectionfaggavahabaayhahahahahs.pptx
taiwanesechetan
 
Minions Want to eat presentacion muy linda
Minions Want to eat presentacion muy lindaMinions Want to eat presentacion muy linda
Minions Want to eat presentacion muy linda
CarlaAndradesSoler1
 
Deloitte Analytics - Applying Process Mining in an audit context
Deloitte Analytics - Applying Process Mining in an audit contextDeloitte Analytics - Applying Process Mining in an audit context
Deloitte Analytics - Applying Process Mining in an audit context
Process mining Evangelist
 
Data Analytics Overview and its applications
Data Analytics Overview and its applicationsData Analytics Overview and its applications
Data Analytics Overview and its applications
JanmejayaMishra7
 
Developing Security Orchestration, Automation, and Response Applications
Developing Security Orchestration, Automation, and Response ApplicationsDeveloping Security Orchestration, Automation, and Response Applications
Developing Security Orchestration, Automation, and Response Applications
VICTOR MAESTRE RAMIREZ
 
DPR_Expert_Recruitment_notice_Revised.pdf
DPR_Expert_Recruitment_notice_Revised.pdfDPR_Expert_Recruitment_notice_Revised.pdf
DPR_Expert_Recruitment_notice_Revised.pdf
inmishra17121973
 
chapter3 Central Tendency statistics.ppt
chapter3 Central Tendency statistics.pptchapter3 Central Tendency statistics.ppt
chapter3 Central Tendency statistics.ppt
justinebandajbn
 
Just-In-Timeasdfffffffghhhhhhhhhhj Systems.ppt
Just-In-Timeasdfffffffghhhhhhhhhhj Systems.pptJust-In-Timeasdfffffffghhhhhhhhhhj Systems.ppt
Just-In-Timeasdfffffffghhhhhhhhhhj Systems.ppt
ssuser5f8f49
 
Flip flop presenation-Presented By Mubahir khan.pptx
Flip flop presenation-Presented By Mubahir khan.pptxFlip flop presenation-Presented By Mubahir khan.pptx
Flip flop presenation-Presented By Mubahir khan.pptx
mubashirkhan45461
 
Day 1 - Lab 1 Reconnaissance Scanning with NMAP, Vulnerability Assessment wit...
Day 1 - Lab 1 Reconnaissance Scanning with NMAP, Vulnerability Assessment wit...Day 1 - Lab 1 Reconnaissance Scanning with NMAP, Vulnerability Assessment wit...
Day 1 - Lab 1 Reconnaissance Scanning with NMAP, Vulnerability Assessment wit...
Abodahab
 
FPET_Implementation_2_MA to 360 Engage Direct.pptx
FPET_Implementation_2_MA to 360 Engage Direct.pptxFPET_Implementation_2_MA to 360 Engage Direct.pptx
FPET_Implementation_2_MA to 360 Engage Direct.pptx
ssuser4ef83d
 
Perencanaan Pengendalian-Proyek-Konstruksi-MS-PROJECT.pptx
Perencanaan Pengendalian-Proyek-Konstruksi-MS-PROJECT.pptxPerencanaan Pengendalian-Proyek-Konstruksi-MS-PROJECT.pptx
Perencanaan Pengendalian-Proyek-Konstruksi-MS-PROJECT.pptx
PareaRusan
 
Thingyan is now a global treasure! See how people around the world are search...
Thingyan is now a global treasure! See how people around the world are search...Thingyan is now a global treasure! See how people around the world are search...
Thingyan is now a global treasure! See how people around the world are search...
Pixellion
 
Template_A3nnnnnnnnnnnnnnnnnnnnnnnnnnnnnnnnnnn
Template_A3nnnnnnnnnnnnnnnnnnnnnnnnnnnnnnnnnnnTemplate_A3nnnnnnnnnnnnnnnnnnnnnnnnnnnnnnnnnnn
Template_A3nnnnnnnnnnnnnnnnnnnnnnnnnnnnnnnnnnn
cegiver630
 
LLM finetuning for multiple choice google bert
LLM finetuning for multiple choice google bertLLM finetuning for multiple choice google bert
LLM finetuning for multiple choice google bert
ChadapornK
 
Classification_in_Machinee_Learning.pptx
Classification_in_Machinee_Learning.pptxClassification_in_Machinee_Learning.pptx
Classification_in_Machinee_Learning.pptx
wencyjorda88
 
04302025_CCC TUG_DataVista: The Design Story
04302025_CCC TUG_DataVista: The Design Story04302025_CCC TUG_DataVista: The Design Story
04302025_CCC TUG_DataVista: The Design Story
ccctableauusergroup
 
Medical Dataset including visualizations
Medical Dataset including visualizationsMedical Dataset including visualizations
Medical Dataset including visualizations
vishrut8750588758
 
VKS-Python Basics for Beginners and advance.pptx
VKS-Python Basics for Beginners and advance.pptxVKS-Python Basics for Beginners and advance.pptx
VKS-Python Basics for Beginners and advance.pptx
Vinod Srivastava
 
IAS-slides2-ia-aaaaaaaaaaain-business.pdf
IAS-slides2-ia-aaaaaaaaaaain-business.pdfIAS-slides2-ia-aaaaaaaaaaain-business.pdf
IAS-slides2-ia-aaaaaaaaaaain-business.pdf
mcgardenlevi9
 
Conic Sectionfaggavahabaayhahahahahs.pptx
Conic Sectionfaggavahabaayhahahahahs.pptxConic Sectionfaggavahabaayhahahahahs.pptx
Conic Sectionfaggavahabaayhahahahahs.pptx
taiwanesechetan
 
Minions Want to eat presentacion muy linda
Minions Want to eat presentacion muy lindaMinions Want to eat presentacion muy linda
Minions Want to eat presentacion muy linda
CarlaAndradesSoler1
 
Deloitte Analytics - Applying Process Mining in an audit context
Deloitte Analytics - Applying Process Mining in an audit contextDeloitte Analytics - Applying Process Mining in an audit context
Deloitte Analytics - Applying Process Mining in an audit context
Process mining Evangelist
 
Data Analytics Overview and its applications
Data Analytics Overview and its applicationsData Analytics Overview and its applications
Data Analytics Overview and its applications
JanmejayaMishra7
 
Developing Security Orchestration, Automation, and Response Applications
Developing Security Orchestration, Automation, and Response ApplicationsDeveloping Security Orchestration, Automation, and Response Applications
Developing Security Orchestration, Automation, and Response Applications
VICTOR MAESTRE RAMIREZ
 
DPR_Expert_Recruitment_notice_Revised.pdf
DPR_Expert_Recruitment_notice_Revised.pdfDPR_Expert_Recruitment_notice_Revised.pdf
DPR_Expert_Recruitment_notice_Revised.pdf
inmishra17121973
 
chapter3 Central Tendency statistics.ppt
chapter3 Central Tendency statistics.pptchapter3 Central Tendency statistics.ppt
chapter3 Central Tendency statistics.ppt
justinebandajbn
 
Just-In-Timeasdfffffffghhhhhhhhhhj Systems.ppt
Just-In-Timeasdfffffffghhhhhhhhhhj Systems.pptJust-In-Timeasdfffffffghhhhhhhhhhj Systems.ppt
Just-In-Timeasdfffffffghhhhhhhhhhj Systems.ppt
ssuser5f8f49
 
Flip flop presenation-Presented By Mubahir khan.pptx
Flip flop presenation-Presented By Mubahir khan.pptxFlip flop presenation-Presented By Mubahir khan.pptx
Flip flop presenation-Presented By Mubahir khan.pptx
mubashirkhan45461
 
Day 1 - Lab 1 Reconnaissance Scanning with NMAP, Vulnerability Assessment wit...
Day 1 - Lab 1 Reconnaissance Scanning with NMAP, Vulnerability Assessment wit...Day 1 - Lab 1 Reconnaissance Scanning with NMAP, Vulnerability Assessment wit...
Day 1 - Lab 1 Reconnaissance Scanning with NMAP, Vulnerability Assessment wit...
Abodahab
 
FPET_Implementation_2_MA to 360 Engage Direct.pptx
FPET_Implementation_2_MA to 360 Engage Direct.pptxFPET_Implementation_2_MA to 360 Engage Direct.pptx
FPET_Implementation_2_MA to 360 Engage Direct.pptx
ssuser4ef83d
 
Perencanaan Pengendalian-Proyek-Konstruksi-MS-PROJECT.pptx
Perencanaan Pengendalian-Proyek-Konstruksi-MS-PROJECT.pptxPerencanaan Pengendalian-Proyek-Konstruksi-MS-PROJECT.pptx
Perencanaan Pengendalian-Proyek-Konstruksi-MS-PROJECT.pptx
PareaRusan
 
Thingyan is now a global treasure! See how people around the world are search...
Thingyan is now a global treasure! See how people around the world are search...Thingyan is now a global treasure! See how people around the world are search...
Thingyan is now a global treasure! See how people around the world are search...
Pixellion
 
Template_A3nnnnnnnnnnnnnnnnnnnnnnnnnnnnnnnnnnn
Template_A3nnnnnnnnnnnnnnnnnnnnnnnnnnnnnnnnnnnTemplate_A3nnnnnnnnnnnnnnnnnnnnnnnnnnnnnnnnnnn
Template_A3nnnnnnnnnnnnnnnnnnnnnnnnnnnnnnnnnnn
cegiver630
 
LLM finetuning for multiple choice google bert
LLM finetuning for multiple choice google bertLLM finetuning for multiple choice google bert
LLM finetuning for multiple choice google bert
ChadapornK
 
Classification_in_Machinee_Learning.pptx
Classification_in_Machinee_Learning.pptxClassification_in_Machinee_Learning.pptx
Classification_in_Machinee_Learning.pptx
wencyjorda88
 
04302025_CCC TUG_DataVista: The Design Story
04302025_CCC TUG_DataVista: The Design Story04302025_CCC TUG_DataVista: The Design Story
04302025_CCC TUG_DataVista: The Design Story
ccctableauusergroup
 
Ad

How to Successfully Implement Cognos Self-Service

  • 1. 2 How To Successfully Implement Self-Service Analytics
  • 2. 3 Hundreds of resources Visit the Resource Library on the Senturus website to download this presentation and explore other assets: senturus.com/resources 3
  • 3. 4 Introductions Michael Weinhauer BI Consultant Senturus, Inc. 4 Principle BI Analytics Architect Senturus, Inc. Pedro Ining
  • 4. Agenda • Introductions • Self-service analytics - Self-service defined - Misconceptions - Best practices - Requirements - Cognos architectures • Senturus overview • Additional resources • Q&A 5
  • 5. Enjoy the full webinar presentation This slide deck is from the webinar How To Successfully Implement Self-Service Analytics To view the FREE video recording and download this deck, go to https://senturus.com/resources/how-to-successfully- implement-self-service-analytics 6
  • 6. Explosive growth in self-service BI 7
  • 7. What is self-service BI? Self-service BI allows business users to access more data sources on their own, model their own data and then create reports or dashboard visualizations with very little help from IT. This can lead to faster and more agile data analytics as compared with traditional BI development. 8
  • 8. The promise of self-service • Giving business users direct access to data and reporting tools will remove the reporting burden from IT • Analytical decisions can happen more quickly in an agile fashion, applying actionable insights will drive business growth • New modern BI tools will provide more visual, insightful and automated analysis But then why do so many self-service BI efforts go wrong? 9
  • 9. Common misconceptions • Install and build it; we’re done • Eliminates the need for IT • A modern self-service BI tool will be a successful project • User’s will automatically understand how to use the tool 10
  • 10. Focus areas for implementation 11 Best practices Requirements discovery Cognos self- service architectures
  • 11. Best practices • Data governance • Requirements ”discovery” • Semantic layer • Training • Performance tuning • Recognize not all areas are suited self-service 12
  • 12. Requirements Discover vs. gathering • Determine and understand the client’s goal • Understand the current business process or workflow • Discuss existing pain points • Consolidate with a user story 13
  • 13. Requirements Determine and understand the client’s goal • A discussion that is independent of the BI tool’s features • A user’s goal is often in lock step with their job responsibilities 14
  • 14. Requirements 15 Understand the user’s business process or workflow
  • 15. Requirements Understand user issues with their current workflow 16
  • 16. Requirements Create a user story based on your findings 17 John is an HR analyst. He has been requested to analyze workforce FTE Headcount. The company periodically reviews the current workforce to determine where it currently stands and how FTE headcount compares to the same period last year. His management team would also like to see the tenure of the workforce. They are interested in seeing the breakdown by organization and location. John has been working with the current version of the Cognos Headcount package. John sat with some analysts to understand the components of the package and how to query the package. He knows enough to be able to extract data for reporting in Excel. He has never been able to calculate the change in FTE headcount Year-over-Year in Cognos and finds the task is easier if he just extracts various slices of the data into Excel for final reporting. In addition, John needed to integrate other data sets into his final reporting that are not currently available in the headcount package. Data points such as employee’s location and his service date are not available. He has been able to retrieve files directly from PeopleSoft and integrates that data into his final report. Based on the various data extracts, John prepares a final report for his management which is primarily made up of Excel sheets in a workbook.
  • 17. Like what you see? To view the video recording and download the slide deck go to https://senturus.com/resources/how-to-successfully- implement-self-service-analytics Visit our website to access our library of free BI knowledge resources including events, blogs, demos, whitepapers, other on-demand webinars and our dashboard gallery https://senturus.com/senturus-resources/ 18
  • 19. Cognos 11 key self-service enablers • FM packages (classic but still useful) • Data modules – newest modeling tool for end users • Data sets – ability for users to extract subsets of data • Dashboards – getting easier with each release • Reporting – workhorse of analytic tool set 20
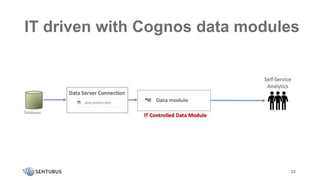
  • 21. IT driven with Cognos data modules 22
  • 22. End user driven model 23
  • 24. Summary • Self-service BI implementations really require a tight partnership with your business sponsors • Involve your business sponsors early in the game • The snazzy BI tool will not mean automatic success • But a good tool that is implemented properly will be a good foundation Technology + Business Partnership = Success 25
  • 25. Additional resources On-demand webinar: Cognos Framework Manager vs. Data Modules https://senturus.com/resources/cognos-framework-manager-vs-data-modules/ Blog: Cognos Framework Manager vs. Data Modules https://senturus.com/blog/cognos-framework-manager-vs-data-modules/ On-demand webinar: Cognos Data Modules New Capabilities •https://senturus.com/resources/cognos-data-modules-new-capabilities/ 26
  • 26. Like what you see? To view the video recording and download the slide deck go to https://senturus.com/resources/how-to-successfully- implement-self-service-analytics Visit our website to access our library of free BI knowledge resources including events, blogs, demos, whitepapers, other on-demand webinars and our dashboard gallery https://senturus.com/senturus-resources/ 27
  • 27. The authority in business intelligence Exclusively focused on BI, Senturus is unrivaled in its expertise across the BI stack. 28
  • 28. Decisions and actionsBusiness needs Bridging the data and decisioning gap 29 Analysis-ready data
  • 29. Full spectrum BI services •Dashboards, reporting and visualizations •Data preparation and modern data warehousing •Hybrid BI environments (migrations, security, etc.) •Software to enable bimodal BI and platform migrations •BI support retainer (expertise on demand) •Training and mentoring 30
  • 30. A long, strong history of success •19+ years •1300+ clients •2500+ projects 31
  • 31. Expand your knowledge Find more resources on the Senturus website: senturus.com/senturus-resources 32
  • 32. Complete BI training 33 Instructor-led online courses Self-paced learning MentoringTailored group sessions
  • 33. More additional resources 34 Insider viewpointsTechnical tipsUnbiased product reviews Product demos Upcoming eventsMore on this subject
  • 34. © 2020 by Senturus, Inc. This presentation may not be reused or distributed without the written consent of Senturus, Inc. www.senturus.com 888 601 6010 [email protected] Thank You

Editor's Notes

  • #3: The first question we usually get is “Can I get a copy of the presentation?” Absolutely! It’s available on Senturus.com. Select the Resources tab and then Resources Library. Or you can click the link that was just posted in the GoToWebinar Control panel. Be sure to bookmark the resource library. It has tons of valuable content addressing a wide variety of business analytics topics.
  • #4: Joining us today is…..Pedro Ining Pedro joined Senturus in 2010 and brings over 20 years of BI and data warehousing experience to his role. He has been instrumental in implementing data warehousing systems from scratch and has experienced the evolution of the BI industry through several iterations of BI products including Cognos, MicroStrategy and Tableau.
  • #5: Today’s agenda. After a brief introduction of the speakers, we’ll get right into the topic. Stay on after the presentation when we will We’ll then share useful links, provide a quick overview of Senturus and let you know of upcoming events. We’ll wrap with a live Q&A.
  • #10: Install and build it; we’re done Make the data available Install the BI Tool Eliminates the need for IT Complex data still needs to be modeled The BI tool is the doorway to access IT controlled data A modern self-service BI tool will be a successful project Your foundational data components need to be strong User’s will automatically understand how to use the tool Change Management and user training are critical
  • #12: Continued data governance of existing data warehouses Data warehouses will not go away simply because users can now do more with other sources of data. They will rely on the ‘curation’ of key enterprise data and IT governance will be a critical component of continue data quality. In fact self-service creates other governance/MDM Issues. Senturus has done another webinar on this topic – “Why bother with Data Governance suggest you look at this Requirements gathering techniques that go beyond the typical ‘what data do you need’ type of questions Requirements gathering will need to transform to more of a discovery process. Being able to get more insights from your meetings with users will allow you to create better self-service environments. Semantic Metadata layer that does not overburden users Efforts should be made to make semantic layer easier for users to use. User should not be overburdened with the responsibility of creating commonly used metrics, views, hierarchies etc. Simply serving up the tables and raw metrics to users will eventually cause users to declare that the tool is too hard to use and give up. Semantic Layer that can be modified and augmented with user local data Users will always have a need to integrate other data sources into their analytics. Exposing and training users to these new BI capabilities will allow them to exploit the BI tool to its maximum potential. BI Capability training Training that satisfy the needs of the different types of users is critical. A blanket training approach may not satisfy the needs of certain groups. Collaborating with your users and determining what type of training will allow users to become more comfortable with the BI system. Eventually, consumers may graduate to become producers as their capabilities increase. Continual Performance tuning and Usage Analytics Proactive IT system administration of the BI environment is critical to ensure a stable high performing system for the users. IT needs to have the ability to monitor utilization of all BI components and artifacts. Who is using the system and who is not using the system and why. It should have the ability to determine costly long-running queries so that they do not interrupt the work from other users. All Areas are not suited to self-service Finally, we must realize that there is a place for good old IT developed reports and dashboards. Many times professionally produced and data quality monitored report development is required. Reporting for regulatory and compliance purposes is one example.
  • #13: Gathering user requirements are an inherently difficult task. As data and BI professionals, we typically start requirement sessions by asking some questions like: What kind of reports do you need? Do you have samples of the reports? What data do you need, from where? What are the measures you will need? What are the hierarchies you will need? Do you need dashboards? These are all important questions that usually leads a BI professional into a more comfortable discussion of tables, fields, and reports. These types of questions basically stem from the base question of ‘What do you want or what do you want me to do for you?” and as we may have all discovered the following principle ‘Users don’t know or realize what they want from an analytics system’ which in turn generates several iterations of report building where the version 1 MVP product meets 50% of their needs and requires additional fine tuning. So how do we move beyond this basic rut of requirements gathering. We can start by investigating a bit more of their key goals, workflow and issues they are currently experiencing. This will influence our design of a self-service environment.
  • #14: This area should be discussed independent of a BI tool’s features. Ultimately, we need to determine what goals our user needs to accomplish. Often times an end user’s goals are in lock step with their job and job responsibilities. For example, within HR different levels of the organization would like to see analytics of AEP FTE Headcount. A discussion that is independent of the BI tool’s Features A user’s goal is often in lock step with their job responsibilities C-Level executive want to see a current snapshot of FTE headcount and how it compares to last year. What areas are growing the most and what areas are contracting. Director level management would like to analyze their current workforce and see existing exempt vs. non-exempt mix. Maybe discover what parts of their organization are experiencing the most attrition. Staffing managers would like to see the company’s location or organization which is experiencing the most growth. They need to plan and forecast future hiring plans and need data to help with this exercise.
  • #15: The user’s workflow usually starts with some sort of triggering event, an event that requires them to seek out more information and ends with an accomplished task. We must analyze this workflow and find out the details of the user’s decision-making process. Interacting with a predefined report or a dashboard can be part of that flow. What is the ‘trigger’ that causes the user to seek out more information? Is it a scheduled regulatory filing, a metric on a dashboard or report data that suddenly goes beyond a threshold? Does the user review a report or dashboard on a daily, weekly, or monthly schedule? What are the steps in the current workflow that contribute to a user’s decision making? Which steps cause the most friction and could maybe be consolidated or eliminated. Is the current process too reliant on canned reports, could self-service analytics help with answering follow-up questions?
  • #16: Discussing a user’s current workflow will naturally lead into a user’s analytics problem with that workflow. Document these issues as they will lead to design requirements in a self-service environment. Some typical issues that you may find include: User’s don’t trust the data – Find out what the data quality issues are. Are they actual data issues or maybe simple report logic errors? It takes a long time to get the answer – This could be a simple performance issue that can easily be resolved through some database tuning. It could also be the result of a more complicated end-user ‘data prep’ activity that could maybe be moved upstream into the BI tool. I can’t do a simple YTD in Cognos – Although this example is very specific, it points to a general problem in the semantic layer. Most likely the semantic metadata layer was only built to just simply present data. Calculations like YTD were left to the end-user to create. Embedding commonly used calculations in the semantic layer will allow users to concentrate on their analytics and not on creating commonly used calcs. Addressing user issues with the current analytic environment will get users excited about the benefits of self-service BI in Cognos. Many times, users will blame the entire BI tool as being too hard to use when the actual problem is the design of the semantic layer.
  • #17: It is time now to consolidate your learnings in a type of user story. The story describes the journey a user needs to go through to accomplish their goals. The story would describe as many possible scenarios that they may encounter.
  • #20: Dashboards The fact that Cognos still can’t compete with some of the visualization tools like Tableau/Power BI because of the portability and graphics. That is why we developed our Analytics Connector and Report Insights products Reporting Cognos’s key strengths. Tableau is great visualizations but lousy report writing tool
  • #21: IT gathers report requirements IT Develops the Framework manager model IT publishes Packages from the Framework Model IT creates standard reports from the package Users may create their own ad-hoc analysis reports from the package This model could still be an option especially for use cases where the concept of self-service is limited to just running IT developed reports. Usually, the semantic FM Model layer was developed for use by report developers. Semantics layers that are built using this paradigm are typically not well-suited for use by self-service users. The is approach could, however, still enhance a standard FM Package with self-service enhancements like pre-built calculations, better organization, or more specific package subsets of the original FM Model.
  • #22: A Cognos 11.1 twist to the IT Driven FM Package model, is a model that leverages the use of Cognos 11 Data Modules as a replacement for FM Packages. IT would still control the development of such a model, however, IT developers would now be able to leverage to new functionality enhancements that are part Cognos 11 Data Modules. Some key Data Module benefits include: Use of Relative Time modeling (YTD, MTD, PY MTD, etc.) Measure Binning & Data Grouping Built-In Data Cleansing Built-In Hierarchical Navigations paths Column Dependencies Integration of User Excel and CSV Files
  • #23: This model allows end-users to develop their own semantic layers. Many newer generation BI tools – Tableau, MS PowerBI, Qlik – promote this model as a way to provide high flexibility and speed. This model does not guarantee data consistency as end-users may model common database tables differently. It may eventually drive ‘multiple versions of the truth’ and is harder to maintain. But it does allow end-users to utilize the spreadsheet data that they have carefully curated through the years in an enterprise BI tool. The Cognos Analytics 11.1 platform allows for end-users to build their own semantics layer through the use of Data Modules. IT maintains the source databases or data warehouses Users utilize Cognos self-service modeling components to model the database for their specific requirements. Users may extract subsets of data from source databases via Cognos ‘Data Sets’ technology. These Data Sets are then integrated into Data Modules Users may upload their own privately maintained curated data that could be in the form of spreadsheets or text files This model gives the end-users the most flexibility. It generally would be used by ‘Power’ users that have gone through specific training and have done enough work with the tool understand the benefits. If the user will be modeling directly against a database, these users typically are already familiar with the tables and relationships. At AEP there are many users who already perform direct queries against OLTP database like STORMS. They could be ideal candidates for such a model. The use of user uploaded files can provide users instant ability to analyze their own curated data in Cognos. These uploaded files could – in some examples – be the only data that the user may need to model. The one drawback of this model could be issues with data consistency
  • #24: This model leverages the IT centrally maintained semantic layer but allows users to integrate their own data and enhance the existing IT metadata. In this scenario, only part of the semantic layer is built by IT and the rest could be built by end users. Professional Cognos developers can also build Hybrid models to satisfy specific requirements by end-users such as the loading of their own spreadsheet data. For large legacy Cognos organizations this model is a very appealing choice. Over the years many FM packages have been developed and they typically are very stable and have the data integrity blessing of the central IT organization. Because of the flexibility that Data Modules provide there can be very many permutations of this model. The diagram below shows some common use cases that could be used In the Hybrid Model, we integrate IT built FM Packages into the mix FM Packages can be used to create Data Sets which can then be used inside a Data Module You can directly access FM Package tables inside a Data Module but you will need to monitor any performance issues with this technique. This is why subject specific Data Sets from packages may be a better choice.
  • #28: At Senturus we concentrate our expertise on business intelligence with a depth of knowledge across the entire BI stack.
  • #29: At Senturus, our clients know us for providing clarity from the chaos of complex business requirements, disparate data sources and constantly moving targets. We have made a name for ourselves because of our strength at bridging the gap between IT and business users. We deliver solutions that give you access to reliable, analysis-ready data across the organization so you can quickly and easily get answers at the point of impact: the Decisions you Make and Actions you Take.
  • #30: Our consultants are leading experts in the field of analytics, with years of pragmatic, real-world expertise and experience advancing the state-of-the-art. We’re so confident in our team and our methodology that we back our projects with a 100% money back guarantee that is unique in the industry.
  • #31: We have been focused exclusively on business intelligence for 19 years. We work across the spectrum from Fortune 500 to mid market, We solve business problems across many industries and function areas including in the office of finance, sales and marketing, manufacturing, operations, HR and IT Our team is large enough to meet all your business analytics needs yet small enough to provide personal attention.
  • #32: Senturus has 100s of free resources on our website, from webinars on all things BI, to our fabulous up-to-the-minute, easily consumable blogs.
  • #33: We provide training in the three top BI platforms. We are ideal for organizations running multiple platforms or those moving from one to another. We can provide training in many modes and can mix and match to suit your user community.
  • #34: Senturus provides 100s of free resources on our website. We have been committed to sharing our BI expertise for over a decade.