


How to use Pivot Table in Analyzing Sales
- 2. What is Pivot Table?
- 3. It is a data summarization tool found in data visualization programs
- 4. What are the benefits of Pivot table ?
- 5. 1 Automatically count and sort data Deliverable 4 ● Lorem ipsum dolor sit amet ● Sed do eiusmod tempor incididunt ut labore ●
- 6. 2 Data Analysis Deliverable 4 ● Lorem ipsum dolor sit amet ● Sed do eiusmod tempor incididunt ut labore
- 7. 3 Total or Average data Deliverable 4 ● Lorem ipsum dolor sit amet ● Sed do eiusmod tempor incididunt ut labore
- 8. 4 Summary of data Deliverable 4 ● Lorem ipsum dolor sit amet ● Sed do eiusmod tempor incididunt ut labore
- 9. 5 Data Tabulations Deliverable 4 ● Lorem ipsum dolor sit amet ● Sed do eiusmod tempor incididunt ut labore
- 10. 6 Quick decision making Deliverable 4 ● Lorem ipsum dolor sit amet ● Sed do eiusmod tempor incididunt ut labore
- 11. 7 Find data patterns Deliverable 4 ● Lorem ipsum dolor sit amet ● Sed do eiusmod tempor incididunt ut labore
- 12. 8 Quick report creation Deliverable 4 ● Lorem ipsum dolor sit amet ● Sed do eiusmod tempor incididunt ut labore
- 14. Organizing a large amount of certain data set in condensed.
- 16. Pivot Table using Microsoft Excel Part 1
- 19. Sample WorkSheet
- 20. This is Column
- 21. This is Row
- 22. Cell A1
- 23. Sample data for Pivot Table
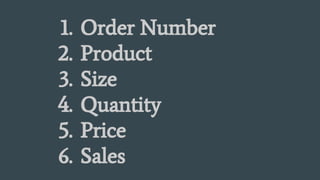
- 25. Data Consists of the following Items
- 26. 1. Order Number 2. Product 3. Size 4. Quantity 5. Price 6. Sales
- 28. Click Cell A1
- 29. Hold Shift + End + Arrow down
- 31. Click Insert
- 35. I choose New Worksheet so you will not confused with your data
- 36. This will appear
- 38. What are areas?
- 39. Report Filter is used to apply a filter to an entire table
- 40. Column Labels used to apply a filter to one or more columns have to be shown in the pivot table
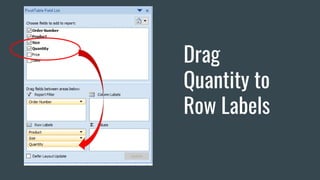
- 41. Row Labels used to apply a filter to one or more rows that have to be shown in the pivot table
- 42. Values field that has numerical values that can be used for different types of calculations
- 43. Click Order Number and Drag to Report Filter
- 49. Click Sum of sales then Click Value Field Settings
- 52. Change currency Then click OK
- 54. To view Order each order number
- 56. Shows that Total Sales from Order No. 20170007 is $34.00
- 57. Try to put Quantity to Column
- 58. Quantity in Column Label
- 59. You can minimize data
- 60. You can also Insert Graph
- 61. Click cell
- 62. Click Insert
- 64. Sample Graph generated from Pivot table
- 65. From the Graph and Table you can analyze if the sales is increasing or decreasing
- 67. Click Filter Pane to Edit
- 68. Click to Report Filter Click to order number then OK
- 69. Sample Filter for Royal order number 20170005
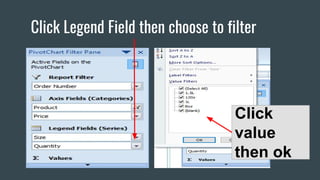
- 70. Click Axis Fields categories Click Product then ok
- 71. Click Legend Field then choose to filter Click value then ok
- 72. Sample Graph for Coke only
- 73. Pivot Table using Google Spreadsheets Part 2
- 74. Go to Google Search and Type Sheets
- 75. Go to Google Search and Type Sheets Click link here
- 76. Click here
- 78. Click here to Rename
- 79. Using the same Data from Excel File above
- 80. Click Data and Click Pivot Table
- 81. Create Pivot table using Editor
- 82. Letter corresponds to Column
- 83. Click Add Field Click Column to Add
- 84. Sample Pivot Table Created
- 86. Click here to Minimize data
- 87. Click here to set calculations
- 88. You can choose calculations here
- 89. How to Insert Chart?
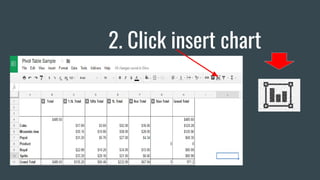
- 90. 1. Drag Cells create Chart
- 92. 2. Click insert chart
- 94. Chart types
- 95. Here are the samples
- 97. Switch rows / column
- 98. Use column A as headers
- 99. Use column A as Labels
- 101. Type Title of your Chart
- 102. Customize the Legend
- 103. Customize 1. Font 2. Background 3. Line annotations 4. Features
- 104. Chart Created from the Pivot Table
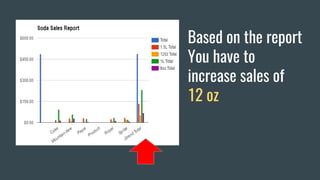
- 105. You can analyze the flow of sales for each Product
- 106. Sample: 1L product is the highest sales
- 107. Based on the report You have to increase sales of 12 oz
- 108. What’s Next?
- 109. Do some marketing strategy for other Products to Increase your Sales
- 110. Create your Pivot Table regularly for Analyzing your Sales