Improve the performance of your Unity project using Graphics Performance Analyzers – Unite Copenhagen 2019
Download as pptx, pdf2 likes1,569 views

This document provides an overview of using Intel's Graphics Performance Analyzers (GPA) tool to optimize graphics performance. It discusses profiling workflows including identifying bottlenecks and hotspots. A case study is presented where GPA is used to optimize Unity's 3D Game Kit by identifying and addressing bottlenecks like skybox rendering, reflections, and UI rendering to achieve higher frame rates. The document concludes with some extra recipes for advanced profiling with GPA.


![@IntelSoftware @IntelGraphics
Legal Notices and Disclaimers
No license (express or implied, by estoppel or otherwise) to any intellectual property rights is granted by this document.
Intel disclaims all express and implied warranties, including without limitation, the implied warranties of merchantability, fitness for a particular purpose, and non-infringement, as well
as any warranty arising from course of performance, course of dealing, or usage in trade.
You may not use or facilitate the use of this document in connection with any infringement or other legal analysis concerning Intel products described herein. You agree to grant Intel a
non-exclusive, royalty-free license to any patent claim thereafter drafted which includes subject matter disclosed herein.
The products and services described may contain defects or errors known as errata which may cause deviations from published specifications. Current characterized errata are
available on request.
Intel technologies’ features and benefits depend on system configuration and may require enabled hardware, software or service activation. Performance varies depending on system
configuration. No computer system can be absolutely secure. Check with your system manufacturer or retailer or learn more at [intel.com].
Software and workloads used in performance tests may have been optimized for performance only on Intel microprocessors. Performance tests, such as SYSmark and MobileMark, are
measured using specific computer systems, components, software, operations and functions. Any change to any of those factors may cause the results to vary. You should consult
other information and performance tests to assist you in fully evaluating your contemplated purchases, including the performance of that product when combined with other
products. For more complete information visit www.intel.com/benchmarks.
Optimization Notice: Intel's compilers may or may not optimize to the same degree for non-Intel microprocessors for optimizations that are not unique to Intel microprocessors. These
optimizations include SSE2, SSE3, and SSSE3 instruction sets and other optimizations. Intel does not guarantee the availability, functionality, or effectiveness of any optimization on
microprocessors not manufactured by Intel. Microprocessor-dependent optimizations in this product are intended for use with Intel microprocessors. Certain optimizations not
specific to Intel microarchitecture are reserved for Intel microprocessors. Please refer to the applicable product User and Reference Guides for more information regarding the specific
instruction sets covered by this notice.
Results have been estimated or simulated using internal Intel analysis or architecture simulation or modeling, and provided to you for informational purposes. Any differences in your
system hardware, software or configuration may affect your actual performance.
Intel, Core and the Intel logo are trademarks of Intel Corporation in the U.S. and/or other countries.
*Other names and brands may be claimed as the property of others
© Intel Corporation.](https://image.slidesharecdn.com/ivqmlrawtu20jvqu2yqy-signature-f3bbc4b7e22b609b9b600389c741128524053306d5dab142a47cc06ecfb0d6e4-poli-191005010255/85/Improve-the-performance-of-your-Unity-project-using-Graphics-Performance-Analyzers-Unite-Copenhagen-2019-76-320.jpg)
Improve the performance of your Unity project using Graphics Performance Analyzers – Unite Copenhagen 2019
- 2. @IntelSoftware @IntelGraphics 2 Agenda • Introduction • Game profiling workflow overview • Step through profiling workflow • Common bottleneck identification • Case Study: Optimizing Unity’s 3D Game Kit • Useful recipes for performance analysis using GPA
- 3. @IntelSoftware @IntelGraphics 3 Scaling Graphics Performance Effectively My super awesome game 30 FPS
- 4. @IntelSoftware @IntelGraphics 4 Scaling Graphics Performance Effectively My super awesome game 30 FPS 10 FPS
- 5. @IntelSoftware @IntelGraphics 5 Scaling Graphics Performance Effectively My super awesome game 30 FPS 10 FPS 20 FPS
- 6. @IntelSoftware @IntelGraphics 6 Scaling Graphics Performance Effectively My super awesome game 30 FPS 10 FPS 20 FPS 30 FPS
- 7. @IntelSoftware @IntelGraphics 7 Scaling Graphics Performance Effectively My super awesome game 30 FPS 10 FPS 30 FPS+ 60 FPS+
- 8. @IntelSoftware @IntelGraphics 8 Intel® Graphics Performance Analyzers (Intel GPA) System Analyzer Graphics Frame Analyzer Graphics Trace Analyzer
- 9. @IntelSoftware @IntelGraphics GPU bound 9 Profiling Workflow Frame Analysis Identify Scene + + CPU vs GPU bound? Identify Hotspots Identify Hotspots via instrumentation CPU bound
- 10. @IntelSoftware @IntelGraphics GPU bound 10 Profiling Workflow Frame Analysis Identify Scene + + CPU vs GPU bound? Identify Hotspots CPU bound Identify Hotspots via instrumentation
- 11. @IntelSoftware @IntelGraphics GPU bound 11 Profiling Workflow Frame Analysis Identify Scene + + CPU vs GPU bound? Identify Hotspots CPU bound Identify Hotspots via instrumentation
- 12. @IntelSoftware @IntelGraphics 12 System Analyzer Overview
- 13. @IntelSoftware @IntelGraphics 13 In Application Live Analysis
- 14. @IntelSoftware @IntelGraphics GPU bound 14 Profiling Workflow Frame Analysis Identify Scene + + CPU vs GPU bound? Identify Hotspots CPU bound Identify Hotspots via instrumentation
- 15. @IntelSoftware @IntelGraphics 15 • New UI with improved collection mechanism • Collect data from various sources correlated in one timeline • ETW events • Graphics API calls • Sampled metrics Graphics Trace Analyzer
- 16. @IntelSoftware @IntelGraphics Hardware Queue Graphics API calls Driver Queue 16 Lifetime of Graphics Commands
- 17. @IntelSoftware @IntelGraphics Hardware Queue Graphics API calls Driver Queue 17 Lifetime of Graphics Commands Present call in queue until finally executed by GPU
- 18. @IntelSoftware @IntelGraphics Hardware Queue Graphics API calls Driver Queue 18 Lifetime of Graphics Commands No gaps in queue
- 19. @IntelSoftware @IntelGraphics Hardware Queue Graphics API calls Driver Queue 19 Not GPU bound
- 20. @IntelSoftware @IntelGraphics Hardware Queue Graphics API calls Driver Queue 20 Not GPU bound Gaps in queue
- 21. @IntelSoftware @IntelGraphics 21 VSync Bound
- 22. @IntelSoftware @IntelGraphics 22 GPU bound vs CPU bound comparison Consistent stream in GPU queue? Frame Time < VSync? Consistent gaps in GPU queue? Yes No GPU bound Yes VSync bound Yes CPU bound No CombinationNo Not GPU Bound GPU Bound
- 23. @IntelSoftware @IntelGraphics 23 Differentiate GPU Usage per Application
- 24. @IntelSoftware @IntelGraphics GPU bound 24 Profiling Workflow Frame Analysis Identify Scene + + CPU vs GPU bound? Identify Hotspots CPU bound Identify Hotspots via instrumentation
- 25. @IntelSoftware @IntelGraphics GPU bound 25 CPU Bound Frame Analysis Identify Scene + + CPU vs GPU bound? Identify Hotspots CPU bound Identify Hotspots via instrumentation
- 26. @IntelSoftware @IntelGraphics 26 Instrumentation Instrumentation Alternatives • ETW • PIX/Graphics API markers Hotspots from selected region Dive into region occurrences
- 27. @IntelSoftware @IntelGraphics GPU bound 27 Profiling Workflow Frame Analysis Identify Scene + + CPU vs GPU bound? Identify Hotspots CPU bound Identify Hotspots via instrumentation
- 28. @IntelSoftware @IntelGraphics GPU bound 28 GPU Bound Frame Analysis Identify Scene + + CPU vs GPU bound? Identify Hotspots CPU bound Identify Hotspots via instrumentation
- 29. @IntelSoftware @IntelGraphics 29 Graphics Frame Analyzer
- 30. @IntelSoftware @IntelGraphics GPU bound 30 GPU Bound • Frame Analysis to identify most expensive calls • Easy hotspot analysis for automatic bottleneck root cause analyzer Identify HotspotsFrame Analysis
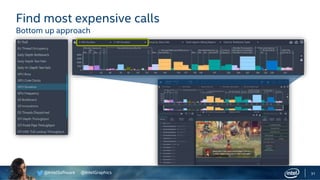
- 31. @IntelSoftware @IntelGraphics 31 Find most expensive calls Bottom up approach
- 32. @IntelSoftware @IntelGraphics 32 Find most expensive calls Top down approach
- 33. @IntelSoftware @IntelGraphics 33 Hotspot Analysis Overview
- 34. @IntelSoftware @IntelGraphics 34 • Bottleneck in Geometry Transformation • Things to look out for and mitigation: • Dense geometry rendered to small area • More aggressive LODs or decimation needed • Icebergs (5% in view, 95% out) • Slice geometry for better culling • Stragglers (not in view but not culled) • Debug why is object not being culled Geometry Transformation
- 35. @IntelSoftware @IntelGraphics • X Axis: Pixels Rendered • Y Axis: Primitive Count • Tall skinny bars, big objects rendered to small amount of pixels 35 Geometry Transformation
- 36. @IntelSoftware @IntelGraphics 36 Geometry Transformation Iceberg Stragglers Dense/Iceberg
- 37. @IntelSoftware @IntelGraphics • New Python plugin system • =metric(“GPU Duration”, “>”, 200) • Preloaded with several plugins • Create your own! 37 Geometry Transformation
- 38. @IntelSoftware @IntelGraphics GPU bound 38 Profiling Workflow Frame Analysis Identify Scene + + CPU vs GPU bound? Identify Hotspots CPU bound Identify Hotspots via instrumentation
- 39. @IntelSoftware @IntelGraphics 39 Case Study: Unity 3D Game Kit Overview Tutorial project in Unity asset store 3 built-in quality settings ‘Performance’, ‘Balanced’ and ‘Fantastic’ Our Goal: ‘Performance’ mode FPS on ‘Fantastic’ mode visual quality
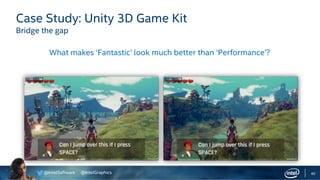
- 40. @IntelSoftware @IntelGraphics 40 Case Study: Unity 3D Game Kit Bridge the gap What makes ‘Fantastic’ look much better than ‘Performance’?
- 41. @IntelSoftware @IntelGraphics 41 Case Study: Unity 3D Game Kit Set your performance goals Draw distance Water reflections Shadows What makes ‘Fantastic’ look much better than ‘Performance’?
- 42. @IntelSoftware @IntelGraphics 42 Case Study: Unity 3D Game Kit Spoiler Draw distance Water reflections Shadows What makes ‘Fantastic’ look much better than ‘Performance’?
- 43. @IntelSoftware @IntelGraphics 43 Case Study: Unity 3D Game Kit How did we get there? Tug of war, make some room then bring stuff back in
- 44. @IntelSoftware @IntelGraphics 44 Case Study: Unity 3D Game Kit Understand the game’s anatomy
- 45. @IntelSoftware @IntelGraphics 45 Case Study: Unity 3D Game Kit Understand the game’s anatomy Frame Budget (30 FPS)
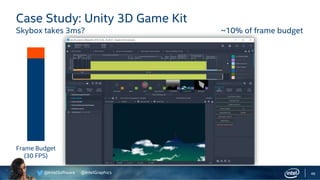
- 46. @IntelSoftware @IntelGraphics 46 Case Study: Unity 3D Game Kit Skybox takes 3ms? ~10% of frame budget Frame Budget (30 FPS)
- 47. @IntelSoftware @IntelGraphics 47 Case Study: Unity 3D Game Kit Investigate Skybox rendering ~10% of frame budget
- 48. @IntelSoftware @IntelGraphics 48 Case Study: Unity 3D Game Kit Investigate Skybox rendering ~10% of frame budget
- 49. @IntelSoftware @IntelGraphics 49 Case Study: Unity 3D Game Kit Skybox camera set as deferred ~10% of frame budget Frame Budget (30 FPS)
- 50. @IntelSoftware @IntelGraphics 50 Case Study: Unity 3D Game Kit Skybox camera set as forward 0.8ms 2.4% of frame budget down from 10% Frame Budget (30 FPS)
- 51. @IntelSoftware @IntelGraphics 51 Case Study: Unity 3D Game Kit Keep peeling the onion! Frame Budget (30 FPS)
- 52. @IntelSoftware @IntelGraphics 52 Case Study: Unity 3D Game Kit Reflections take 4.8ms 14.5% of frame budget Frame Budget (30 FPS)
- 53. @IntelSoftware @IntelGraphics 53 Case Study: Unity 3D Game Kit Investigate reflections
- 54. @IntelSoftware @IntelGraphics 54 Case Study: Unity 3D Game Kit 32 Reflection probes? Can we get by with less? 14.5% of frame budget Frame Budget (30 FPS)
- 55. @IntelSoftware @IntelGraphics 55 Case Study: Unity 3D Game Kit 32 to 3 reflection probes 2.1ms 6.4% of frame budget down from 14.5% Frame Budget (30 FPS)
- 56. @IntelSoftware @IntelGraphics 56 Case Study: Unity 3D Game Kit Keep peeling the onion! Frame Budget (30 FPS)
- 57. @IntelSoftware @IntelGraphics 57 Case Study: Unity 3D Game Kit UI rendering takes 1.8ms 8% of frame budget Frame Budget (30 FPS)
- 58. @IntelSoftware @IntelGraphics 58 Case Study: Unity 3D Game Kit Investigate UI Rendering
- 59. @IntelSoftware @IntelGraphics 59 Case Study: Unity 3D Game Kit Blur text is expensive, by how much? 8% of frame budget Frame Budget (30 FPS)
- 60. @IntelSoftware @IntelGraphics 60 Case Study: Unity 3D Game Kit UI Rendering without blur 0.2ms 0.6% of frame budget down from 8% Frame Budget (30 FPS)
- 61. @IntelSoftware @IntelGraphics 61 Case Study: Unity 3D Game Kit Level check: Running at 38 FPS now! With all the optimizations we’re now running at 38 FPS Time to start adding things back! Lets start big: Culling distanceFrame Budget (30 FPS)
- 62. @IntelSoftware @IntelGraphics 62 Case Study: Unity 3D Game Kit Restore cull distance Before 38FPS After 33FPS Still some room left Lets add it all! Frame Budget (30 FPS)
- 63. @IntelSoftware @IntelGraphics 63 Case Study: Unity 3D Game Kit Lets add it all! Before 33FPS After 28FPS 8% above budget but we got water reflections and shadows! What else can we cheaply do to stay within budget? Frame Budget (30 FPS)
- 64. @IntelSoftware @IntelGraphics 64 Case Study: Unity 3D Game Kit Downscale deferred render target Downscale deferred render target to a fraction of it’s size Upscale in final pass and render UI at full resolution Back within Frame Budget! Frame Budget (30 FPS)
- 65. @IntelSoftware @IntelGraphics 65 Extra Recipes Trigger a frame capture
- 66. @IntelSoftware @IntelGraphics 66 Extra Recipes Capturing a stream
- 67. @IntelSoftware @IntelGraphics 67 Extra Recipes Capturing a stream
- 68. @IntelSoftware @IntelGraphics 68 Extra Recipes Capturing a stream
- 69. @IntelSoftware @IntelGraphics 69 Extra recipes Advanced profiling mode
- 70. @IntelSoftware @IntelGraphics 70 Extra recipes Pinning counters
- 71. @IntelSoftware @IntelGraphics 71 Extra recipes Comparing counters
- 72. @IntelSoftware @IntelGraphics 72 Extra recipes Zero Pixel Write plugin
- 73. @IntelSoftware @IntelGraphics 73 Extra recipes Write Your Own plugins
- 74. @IntelSoftware @IntelGraphics 74 Summary • Scale graphics performance effectively • Performance awareness is everyone’s responsibility • Base optimizations on gathered data. • Grab Intel® GPA for free @ https://software.intel.com/en-us/gpa • Don’t hesitate to ask me questions now or after. • Try it yourself!
- 75. Questions?
- 76. @IntelSoftware @IntelGraphics Legal Notices and Disclaimers No license (express or implied, by estoppel or otherwise) to any intellectual property rights is granted by this document. Intel disclaims all express and implied warranties, including without limitation, the implied warranties of merchantability, fitness for a particular purpose, and non-infringement, as well as any warranty arising from course of performance, course of dealing, or usage in trade. You may not use or facilitate the use of this document in connection with any infringement or other legal analysis concerning Intel products described herein. You agree to grant Intel a non-exclusive, royalty-free license to any patent claim thereafter drafted which includes subject matter disclosed herein. The products and services described may contain defects or errors known as errata which may cause deviations from published specifications. Current characterized errata are available on request. Intel technologies’ features and benefits depend on system configuration and may require enabled hardware, software or service activation. Performance varies depending on system configuration. No computer system can be absolutely secure. Check with your system manufacturer or retailer or learn more at [intel.com]. Software and workloads used in performance tests may have been optimized for performance only on Intel microprocessors. Performance tests, such as SYSmark and MobileMark, are measured using specific computer systems, components, software, operations and functions. Any change to any of those factors may cause the results to vary. You should consult other information and performance tests to assist you in fully evaluating your contemplated purchases, including the performance of that product when combined with other products. For more complete information visit www.intel.com/benchmarks. Optimization Notice: Intel's compilers may or may not optimize to the same degree for non-Intel microprocessors for optimizations that are not unique to Intel microprocessors. These optimizations include SSE2, SSE3, and SSSE3 instruction sets and other optimizations. Intel does not guarantee the availability, functionality, or effectiveness of any optimization on microprocessors not manufactured by Intel. Microprocessor-dependent optimizations in this product are intended for use with Intel microprocessors. Certain optimizations not specific to Intel microarchitecture are reserved for Intel microprocessors. Please refer to the applicable product User and Reference Guides for more information regarding the specific instruction sets covered by this notice. Results have been estimated or simulated using internal Intel analysis or architecture simulation or modeling, and provided to you for informational purposes. Any differences in your system hardware, software or configuration may affect your actual performance. Intel, Core and the Intel logo are trademarks of Intel Corporation in the U.S. and/or other countries. *Other names and brands may be claimed as the property of others © Intel Corporation.
Editor's Notes
- #2: I’ll be taking a stab at some methods we could employ either ourselves or bring them back to our team to hopefully lower the barrier of entry to find and mitigate performance issues. This with the goal of making it more approachable for all game developers that aren’t necessarily familiar or are intimidated by performance profiling. And hopefully bring performance profiling or performance awareness earlier in the development process not only to performance engineers but also everyone else involved in the process including, artists, game designers, etc. by showing them how to use tools in a way it’s not overwhelming leaving the heavy lifting to the tools themselves
- #3: start our journey with an introduction setting the tone of the conversation Importance of not only game profiling but scaling graphics performance to work on a wide range of hardware effectively and therefore efficiently and move on to a brief overview of the tools we will be using. This will be a good lead up into defining a profiling workflow which we will go over step by step with a deeper explanation, introduce each tool that can help us gather the necessary data to understand what are the next steps Once we get to the point in our Journey where we managed to isolate the hotspots in our application and performed some root cause analysis, I will provide an example of a common bottleneck, how can it be detected by the tools and how it can be mitigated in a straight forward ‘recipe’ way of for example “if you see this bottleneck, it’s most likely because of this and that. And this are ways to fix this” I believe this types of recipe’s can help us bring performance awareness to our team Case Study: Optimizing Unity’s 3D Game Kit How to fix issue when working on 3rd party engines
- #4: Let’s begin with a semi-fictional although quite real scenario were a game is developed in a high end system. The game looks gorgeous and has all the bells and whistles of a modern rendering engine could have. Runs comfortably at 30fps
- #5: Somewhere along the line the game is tested on a mainstream system and reality hits. This can happen for many reasons like trying to define our minimum or recommended specs for the game, a requirement for these systems was there for this target demographic, game not ready this could happen at any point in the development cycle, unfortunately more often than not, this tends to happen towards the end of the development cycle. At this point the reason doesn’t matter, what matters is that the game doesn’t perform correctly so it needs to be ‘scaled’ accordingly. Assuming this was tested later, the game has been mostly been created at this point, the performance engineer comes along to enable mainstream PC’s and is tasked to do ‘low’ or ‘mid’ quality settings. He or she most likely didn’t create or maintained any of these assets. The cost of modifying them can be high and it almost seems that all that can be done is stripping down some of these post effects, render passes, etc.
- #6: This may or may not produce the desired outcome, in this case being able to run at 30fps. What it surely accomplished though is degraded visual quality of the game dramatically without necessarily improving the FPS effectively.
- #7: It’s worth noting that none of this stripping down affected the high-end and it will stay at 30fps
- #8: Here’s where GPA comes in! Having tools that can provide not only data but categorize it in a way that is understandable and actionable is essential. As we’ll see in the case study, there tends to be a nice symbiotic relationship while optimizing for mainstream hardware reflecting in gains on high end and vice-versa In this semi-fictional and slightly real scenario, we may have nuked many visual effects and gained some performance back but the game was still heavily sampler bound, caused by most textures being 4k x 4k. A more effective performance profiling approach in this scenario would have been properly addressing the texture sizes which could give a more significant perf improvement to the point that none or less visual effects need to be disabled on low and mid settings and overall retain a higher visual quality.
- #9: So what exactly is Intel GPA? GPA is a suite of graphics performance tools created by Intel for the purpose of optimizing games and real-time graphics applications. We will look each tool individually as needed in the following slides and only focus on the features relevant to this presentation to keep it relatively high level GPA supports DirectX 9-12, Vulkan, Metal and OpenGL and runs on Windows, Linux and Mac and can be used to capture workloads in all major PC graphics hardware
- #10: And without further ado, this is the profiling workflow we will be focusing on today. Depending on the level of expertise and workload knowledge skip some steps Implicit loop back as once a bottleneck is identified and mitigated then another one will arise and so on and so forth.
- #11: The first phase as one may expect is to identify areas in game (scenes/levels/point of views graphics settings) that require attention. We will be using the System Analyzer tool for this which will give us enough information to identify this areas as well as some early assessment on where our bottlenecks may be with its built in realtime override capabilities. Once we determined the area in the game that we’ll focus our attentions on we will need to gain deeper insight to continue our investigations. For this we will use the Trace Analyzer to get higher granularity on collected data which among other things, will help us determine more conclusively if the given scenario is CPU or GPU bound. This will define our next steps depending on this outcome were the paths diverge. For CPU bound scenarios, I’ll be talking about the alternatives we have for instrumentation and their benefits as well as how to identify hotspots before we dive deeper into lower level tools. In the case of GPU bound scenarios we will be using the power of GPA’s automatic hotspot analysis and root cause detection mechanisms to quickly identify our areas of interest and which parts of the graphics pipeline the bottlenecks are in. Once we properly identify these, we will go through an example of a common bottleneck and create an actionable recipe
- #12: Lets dive into the first step of identifying the scene. We will be using System Analyzer for this step Before diving into this step let’s do a quick overview of the first tool we’ll be using.
- #13: System Analyzer is GPA’s real-time performance tool. It collects real time information across the system to gather a holistic view on the game’s impact on the system. System wide and per-process metrics It’s also paired with realtime overrides to get an initial assessment on where the bottlenecks for certain scenes may lay. A scene might have a diverse set of bottlenecks and focusing on one of this realtime overrides may not give all the information needed, we’ll use our other tools to get this deeper level info
- #14: GPA also provides a convenient way of showing System Analyzer metrics in application. Realtime overrides can also be applied from within the application with shortcuts This is most helpful when running an application in full screen mode 4 metrics at a time, Can be swapped in realtime through the settings tool called “Graphics Monitor” Triggers for trace and frame captures With this tool we can run through the game and play through various scenes and POVs and land on the one we see the worst performance degradation
- #15: Now that we have the scene we are interested in create a reproducible scenario we can move forward in our workflow to identify more conclusively if the given scene is CPU bound or GPU bound. Crucial information to make sure our optimizations are effective focusing on the right problems. This process will be quite straight forward and will utilize another tool from the GPA tools suite called Trace Analyzer so before looking into an example let’s do another quick overview of the tool we will be using.
- #16: Trace Analyzer is a time based trace capture tool which gives deeper insight into the execution flow of an application and the system. If you are familiar with tools like GPUView this will look very familiar, we also collect system ETW events which give us information on thread execution per core, device and hardware queue status, etc. but can also correlate additional information within the same timeline. This includes graphics API calls and debug event markers and regions, and the set of metrics available in System Analyzer but captured at a higher frequency. Trace Analyzer captures via a ring buffer which proves particularly useful if an anomaly is identified and a trace capture is performed after it, the data will be present in the Trace buffer and displayed accordingly in Trace Analyzer even though it happened pre-capture. TA can look overwhelming with the LOD of data it collects so we will focus on the most basic set of information to get our desired outcome, CPU vs GPU bound
- #17: Among the data displayed in Trace Analyzer, one of the most critical pieces of the puzzle will be the graphics driver and hardware queues This queues hold all the commands required to be rendered by the GPU and to understand how to infer anything from this data is worth looking at the lifetime of a single graphics command
- #18: Each graphics API call produces commands that get put into command buffers which is what gets submitted to be displayed on the GPU it will be placed in an app specific queue and as things get executed it will make its way through this queue until it reaches the hardware queue and ultimately executed by the GPU. The size of the queue is representative to how busy or starved the GPU can be for work and is a great way to identify if an application is CPU or GPU bound Looking at the queues you can infer at a glance if the given scene is GPU or not GPU bound.
- #19: As you can see in the screenshots, a case were an application is GPU bound, the device queue will continue to have data to feed to the GPU without any idle time.
- #20: In the contrary, when not enough GPU work is submitted to the GPU there will be clear and visible gaps in the device queue which represent the GPU being idle and starved for work.
- #21: In the contrary, when not enough GPU work is submitted to the GPU there will be clear and visible gaps in the device queue which represent the GPU being idle and starved for work. Note that at this point I am not claiming that if an application is not GPU bound it is automatically CPU bound. This is because the amount of work in the CPU could also be low enough that the application could be VSync bound which means both CPU and GPU are waiting for an available surface to render to.
- #22: This scenario is not very common but worth mentioning for completeness. If the application is not GPU bound and not VSync bound we can now say it is CPU bound.
- #23: To streamline the process of identifying if our application is CPU or GPU bound we can look at consistent stream of commands [[ELABORATE]] There will be times were there can be intermittent gaps in queue Combination of different bottlenecks Frame time variance? New stream capture mode can help identify these and we will go through it later on At this point we should know if we should focus our efforts on CPU or GPU related optimizations
- #24: Before moving back to the profiling workflow I would like to quickly point out that with TA you can Identify if other applications are competing for the GPU resource that could affect your game’s performance This will lead to misleading results and can be seen on the hardware queue sharing the resource and we need to be aware about it and know that we can spot this with the tool
- #25: At this point is where our paths diverge based on our findings knowing we are CPU or GPU bound and we will now explore both paths and gather as much information as possible with the least amount of knowledge of the underlying hardware as possible. GPA is primarily a graphics profiling tool and is particularly useful when an application is GPU bound. That said, Trace Analyzer is packed with some features that can help us identify CPU side bottlenecks too before resorting to tools that provide deeper CPU insight like Vtune.
- #26: Lets go through a few options we have for instrumentation and how we can use its statistical representations to find hotspots in the instrumented regions
- #27: Unity has ETW. Debug builds have ETW and PIX markers
- #29: We will start by exploring the path where our application is GPU bound. Our goal is to identify the optimization opportunities that could bring the biggest return of investment and with the least amount of knowledge of the underlying hardware architecture as possible. For this we will use GPA’s Frame Analyzer, particularly the ‘hotspot’ analysis to do most of the leg work for us. Before we get started let’s do a quick overview of the final tool we will be using today.
- #30: Graphics Frame Analyzer is GPA’s debug and profiling tool for captured application frames. It can visualize, replay and collect metric information of all the data needed to produce a given frame. This includes all API calls, shaders, buffers, textures, etc. To keep this introduction brief, I will not go into detail of all the features of the tool and will introduce a subset later on that we will be using within our workflow
- #31: Just to recap, once we land in this frame analyzer view we will want to spot the most expensive calls Then use hotspot analysis for automatic bottleneck root cause analysis
- #32: Finding the most expensive drawcalls is very straight forward, the bar graph at the top of the Frame Analyzer view represents all the events that had any GPU work associated with it including draw, dispatch, clear, copy calls, etc. Frame Analyzer allows users to control the scaling of both the X and Y axis of this graph and a subset of these metrics is shown on the left hand side. Setting both the X and Y axis to ‘GPU Duration’ is a very simple and effective way of accentuating the size of the events that have the highest GPU duration and by consequence biggest impact in the frame time.
- #33: Get a more holistic view of the whole frame Particularly useful with debug regions From this level you can always drill down all the way to the drawcalls still Once we identified the most expensive calls we now want to understand why they are so expensive. For this we will recur to the automatic hotspot analysis
- #34: Hotspot analysis is one of your best friends in Frame Analyzer. With one click you can determine what is the impact of this call in the graphics pipeline and which phase is the biggest bottleneck Particularly useful as logical GPU pipeline doesn’t match modern hardware with EU’s. Just leave the smarts to GPA Up to this point we didn’t need any knowledge of the underlying hardware Someone that’s not necessarily familiar with GPU performance optimization can easily utilize GPA to take a frame capture, with the GPU duration visualization quickly find the most expensive calls and with the hotspot analysis have an automated root cause analysis of such drawcall. The next step is to know what actionable things we can do for the different bottleneck types Here’s were us as performance engineers can help by providing some “recipe’s” of actionable things that can be done if a bottleneck is reached I’ll be giving a brief example of one For more information on all stages please visit our Intel Performance optimization guide on the intel developer zone website
- #39: With this workflow I believe we can teach our team how to identify scenes, find if it’s CPU vs GPU bound and ways to get as much information as possible before having to dive deep into details. Our final section will exemplify this and bring it back around to the original message of scaling graphics performance effectively and efficiently
- #40: High level, only optimizations that could have been caught or resolved by our team without recurring to the perf engineers to optimize a shader or algorithm, etc. Don’t change the demo drastically
- #41: What makes Fantastic look much better than Performance? If we understand this it will help us prioritize our tradeoffs Set our visual quality and performance goals
- #45: Especially when a workload is new or the engine is new, is good to spend some time understanding how rendering happens. Enabling debug regions is a great way to have a better and fuller holistic picture of the frame
- #46: Collapsing the regions show the cumulative effort of a full region and you can see the root of the debug regions which immediately started to look fishy
- #47: This camera is rendering the skybox, why would rendering a skybox take 3ms? This is 10% of our frame budget and looks excessive. We should investigate this!
- #48: Let’s investigate the Skybox a little. We can see that the Skybox preset has a camera. This camera renders the entire skybox to its frame buffer. Turns out this camera is set to deferred and a bunch of unnecessary copies are made and overhead for one tiny drawcall. Draws of atmosphere and clouds take only 0.4ms collectively but this overhead is the rest of the 2.4ms
- #49: We do not need to render the Skybox deferred. Let’s change this to forward and see the what the results are.
- #50: Before : 3ms
- #51: After : No visual difference and brought it down to 0.8ms. Score!
- #52: Continue traversing the regions everything looks normal. Gbuffer takes 6ms but that’s somewhat expected for now, we will tackle that later.
- #53: Reflection probe creation 4.8ms or 14.5% of my frame budget? Let’s see why can this be
- #54: Looking at the reflection probes in the level, we quickly notice that there are 32 reflection probes. This is performance mode, do we really need that many?
- #55: 32 reflection probes, we are in performance mode, do we need that many? We want reflections but no need for that many, can we get by with less?
- #56: 4.8ms to 2.1ms. This was 2.7ms gain, not bad
- #57: At this point we continued looking through the debug regions but there was one thing that kept bugging us
- #58: Looking at the UI rendering it seems to take 1.8ms of the frame. But why? There’s only two things rendered here
- #59: We investigate and find out that the character dialogue UI uses a background blur, using the frosted glass shader.
- #60: Blur shader for text is expensive. Is it really needed? Would I rather have awesome shadows, cull distance and water reflections or this blur? I think the answer is clear
- #61: 1.8ms vs .2ms? I can live without that blur! At this quality setting
- #66: So what else can we do with GPA? Using Graphics Monitor, you can trigger a frame or trace capture according to some condition. For example here, if the FPS goes below 30, we trigger a frame capture. This will capture the exact moment your game drops below 30 fps and will help greatly in finding the root cause of the issue.
- #67: Instead of capturing a single frame, you can capture a stream (multiple frames). Capturing a stream can be useful to identify a temporary performance issue, or analyse a multi-frame algorithm.
- #68: After opening the stream in the Graphics Frame Analyzer, I can choose from any of the frames of the left, and I see a graph of the frame time along the stream, so it’s easy to identify which frames to analyse further.
- #69: When I open the specific frame I have selected, The Graphics Frame Analyzer plays back the stream to the frame, and the goes to the classic profiler view.
- #70: In the top left corner, we have Advanced profiling mode. We talked earlier of Hotspot analysis. The Advanced Profiling mode collects performance data for the entire frame and performs Hotspot analysis on thos set of data. This is a very good way to instantly see where most of the GPU time is spent frame wide. In this case, Pink is Geometry Transformation. As we can see from the Advanced profiling mode, this is by far the biggest issue in this frame.
- #71: A more practical tip. It is possible to pin counters so that they’ll always appear at the top of the counter list. With a large amount of counters available (on Intel Hardware), it is good to have the essential ones easily accessible.
- #72: Talking about counters, it is important to understand what they represent, and how they can be compared for a better understanding of our bottlenecks. Here we are comparing the Primitive count, the total amount of primitives (triangles) sent to the hardware via the API, and the Post-Clip Primitives, the amount of primitives within the screen boundaries. We can see that there is a 466k difference, meaning that 39% of the primitives sent to the hardware won’t contribute anything to the frame at all. Considering that the game is heavily geometry limited, this is a great opportunity to optimise.
- #73: What can we do to find where those primitives are being lost. First of all, we can find if some of those calls contribute nothing to the final frame. For this, we have a handy plugin that will select all the draw calls with zero pixel writes. This means that the geometry rendered by these draw calls is entirely clipped, or entirely rejected by the scissors and depth tests. Those calls are particularly expensive as they can go through the entire pipeline (IA->VS->Rasterizer->PS) without contributing anything to the final frame.
- #74: Moreover, it is fairly simple to write your own plugins for the Graphics Frame Analyzer. Plugins are Python scripts, and there is a small API that allows access to the different sets of data (API Log, resources, accessors).