This document provides a cheat sheet for common commands and functions in R for data manipulation, statistical analysis, and graphics. It summarizes key topics such as accessing and manipulating data, conducting statistical tests, fitting linear and generalized linear models, performing clustering and multivariate analyses, and creating basic plots and graphics. The cheat sheet is organized into sections covering basics, vectors and data types, data frames, input/output, indexing, missing values, numerical and tabulation functions, programming, operators, graphics, and statistical models and distributions.
Abstract: This PDSG workshop introduces basic concepts of the argmax equation. The max and argmax equations are contrasted, how argmax is applied to discrete and continuous sets, along with examples.
Level: Fundamental
Requirements: No prior programming or statistics knowledge required.
A short list of the most useful R commands
reference: http://www.personality-project.org/r/r.commands.html
R programı ile ilgilenen veya yeni öğrenmeye başlayan herkes için hazırlanmıştır.
This document summarizes key differences between solving algebraic equations and expressions in MATLAB vs Octave. Both programs can solve basic equations using the "solve" (MATLAB) or "roots" (Octave) commands. MATLAB also has "expand", "collect", and "factor" commands for manipulating expressions symbolically, while Octave requires installing additional symbolic packages to perform these operations. The document provides examples of solving various types of equations (linear, quadratic, higher order) and systems of equations in both programs.
The document discusses recursion and provides examples of recursive functions and algorithms including:
1) A recursive function to calculate the sum of an arithmetic series. It breaks the problem down into smaller sub-problems by recursively calling itself to calculate successive terms until the base case is reached.
2) Binary search illustrated recursively by dividing the search space in half on each recursive call until the target value is found or the space is empty.
3) Mergesort explained as a divide and conquer algorithm that recursively sorts sublists until lists of size 1 are reached and then merges the sorted sublists.
The document discusses recursion and provides examples of recursive algorithms and data structures including arithmetic series, Fibonacci sequence, binary search, and mergesort. Recursion involves breaking a problem down into smaller sub-problems until they can be solved directly, and combining the solutions to solve the original problem. Examples demonstrate how recursion uses function calls to solve problems by dividing them into base cases and recursively calling itself on smaller instances.
This document discusses first-class functions and lambda calculus. It begins with an overview of Alonzo Church and the origins of lambda calculus. It then covers first-class functions in JavaScript, functions as objects in Java, and first-class functions in Scala. The document also discusses generic higher-order functions and control abstraction.
The document discusses different types of functions in MATLAB:
1) Functions allow grouping code to perform tasks and operate in their own workspace separately from the base workspace. They can accept multiple inputs and outputs.
2) Anonymous functions can be defined inline without a file using the @ syntax.
3) Primary functions must be in a file but can call sub-functions defined there as well.
4) Nested functions are defined within another function and share its workspace. Private functions reside in a private subfolder and are only visible locally.
5) Global variables can be shared between functions by declaring them globally at the start of relevant files.
This document provides a cheat sheet of common MATLAB commands organized into the following categories: basic commands, plotting commands, creating matrices/special matrices, matrix operations, data analysis commands, and conditionals/loops. It lists key commands used for things like commenting code, saving/loading variables, plotting graphs, performing mathematical operations on matrices, generating random numbers, and using conditional statements and loops.
The document discusses function composition and recursion in JavaScript. It introduces basic functions like double, square, and inc. It then shows how to work with these functions in an imperative style using a for loop, and in a declarative style using map. It discusses how composition allows building complexity by combining functions. The document also discusses combinators, introducing birds that represent functions like identity, mockingbird, bluebird (compose), lark, and meadowlark. It concludes by explaining the Y-combinator and how it allows recursion using fixed points.
R can be used to analyze data and perform statistical analysis. Key functions include help() and ? to get information on functions, and objects() to view stored objects. Vectors can be created with c() and manipulated using arithmetic operators. Matrices are two-dimensional arrays that can be operated on using *, /, and t(). Larger datasets are typically read from external files using read.table() or read.delim(). Common distributions can be explored using functions like dnorm(), pnorm(), and rnorm(). Statistical analysis includes commands like cov() and cor() to measure covariance and correlation between variables.
This document provides a summary of key functions and commands in the R programming language for getting help, inputting and outputting data, creating and manipulating data, selecting and extracting data, performing mathematical operations, working with dates and times, plotting graphs, and more. It includes brief explanations and examples of commonly used functions like read.table(), plot(), hist(), summary(), str(), and others.
INFORMATIVE ESSAYThe purpose of the Informative Essay assignme.docxcarliotwaycave
INFORMATIVE ESSAY
The purpose of the Informative Essay assignment is to choose a job or task that you know how to do and then write a minimum of 2 full pages, maximum of 3 full pages, Informative Essay teaching the reader how to do that job or task. You will follow the organization techniques explained in Unit 6.
Here are the details:
1. Read the Lecture Notes in Unit 6. You may also find the information in Chapter 10.5 in our text on Process Analysis helpful. The lecture notes will really be the most important to read in writing this assignment. However, here is a link to that chapter that you may look at in addition to the lecture notes:
https://open.lib.umn.edu/writingforsuccess/chapter/10-5-process-analysis/ (Links to an external site.)
2. Choose your topic, that is, the job or task you want to teach. As the notes explain, this should be a job or task that you already know how to do, and it should be something you can do well. At this point, think about your audience (reader). Will your reader need any knowledge or experience to do this job or task, or will you write these instructions for a general reader where no experience is required to perform the job?
3. Plan your outline to organize this essay. Unit 6 notes offer advice on this organization process. Be sure to include an introductory paragraph that has the four main points presented in the lecture notes.
4. Write the essay. It will need to be at least 2 FULL pages long, maximum of 3 full pages long. You will use the MLA formatting that you used in previous essays from Units 3, 4, and 5.
5. Be sure to include a title for your essay.
6. After writing the essay, be sure to take time to read it several times for revision and editing. It would be helpful to have at least one other person proofread it as well before submitting the assignment.
Quiz2
# comments start with #
# to quit q()
# two steps to install any library
#install.packages("rattle")
#library(rattle)
setwd("D:/AJITH/CUMBERLANDS/Ph.D/SEMESTER 3/Data Science & Big Data Analy (ITS-836-51)/RStudio/Week2")
getwd()
x <- 3 # x is a vector of length 1
print(x)
v1 <- c(2,4,6,8,10)
print(v1)
print(v1[3])
v <- c(1:10) #creates a vector of 10 elements numbered 1 through 10. More complicated data
print(v)
print(v[6])
# Import test data
test<-read.csv("CVEs.csv")
test1<-read.csv("CVEs.csv", sep=",")
test2<-read.table("CVEs.csv", sep=",")
write.csv(test2, file="out.csv")
# Write CSV in R
write.table(test1, file = "out1.csv",row.names=TRUE, na="",col.names=TRUE, sep=",")
head(test)
tail(test)
summary(test)
head <- head(test)
tail <- tail(test)
cor(test$X, test$index)
sd(test$index)
var(test$index)
plot(test$index)
hist(test$index)
str(test$index)
quit()
Quiz3
setwd("C:/Users/ialsmadi/Desktop/University_of_Cumberlands/Lectures/Week2/RScripts")
getwd()
# Import test data
data<-read.csv("yearly_sales.csv")
#A 5-number summary is a set of 5 descriptive statistics for summarizing a continuous univariate data set.
#It consists o ...
Presented at 8th Light University London (13th May 2016)
Do this, do that. Coding from assembler to shell scripting, from the mainstream languages of the last century to the mainstream languages now, is dominated by an imperative style. From how we teach variables — they vary, right? — to how we talk about databases, we are constantly looking at state as a thing to be changed and programming languages are structured in terms of the mechanics of change — assignment, loops and how code can be threaded (cautiously) with concurrency.
Functional programming, mark-up languages, schemas, persistent data structures and more are all based around a more declarative approach to code, where instead of reasoning in terms of who does what to whom and what the consequences are, relationships and uses are described, and the flow of execution follows from how functions, data and other structures are composed. This talk will look at the differences between imperative and declarative approaches, offering lessons, habits and techniques that are applicable from requirements through to code and tests in mainstream languages.
This document provides a concise reference card summarizing common functions and operations in R including getting help, input/output, data creation and manipulation, variable conversion and information, plotting, and dates/times. It covers essential functions for loading and saving data, accessing documentation, basic math operations, creating matrices and data frames, subsetting and selecting data, and creating basic plots and graphs.
This document provides a concise reference card summarizing common functions and operations in R including getting help, input and output, data creation, slicing and extracting data, variable conversion and information, data selection and manipulation, math operations, matrices, strings, dates and times, and plotting. It covers essential functions for loading and saving data, accessing documentation, basic data manipulation and common statistical analyses in R.
This document provides an overview of common functions and operations in R including getting help, input and output, data creation and manipulation, variable conversion and information, plotting, and dates and times. It summarizes key functions for loading and saving data, reading from and writing to files, creating vectors, matrices and data frames, subsetting and manipulating data, performing mathematical and statistical operations, working with strings, and creating basic plots. The document is intended as a quick reference guide to common tasks in R.
This reference card summarizes common R functions for getting help, inputting and outputting data, creating and manipulating data, extracting and selecting data, converting variables, getting variable information, and performing mathematical operations. It provides the syntax and brief description for many basic and commonly used R functions across these categories in 3 sentences or less per function.
This document provides an overview of using R for financial modeling. It covers basic R commands for calculations, vectors, matrices, lists, data frames, and importing/exporting data. Graphical functions like plots, bar plots, pie charts, and boxplots are demonstrated. Advanced topics discussed include distributions, parameter estimation, correlations, linear and nonlinear regression, technical analysis packages, and practical exercises involving financial data analysis and modeling.
The document provides information about Mohsin Gulab Tanwari's education details and an assignment given by Sir Afaque Manzoor Soomro. It then summarizes key aspects of MATLAB including its functions, layout, creating variables, plotting graphs, matrix operations, and referencing matrix elements.
R can be used to analyze data and perform statistical analysis. Functions like help(), ? and help.start() provide information about other functions. Objects created in R sessions are stored by name and can be removed with rm(). Vectors like x=c(1,2,3,4,5) can be created and their length checked with length(x). Subsets of vectors can be selected using logical or integer indexes inside square brackets. Matrices are multi-dimensional generalizations of vectors that can be manipulated using operators like * and %. Data can be read into R from external files using functions like read.table() and read.delim(). Common statistical distributions like normal, uniform and exponential are available as functions in R for
The document discusses functional programming and pattern matching. It provides examples of using pattern matching in functional programming to:
1. Match on algebraic data types like lists to traverse and operate on data in a recursive manner. Pattern matching allows adding new operations easily by adding new patterns.
2. Use pattern matching in variable declarations to destructure data like tuples and case class objects.
3. Perform pattern matching on function parameters to selectively apply different logic based on the patterns, like filtering even numbers from a list. Everything can be treated as values and expressions in functional programming.
Solutions for Problems: Engineering Optimization by Ranjan Ganguliindustriale82
Learn to optimize engineering processes with solutions to problems from Engineering Optimization by Ranjan Ganguli. This guide covers linear, nonlinear, and multi-objective optimization methods.
Grouped data frames allow dplyr functions to manipulate each group separately. The group_by() function creates a grouped data frame, while ungroup() removes grouping. Summarise() applies summary functions to columns to create a new table, such as mean() or count(). Join functions combine tables by matching values. Left, right, inner, and full joins retain different combinations of values from the tables.
Smart Mobile App Pitch Deck丨AI Travel App Presentation Templateyojeari421237
🚀 Smart Mobile App Pitch Deck – "Trip-A" | AI Travel App Presentation Template
This professional, visually engaging pitch deck is designed specifically for developers, startups, and tech students looking to present a smart travel mobile app concept with impact.
Whether you're building an AI-powered travel planner or showcasing a class project, Trip-A gives you the edge to impress investors, professors, or clients. Every slide is cleanly structured, fully editable, and tailored to highlight key aspects of a mobile travel app powered by artificial intelligence and real-time data.
💼 What’s Inside:
- Cover slide with sleek app UI preview
- AI/ML module implementation breakdown
- Key travel market trends analysis
- Competitor comparison slide
- Evaluation challenges & solutions
- Real-time data training model (AI/ML)
- “Live Demo” call-to-action slide
🎨 Why You'll Love It:
- Professional, modern layout with mobile app mockups
- Ideal for pitches, hackathons, university presentations, or MVP launches
- Easily customizable in PowerPoint or Google Slides
- High-resolution visuals and smooth gradients
📦 Format:
- PPTX / Google Slides compatible
- 16:9 widescreen
- Fully editable text, charts, and visuals
Understanding the Tor Network and Exploring the Deep Webnabilajabin35
While the Tor network, Dark Web, and Deep Web can seem mysterious and daunting, they are simply parts of the internet that prioritize privacy and anonymity. Using tools like Ahmia and onionland search, users can explore these hidden spaces responsibly and securely. It’s essential to understand the technology behind these networks, as well as the risks involved, to navigate them safely. Visit https://torgol.com/
What's going on with IPv6? presented by Geoff HustonAPNIC
APNIC Chief Scientist, Geoff Huston, presented on the global deployment of IPv6 at the 6th ICANN APAC-TWNIC Engagement Forum and 43rd TWNIC OPM held in Taipei from 22 to 24 April 2025.
APNIC -Policy Development Process, presented at Local APIGA Taiwan 2025APNIC
Joyce Chen, Senior Advisor, Strategic Engagement at APNIC, presented on 'APNIC Policy Development Process' at the Local APIGA Taiwan 2025 event held in Taipei from 19 to 20 April 2025.
Virtualization Trends Streamlining Operations in Telecom with David Bernard ...David Bernard Ezell
The telecommunications industry is undergoing a significant transformation driven by virtualization technologies. Virtualization, which involves the abstraction of hardware resources and the creation of virtual instances of software-based functions, is revolutionizing the way telecom operators design, deploy, and manage their networks. In this blog, we delve into the latest virtualization trends that are reshaping operations in the telecom sector, driving efficiency, agility, and innovation.
Best web hosting Vancouver 2025 for you businesssteve198109
Vancouver in 2025 is more than scenic views, yoga studios, and oat milk lattes—it’s a thriving hub for eco-conscious entrepreneurs looking to make a real difference. If you’ve ever dreamed of launching a purpose-driven business, now is the time. Whether it’s urban mushroom farming, upcycled furniture sales, or vegan skincare sold online, your green idea deserves a strong digital foundation.
The 2025 Canadian eCommerce landscape is being shaped by trends like sustainability, local innovation, and consumer trust. To stay ahead, eco-startups need reliable hosting that aligns with their values. That’s where 4GoodHosting.com comes in—one of the top-rated Vancouver web hosting providers of 2025. Offering secure, sustainable, and Canadian-based hosting solutions, they help green entrepreneurs build their brand with confidence and conscience.
As eCommerce in Canada embraces localism and environmental responsibility, choosing a hosting provider that shares your vision is essential. 4GoodHosting goes beyond just hosting websites—they champion Canadian businesses, sustainable practices, and meaningful growth.
So go ahead—start that eco-friendly venture. With Vancouver web hosting from 4GoodHosting, your green business and your values are in perfect sync.
Reliable Vancouver Web Hosting with Local Servers & 24/7 Supportsteve198109
Looking for powerful and affordable web hosting in Vancouver? 4GoodHosting offers premium Canadian web hosting solutions designed specifically for individuals, startups, and businesses across British Columbia. With local data centers in Vancouver and Toronto, we ensure blazing-fast website speeds, superior uptime, and enhanced data privacy—all critical for your business success in today’s competitive digital landscape.
Our Vancouver web hosting plans are packed with value—starting as low as $2.95/month—and include secure cPanel management, free domain transfer, one-click WordPress installs, and robust email support with anti-spam protection. Whether you're hosting a personal blog, business website, or eCommerce store, our scalable cloud hosting packages are built to grow with you.
Enjoy enterprise-grade features like daily backups, DDoS protection, free SSL certificates, and unlimited bandwidth on select plans. Plus, our expert Canadian support team is available 24/7 to help you every step of the way.
At 4GoodHosting, we understand the needs of local Vancouver businesses. That’s why we focus on speed, security, and service—all hosted on Canadian soil. Start your online journey today with a reliable hosting partner trusted by thousands across Canada.
Top Vancouver Green Business Ideas for 2025 Powered by 4GoodHostingsteve198109
Vancouver in 2025 is more than scenic views, yoga studios, and oat milk lattes—it’s a thriving hub for eco-conscious entrepreneurs looking to make a real difference. If you’ve ever dreamed of launching a purpose-driven business, now is the time. Whether it’s urban mushroom farming, upcycled furniture sales, or vegan skincare sold online, your green idea deserves a strong digital foundation.
The 2025 Canadian eCommerce landscape is being shaped by trends like sustainability, local innovation, and consumer trust. To stay ahead, eco-startups need reliable hosting that aligns with their values. That’s where 4GoodHosting.com comes in—one of the top-rated Vancouver web hosting providers of 2025. Offering secure, sustainable, and Canadian-based hosting solutions, they help green entrepreneurs build their brand with confidence and conscience.
As eCommerce in Canada embraces localism and environmental responsibility, choosing a hosting provider that shares your vision is essential. 4GoodHosting goes beyond just hosting websites—they champion Canadian businesses, sustainable practices, and meaningful growth.
So go ahead—start that eco-friendly venture. With Vancouver web hosting from 4GoodHosting, your green business and your values are in perfect sync.
How to Switch Hosting Providers in Vancouver Without Any Downtimesteve198109
Switching web hosting providers can feel like a daunting task—especially if you're running a business, wellness brand, blog, or eCommerce store in Vancouver that depends on 24/7 uptime. This comprehensive guide walks you through every essential step to migrate your website to a new hosting provider without experiencing any downtime or disruption. Whether you're switching due to slow load times, poor customer service, rising renewal costs, or a desire for better security and scalability, this post ensures you do it right the first time.
From choosing the right local hosting service in Vancouver—such as 4GoodHosting—to backing up your files, testing your new environment, and monitoring DNS changes, every phase is explained with practical tips and tools. You'll also discover why Vancouver-based servers improve your SEO, boost page speed, and offer regionally aligned customer support. Perfect for green startups, wellness entrepreneurs, and growing online stores, this guide helps ensure a smooth transition with no interruptions, lost data, or negative customer experiences.
If you're ready to make the switch and want to protect your brand reputation, maximize website performance, and maintain business continuity, this guide is your roadmap. Let 4GoodHosting help you get started with secure, local, and scalable hosting solutions in Canada.
2. Math.abs(x): Returns the absolute value of a number x.
Math.abs(-5); // Returns 5
Math.ceil(x): Returns the smallest integer greater than or equal to a number x.
Math.ceil(4.3); // Returns 5
Math.floor(x): Returns the largest integer less than or equal to a number x.
Math.floor(4.7); // Returns 4
3. Math.round(x): Returns the value of a number x rounded to the nearest integer.
Math.round(4.5); // Returns 5
Math.max(x1, x2, ...): Returns the largest of zero or more numbers.
Math.max(10, 5, 8); // Returns 10
Math.min(x1, x2, ...): Returns the smallest of zero or more
numbers.
Math.min(10, 5, 8); // Returns 5
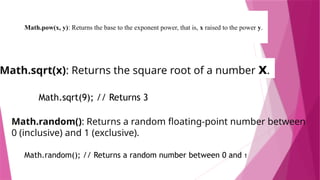
4. Math.pow(x, y): Returns the base to the exponent power, that is, x raised to the power y.
Math.pow(2, 3); // Returns 8
Math.sqrt(x): Returns the square root of a number x.
Math.sqrt(9); // Returns 3
Math.random(): Returns a random floating-point number between
0 (inclusive) and 1 (exclusive).
Math.random(); // Returns a random number between 0 and 1
5. Math.PI: A property representing the ratio of the
circumference of a circle to its diameter,
approximately equal to 3.14159.
Math.PI; // Returns 3.141592653589793