SlideShare a Scribd company logo
PowerAnalyzer 4.0
AGENDA Overview of PowerAnalyzer 4.0 Schema definition - Analytics Design  Creating a Report Working with Report Data Working with the Dashboards Administrating PowerAnalyzer Q & A
Overview Of  PowerAnalyzer 4.0
PRODUCT OVERVIEW Unified Environment PowerAnalyzer Architecture System Requirements  New Features and Enhancement Benefits
PRODUCT OVERVIEW Unified Environment: One Product /One Interface Report Viewing Ad-Hoc  Query Dashboards Mobile Analytic Apps Interface Software Development Kit Broadcasting Analytic  Workflow, Slice & Dice Authentication Portal Integration Enterprise Communications PowerAnalyzer   4 “ All in One” server-based product Reduces deployment costs  Vastly improves BI time-to-market New Performance Management features Six Sigma, Scorecarding Metrics Management Time Series
PRODUCT OVERVIEW PowerAnalyzer Architecture
PRODUCT OVERVIEW System Requirements Main Components Application server Web server PowerAnalyzer Repository   Supporting Components Authentication server Secure Socket Layer server Mail Server
NEW FEATURES AND ENHANCEMENT Analytic Workflows  An analytic workflow is a list of reports linked together in a hierarchy. Workflow reports provide additional data to help answer related business questions .   Broadcasting a Report   Broadcasting a report to multiple users so they can access new or updated reports at the same time. When you broadcast a report, you can email it as a PDF, Excel, HTML, or CSV file .  Expanded Variable Functionality   Using  global and system variables in metric and attribute expressions, as well as report attribute filters .  Export Report Data to Microsoft Excel  Exporting  report data to Excel. When you export report data to Microsoft Excel, you can choose to retain PowerAnalyzer formatting, or use the formatting and formulas in an Excel template that you create. You can also export report data to an Excel PivotTable.
NEW FEATURES AND ENHANCEMENT Filter Identifiers  A filter identifier is another attribute in the report that you want Power Analyzer to use when filtering the report data. You can use filter identifiers to reduce the time to run the report . Filtersets  A filterset is a named filter or set of filters. Once you create a filterset, other users can use it in any report. When you are drilling into a report or using an analytic workflow, you can save your drill filter or analysis as a filterset.  Highlighting Data in a Report  Highlighting  data in a report to identify important data, trends, and patterns at a glance. Informatica PowerAnalyzer allows you to use colors, patterns, or symbols to highlight data.  Improved Calculated Metrics  PowerAnalyzer provides a set of mathematical and statistical functions to help the system administrator create calculated metrics available for reports.
NEW FEATURES AND ENHANCEMENT Improved Custom Metrics   PowerAnalyzer provides a set of mathematical and statistical functions to help you create custom metrics for reports.  Improved Dashboards  Organize alerts, indicators, reports, and shared documents in containers on personal and public dashboards. View all comments on the report or dashboard. Also add feedback in a report or dashboard.  Improved Drilling  Drilling into a report allows you to filter attribute values and see additional attributes in your reports. Drilling anywhere allows you to add attributes and metrics that are not part of the report.  Operational Schema  PowerAnalyzer now supports data sources where data is stored in tables that do not conform to a star schema model and have no specific fact or dimension tables.
NEW FEATURES AND ENHANCEMENT Real-Time Reports   PowerAnalyzer allows you to create real-time reports based on real-time data produced by any application using the Java Message Service (JMS) protocol.  Report Chart  Display multiple charts for a report. PowerAnalyzer can display interactive report charts so you can drill down, zoom, and select sections of the chart .  Time Awareness Time awareness in PowerAnalyzer to recognize time periods that are relative to the current time, such as current quarter or last month.
BENEFITS Enterprise Strength Infrastructure Proven scalability over proprietary application servers Supports broad deployment to more users Scalable and flexible pricing model Support 70+% of J2EE Application Server Market BEA Weblogic IBM Websphere Sun SunONE  High Performance  Clustering Support for BEA  High Availability for 24x7 Operations Real-time Integration with PowerCenter Platform Embedded support for Real-time Mobile Delivery
Schema Design
SCHEMA DESIGN  Non – Star Schema Star Schema Schema Design
SCHEMA DESIGN – STAR SCHEMA Creating Data Source Importing Table Definition Defining Dimension Tables Defining Fact Tables Non – Star Schema Data Connectors Real-time Data
DATA SOURCE-OVERVIEW Data Source contains the Connectivity Information that enables Power Analyzer to connect to a data warehouse Data Source is a Connection to a Dimensional Data warehouse in a Relational database . It can also be a connection to a Power center repository Data source needs the following information for the data warehouse that need to be accessed Types of Database server JDBC Connection  String Database Login
CREATING A DATA SOURCE-STEPS 1.Click Administration> Schema Design> Data Source
CREATING A DATA SOURCE-STEPS 2.Click Add to Display Data Source Page
CREATING A DATA SOURCE 3.Enter the Data Source Properties
TABLE DEFINITION-OVERVIEW While Importing the Table Definition PowerAnalyzer store the Definitions in the repository  Definition Exist Independent of a Specific Database Cannot import the table definition already exist  If the name of the table changes , delete the table definition in the PowerAnalyzer  If the definitions of the table changes then refresh the table definition
IMPORTING TABLE DEFINITION-STEPS 1. Click Administration> Schema Design>Table Definition 2. Click Add to display table page
IMPORTING TABLE DEFINITION-STEPS 3. Select the Data Source 4. Import Tables from other users (Optional)
IMPORTING TABLE DEFINITION-STEPS 5. Load the tables 6. Click Ok to Import Tables
DIMENSION TABLES - OVERVIEW Dimension tables contains the elements or attributes that characterize a business metric It can include any aspects of business process such as Fiscal Year, Customer Name or Sales region To define a  Dimensional table, select from the list of  table definition Star Schema typically contains many dimensional tables Template Dimension - To avoid Defining A dimension more than once , can setup a Template Dimension. Example: Customer dimension
DEFINING DIMENSION TABLES - STEPS 1.Select the Dimension table and primary key 1.1 Click Administration> Schema Design>Analytic schemas 1.2 From the show list , select dimension tables
DEFINING DIMENSION TABLES - STEPS 1.3 Click Add to display the Dimension table Page
DEFINING DIMENSION TABLES - STEPS 1.4 Select button next to the table name to list tables 1.5 Select table and click ok 2.0   Set the Properties of Dimension table
DEFINING DIMENSION TABLES 3.Identify the dimension attributes 3.1 In the dimension column section of the Dimension Table  page  Click Add to display the list of selected attributes page
DEFINING DIMENSION TABLES 3.2  Select the type of column  3.3  Prefix can be set by selecting prefix the unique name 3.4  From the list of dimension table columns , select the attributes  that need to be included  3.5  Click Ok  4.0  Save the Dimension table definition
FACT TABLES - OVERVIEW A fact table contains the metrics which measures the business A fact table contains four types of column Time Key: Which associate the time dimension table to the fact table Dimension Key: Which Joins the dimension table to the fact table Metric: Measure to evaluate the business process Attribute: Attributes in fact table are tied to a metric
DEFINING FACT TABLES-STEPS 1.Select the fact table and set the table properties 1.1 Click administration> Schema Design > Analytic Schema 1.2 From the show list , Select Fact tables
DEFINING FACT TABLES - STEPS 1.3 Click add to display the fact table page  1.4 Click Select button next to table name to display the list of  tables
DEFINING FACT TABLES - STEPS 1.5 Select a table name , PowerAnalyzer sets the default properties  from the repository  1.6 Click Ok
DEFINING FACT TABLES - STEPS 2. Set up the time keys 2.1  In the time key section of the fact table page Click Add from table.  The fact table columns page displays the list of columns in the table
DEFINING FACT TABLES - STEPS 2.2 Select the type of columns. 2.3 To include a column as a time key in the fact table, select the  time key property next to column name. 2.4 Click next to display Map time key page display 2.5 Select the granularity of the time key  2.6 Click done
DEFINING FACT TABLES- STEPS 3. Set up the dimension keys, Metric and attributes 3.1 In the dimension key section of the fact table page, Click Add  from table.  The Fact columns Page displays a list of columns in the table
DEFINING FACT TABLES - STEPS 3.2  Select the type of columns to see in  the list  3.3  To set prefix to column ,check the box above with label prefix the  unique name  3.4  From the list of fact columns , select the metrics , attributes, or  dimension key to include in the fact table 3.5  Click next , displays the Map dimension key page with the list of  selected dimension key  3.6  Select the dimension table for each dimension Key 3.7  Click done 4.0 Save the Definition
NON-STAR SCHEMA - OVERVIEW  PowerAnalyzer supports data source that do not conform to a star schema model  PowerAnalyzer does not support aggregate tables or time dimension with the Operational schema We can Perform the following task related to operational schemas Define a Operational Schema Modify a operational schema Remove or Disable Operational Schema
NON-STAR SCHEMA - STEPS 1. Create the Operational Scheme and set the schema properties 1.1 Click Administration>Schema Design>Operational Schemas  Displays  the list of operational schema defined in the repository
NON-STAR SCHEMA  - STEPS 1.2 Click Add , Operational Schema Page displays 1.3 Enter the Properties of the Operational Schema
NON-STAR SCHEMA - STEPS 2. Add Tables to the Operational Schema 2.1 In the tables section of the operational schema page , Click Add  The select table Page displays the list of tables available in the repository
NON-STAR SCHEMA - STEPS 2.2  If required we can set prefix to table name ,checking the relevant box 2.3  Select the tables to be included in the schema and click Add >> 2.4  Click OK
NON-STAR SCHEMA - STEPS 3. Identify the metrics and attributes in each table 3.1 In the tables section of the operational page, click the name of the table to define the metric . The Operational Schema Page is displayed
NON-STAR SCHEMA - STEPS 3.2 In the metric or attribute section , Click Add from table 3.4 From the available column list, Select the metric or attributes to be  included in the table and click Add >> 3.5 Click Ok
NON-STAR SCHEMA - STEPS 4. Setup the Relationship among the table Figure shows the  relationship among the tables in valid and Invalid  operational schema
NON-STAR SCHEMA - STEPS Setup the Relationship among the table 4.1  In the join Section of the operational Schema page click Add >>   Displays the join Properties page
NON-STAR SCHEMA OR ODS 4.2 Select the join type for relation, by default it is inner join  4.3 In table1 select the table from the left side of the join 4.4 In table2 select the table for the right side of the join  4.5 Select the column and operators for the join expression  4.6 Click OK   and Save
DATA CONNECTORS - OVERVIEW Data Connector describes the data source, Time dimension, schemas  for specific users or groups that needs to run reports against specific schemas. Data Connector that is available to all users is called  system connector Only one of the Data Connectors can be active at any one time
DATA CONNECTORS- CREATE STEPS Click Administration > Schema Design > Data Connectors   List of data connectors is displayed
DATA CONNECTORS- CREATE STEPS 2. Click Add The Data connector page is displayed
DATA CONNECTORS- CREATE STEPS 3. Enter the Connector Properties listed 4. Click Ok
ADDING DATA SOURCE TO DATA CONNECTORS- STEPS 1. Click Add Administration > Schema Design >Data Connectors 2. Create or modify Data Connectors
ADDING DATA SOURCE TO DATA CONNECTORS- STEPS 3. Enter the data connectors properties and select primary data source 4. In the Additional Schema Mapping task area , Click Add Displays the list of data Source, time Dimension, and Schemas
ADDING DATA SOURCE TO DATA CONNECTORS- STEPS 5. Select the Data Source from the list 6. Select time dimension form the list (optional) 7. Select schema from the schemas list Schema can be star schema :Select Fact and Dimension tables Schema can be non star : Select all tables 8. Click Add to move the schema to  the selected schema list
ADDING DATA SOURCE TO DATA CONNECTORS- STEPS 9. Click Add 10.Click Ok
REAL-TIME DATA - OVERVIEW PowerAnalyzer allows to create reports based on real- time data Real time data can come from any application that produce real time messages using JMS( Java Messaging service) PowerAnalyzer read those messages in the JMS Provider and displays the data in a Power Analyzer real time report To set up a real-time connector , requires a JMS provider set up with a destination queue or topic
REAL-TIME DATA - STEPS 1. Click Administration > Real-time Configuration > Real-time Connectors List of real-time connectors defined will be displayed
REAL-TIME DATA - STEPS 2. Click Add Real-time Connector page displays
REAL-TIME DATA - STEPS 3. Enter the Properties 4. Click Test to verify the connection to the JMS topic or queue 5. Click Ok to Save

More Related Content

What's hot (18)

PDF
Financial reporting rpd using obiee
Amit Sharma
 
PDF
Oracle Financials R12 - GL STEP 3 - Journal Controls
Mohammed Raouf
 
DOCX
Defining key flexfields
runjithrocking
 
PDF
Developer's guide to customization
Ahmed Farag
 
PDF
Oracle applications sla r12 SLA- demos
Ali Ibrahim
 
PDF
Mr20 enus 07-Report Design in Management Reporter 2.0 for Microsoft Dynamics®...
Sami JAMMALI
 
PDF
Quick start guide field placement
taskstream
 
PPTX
TimeCard for Outlook - Workgroup version
Peter Kalmstrom
 
PDF
Mdm255 exercise
Surendar Reddy C
 
DOCX
How to Create Oracle Fusion BI Publisher Report Using RTF Template
Feras Ahmad
 
PDF
Financials Cloud and Planning and Budgeting Cloud Service White Paper
Matthew Skurdahl
 
DOCX
REPORT ON (1)
Ankit Karwa
 
PDF
Oracle Payables R12 ivas
Ali Ibrahim
 
PPTX
Ragic Database design 101
Ragic
 
PPT
Chapter12 (1)
Rajalaxmi Pattanaik
 
PDF
Oracle Fixed assets ivas
Ali Ibrahim
 
DOCX
Oracle HRMS Fast Formula
runjithrocking
 
PDF
Quick start program activity reports
taskstream
 
Financial reporting rpd using obiee
Amit Sharma
 
Oracle Financials R12 - GL STEP 3 - Journal Controls
Mohammed Raouf
 
Defining key flexfields
runjithrocking
 
Developer's guide to customization
Ahmed Farag
 
Oracle applications sla r12 SLA- demos
Ali Ibrahim
 
Mr20 enus 07-Report Design in Management Reporter 2.0 for Microsoft Dynamics®...
Sami JAMMALI
 
Quick start guide field placement
taskstream
 
TimeCard for Outlook - Workgroup version
Peter Kalmstrom
 
Mdm255 exercise
Surendar Reddy C
 
How to Create Oracle Fusion BI Publisher Report Using RTF Template
Feras Ahmad
 
Financials Cloud and Planning and Budgeting Cloud Service White Paper
Matthew Skurdahl
 
REPORT ON (1)
Ankit Karwa
 
Oracle Payables R12 ivas
Ali Ibrahim
 
Ragic Database design 101
Ragic
 
Chapter12 (1)
Rajalaxmi Pattanaik
 
Oracle Fixed assets ivas
Ali Ibrahim
 
Oracle HRMS Fast Formula
runjithrocking
 
Quick start program activity reports
taskstream
 

Similar to Informatica PowerAnalyzer 4.0 1 of 3 (20)

PPTX
Sas visual analytics Training
bidwhm
 
PPT
Demo Guidebook 040110
Brad Ganas
 
PDF
Power bi slide share pdf it is a very important
Satyabratarath5
 
PPT
Informatica PowerAnalyzer 4.0 2 of 3
ganblues
 
PPTX
Building-Interactive-Dashboards-in-Tableau
Augmented Systems
 
DOCX
Create a basic performance point dashboard epc
EPC Group
 
PDF
whitepaper_advanced_analytics_with_tableau_eng
S. Hanau
 
PDF
CaseStudy-MohammedImranAlam-Xcelsius
Mohammed Imran Alam
 
PPT
Data Alchemy Overview Presentation (Static Version)
Mark Rubenstein
 
PDF
Funções DAX.pdf
Joao Vaz
 
PPT
SSRS 2008 R2
tomerl
 
PDF
Microsoft Excel Dashboards and Their Features.pdf
Nitin
 
PPT
It ready dw_day4_rev00
Siwawong Wuttipongprasert
 
PPT
MicroStrategy - Effective Business Dashboards
MicroStrategy Nederland
 
PPTX
DSN_Power BIDSN_Power BIDSN_Power BIDSN_Power BIDSN_Power BIDSN_Power BI
EzekielJames8
 
PDF
knowledgeforumpowerbitrainingnew-230816140827-5eb14be7.pdf
Rame28
 
PDF
PowerBI Training
Knowledge And Skill Forum
 
PDF
IBM SPSS Custom Tables create custom tabls inn no time.pdf
ahmedmaths03
 
PPTX
this ppt contains tableau in deep learning techniques
msivakumar1031976111
 
PDF
Business Intelligence Technology Presentation
John Paredes
 
Sas visual analytics Training
bidwhm
 
Demo Guidebook 040110
Brad Ganas
 
Power bi slide share pdf it is a very important
Satyabratarath5
 
Informatica PowerAnalyzer 4.0 2 of 3
ganblues
 
Building-Interactive-Dashboards-in-Tableau
Augmented Systems
 
Create a basic performance point dashboard epc
EPC Group
 
whitepaper_advanced_analytics_with_tableau_eng
S. Hanau
 
CaseStudy-MohammedImranAlam-Xcelsius
Mohammed Imran Alam
 
Data Alchemy Overview Presentation (Static Version)
Mark Rubenstein
 
Funções DAX.pdf
Joao Vaz
 
SSRS 2008 R2
tomerl
 
Microsoft Excel Dashboards and Their Features.pdf
Nitin
 
It ready dw_day4_rev00
Siwawong Wuttipongprasert
 
MicroStrategy - Effective Business Dashboards
MicroStrategy Nederland
 
DSN_Power BIDSN_Power BIDSN_Power BIDSN_Power BIDSN_Power BIDSN_Power BI
EzekielJames8
 
knowledgeforumpowerbitrainingnew-230816140827-5eb14be7.pdf
Rame28
 
PowerBI Training
Knowledge And Skill Forum
 
IBM SPSS Custom Tables create custom tabls inn no time.pdf
ahmedmaths03
 
this ppt contains tableau in deep learning techniques
msivakumar1031976111
 
Business Intelligence Technology Presentation
John Paredes
 
Ad

More from ganblues (7)

PPT
Zackman frame work
ganblues
 
PPT
Data Warehouse
ganblues
 
PPT
Building the DW - ETL
ganblues
 
PPT
Warehouse components
ganblues
 
PPT
Informatica Server Manager
ganblues
 
PPT
Informatica Designer Module
ganblues
 
PPT
Informatica Power Center 7.1
ganblues
 
Zackman frame work
ganblues
 
Data Warehouse
ganblues
 
Building the DW - ETL
ganblues
 
Warehouse components
ganblues
 
Informatica Server Manager
ganblues
 
Informatica Designer Module
ganblues
 
Informatica Power Center 7.1
ganblues
 
Ad

Recently uploaded (20)

PDF
CIFDAQ's Market Wrap : Bears Back in Control?
CIFDAQ
 
PDF
AI Unleashed - Shaping the Future -Starting Today - AIOUG Yatra 2025 - For Co...
Sandesh Rao
 
PDF
RAT Builders - How to Catch Them All [DeepSec 2024]
malmoeb
 
PPTX
AI Code Generation Risks (Ramkumar Dilli, CIO, Myridius)
Priyanka Aash
 
PPTX
Simple and concise overview about Quantum computing..pptx
mughal641
 
PDF
Peak of Data & AI Encore - Real-Time Insights & Scalable Editing with ArcGIS
Safe Software
 
PDF
State-Dependent Conformal Perception Bounds for Neuro-Symbolic Verification
Ivan Ruchkin
 
PPTX
Farrell_Programming Logic and Design slides_10e_ch02_PowerPoint.pptx
bashnahara11
 
PPTX
Agile Chennai 18-19 July 2025 | Emerging patterns in Agentic AI by Bharani Su...
AgileNetwork
 
PDF
Research-Fundamentals-and-Topic-Development.pdf
ayesha butalia
 
PDF
The Future of Artificial Intelligence (AI)
Mukul
 
PPTX
AI and Robotics for Human Well-being.pptx
JAYMIN SUTHAR
 
PDF
GDG Cloud Munich - Intro - Luiz Carneiro - #BuildWithAI - July - Abdel.pdf
Luiz Carneiro
 
PDF
How Open Source Changed My Career by abdelrahman ismail
a0m0rajab1
 
PDF
NewMind AI Weekly Chronicles – July’25, Week III
NewMind AI
 
PDF
introduction to computer hardware and sofeware
chauhanshraddha2007
 
PDF
Google I/O Extended 2025 Baku - all ppts
HusseinMalikMammadli
 
PDF
Responsible AI and AI Ethics - By Sylvester Ebhonu
Sylvester Ebhonu
 
PPTX
Dev Dives: Automate, test, and deploy in one place—with Unified Developer Exp...
AndreeaTom
 
PPTX
OA presentation.pptx OA presentation.pptx
pateldhruv002338
 
CIFDAQ's Market Wrap : Bears Back in Control?
CIFDAQ
 
AI Unleashed - Shaping the Future -Starting Today - AIOUG Yatra 2025 - For Co...
Sandesh Rao
 
RAT Builders - How to Catch Them All [DeepSec 2024]
malmoeb
 
AI Code Generation Risks (Ramkumar Dilli, CIO, Myridius)
Priyanka Aash
 
Simple and concise overview about Quantum computing..pptx
mughal641
 
Peak of Data & AI Encore - Real-Time Insights & Scalable Editing with ArcGIS
Safe Software
 
State-Dependent Conformal Perception Bounds for Neuro-Symbolic Verification
Ivan Ruchkin
 
Farrell_Programming Logic and Design slides_10e_ch02_PowerPoint.pptx
bashnahara11
 
Agile Chennai 18-19 July 2025 | Emerging patterns in Agentic AI by Bharani Su...
AgileNetwork
 
Research-Fundamentals-and-Topic-Development.pdf
ayesha butalia
 
The Future of Artificial Intelligence (AI)
Mukul
 
AI and Robotics for Human Well-being.pptx
JAYMIN SUTHAR
 
GDG Cloud Munich - Intro - Luiz Carneiro - #BuildWithAI - July - Abdel.pdf
Luiz Carneiro
 
How Open Source Changed My Career by abdelrahman ismail
a0m0rajab1
 
NewMind AI Weekly Chronicles – July’25, Week III
NewMind AI
 
introduction to computer hardware and sofeware
chauhanshraddha2007
 
Google I/O Extended 2025 Baku - all ppts
HusseinMalikMammadli
 
Responsible AI and AI Ethics - By Sylvester Ebhonu
Sylvester Ebhonu
 
Dev Dives: Automate, test, and deploy in one place—with Unified Developer Exp...
AndreeaTom
 
OA presentation.pptx OA presentation.pptx
pateldhruv002338
 

Informatica PowerAnalyzer 4.0 1 of 3

  • 2. AGENDA Overview of PowerAnalyzer 4.0 Schema definition - Analytics Design Creating a Report Working with Report Data Working with the Dashboards Administrating PowerAnalyzer Q & A
  • 3. Overview Of PowerAnalyzer 4.0
  • 4. PRODUCT OVERVIEW Unified Environment PowerAnalyzer Architecture System Requirements New Features and Enhancement Benefits
  • 5. PRODUCT OVERVIEW Unified Environment: One Product /One Interface Report Viewing Ad-Hoc Query Dashboards Mobile Analytic Apps Interface Software Development Kit Broadcasting Analytic Workflow, Slice & Dice Authentication Portal Integration Enterprise Communications PowerAnalyzer 4 “ All in One” server-based product Reduces deployment costs Vastly improves BI time-to-market New Performance Management features Six Sigma, Scorecarding Metrics Management Time Series
  • 7. PRODUCT OVERVIEW System Requirements Main Components Application server Web server PowerAnalyzer Repository Supporting Components Authentication server Secure Socket Layer server Mail Server
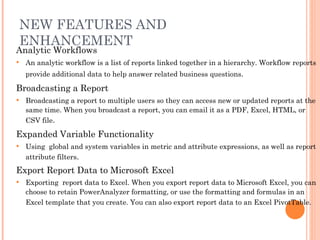
  • 8. NEW FEATURES AND ENHANCEMENT Analytic Workflows An analytic workflow is a list of reports linked together in a hierarchy. Workflow reports provide additional data to help answer related business questions . Broadcasting a Report Broadcasting a report to multiple users so they can access new or updated reports at the same time. When you broadcast a report, you can email it as a PDF, Excel, HTML, or CSV file . Expanded Variable Functionality Using global and system variables in metric and attribute expressions, as well as report attribute filters . Export Report Data to Microsoft Excel Exporting report data to Excel. When you export report data to Microsoft Excel, you can choose to retain PowerAnalyzer formatting, or use the formatting and formulas in an Excel template that you create. You can also export report data to an Excel PivotTable.
  • 9. NEW FEATURES AND ENHANCEMENT Filter Identifiers A filter identifier is another attribute in the report that you want Power Analyzer to use when filtering the report data. You can use filter identifiers to reduce the time to run the report . Filtersets A filterset is a named filter or set of filters. Once you create a filterset, other users can use it in any report. When you are drilling into a report or using an analytic workflow, you can save your drill filter or analysis as a filterset. Highlighting Data in a Report Highlighting data in a report to identify important data, trends, and patterns at a glance. Informatica PowerAnalyzer allows you to use colors, patterns, or symbols to highlight data. Improved Calculated Metrics PowerAnalyzer provides a set of mathematical and statistical functions to help the system administrator create calculated metrics available for reports.
  • 10. NEW FEATURES AND ENHANCEMENT Improved Custom Metrics PowerAnalyzer provides a set of mathematical and statistical functions to help you create custom metrics for reports. Improved Dashboards Organize alerts, indicators, reports, and shared documents in containers on personal and public dashboards. View all comments on the report or dashboard. Also add feedback in a report or dashboard. Improved Drilling Drilling into a report allows you to filter attribute values and see additional attributes in your reports. Drilling anywhere allows you to add attributes and metrics that are not part of the report. Operational Schema PowerAnalyzer now supports data sources where data is stored in tables that do not conform to a star schema model and have no specific fact or dimension tables.
  • 11. NEW FEATURES AND ENHANCEMENT Real-Time Reports PowerAnalyzer allows you to create real-time reports based on real-time data produced by any application using the Java Message Service (JMS) protocol. Report Chart Display multiple charts for a report. PowerAnalyzer can display interactive report charts so you can drill down, zoom, and select sections of the chart . Time Awareness Time awareness in PowerAnalyzer to recognize time periods that are relative to the current time, such as current quarter or last month.
  • 12. BENEFITS Enterprise Strength Infrastructure Proven scalability over proprietary application servers Supports broad deployment to more users Scalable and flexible pricing model Support 70+% of J2EE Application Server Market BEA Weblogic IBM Websphere Sun SunONE High Performance Clustering Support for BEA High Availability for 24x7 Operations Real-time Integration with PowerCenter Platform Embedded support for Real-time Mobile Delivery
  • 14. SCHEMA DESIGN Non – Star Schema Star Schema Schema Design
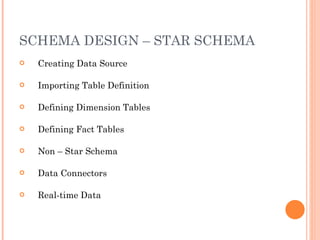
  • 15. SCHEMA DESIGN – STAR SCHEMA Creating Data Source Importing Table Definition Defining Dimension Tables Defining Fact Tables Non – Star Schema Data Connectors Real-time Data
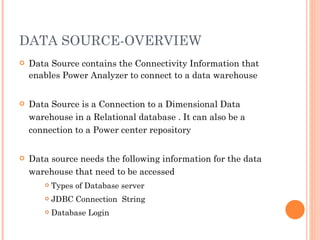
  • 16. DATA SOURCE-OVERVIEW Data Source contains the Connectivity Information that enables Power Analyzer to connect to a data warehouse Data Source is a Connection to a Dimensional Data warehouse in a Relational database . It can also be a connection to a Power center repository Data source needs the following information for the data warehouse that need to be accessed Types of Database server JDBC Connection String Database Login
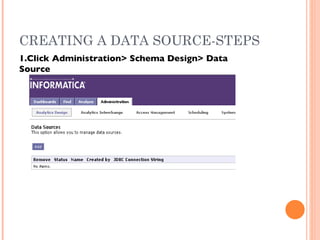
  • 17. CREATING A DATA SOURCE-STEPS 1.Click Administration> Schema Design> Data Source
  • 18. CREATING A DATA SOURCE-STEPS 2.Click Add to Display Data Source Page
  • 19. CREATING A DATA SOURCE 3.Enter the Data Source Properties
  • 20. TABLE DEFINITION-OVERVIEW While Importing the Table Definition PowerAnalyzer store the Definitions in the repository Definition Exist Independent of a Specific Database Cannot import the table definition already exist If the name of the table changes , delete the table definition in the PowerAnalyzer If the definitions of the table changes then refresh the table definition
  • 21. IMPORTING TABLE DEFINITION-STEPS 1. Click Administration> Schema Design>Table Definition 2. Click Add to display table page
  • 22. IMPORTING TABLE DEFINITION-STEPS 3. Select the Data Source 4. Import Tables from other users (Optional)
  • 23. IMPORTING TABLE DEFINITION-STEPS 5. Load the tables 6. Click Ok to Import Tables
  • 24. DIMENSION TABLES - OVERVIEW Dimension tables contains the elements or attributes that characterize a business metric It can include any aspects of business process such as Fiscal Year, Customer Name or Sales region To define a Dimensional table, select from the list of table definition Star Schema typically contains many dimensional tables Template Dimension - To avoid Defining A dimension more than once , can setup a Template Dimension. Example: Customer dimension
  • 25. DEFINING DIMENSION TABLES - STEPS 1.Select the Dimension table and primary key 1.1 Click Administration> Schema Design>Analytic schemas 1.2 From the show list , select dimension tables
  • 26. DEFINING DIMENSION TABLES - STEPS 1.3 Click Add to display the Dimension table Page
  • 27. DEFINING DIMENSION TABLES - STEPS 1.4 Select button next to the table name to list tables 1.5 Select table and click ok 2.0 Set the Properties of Dimension table
  • 28. DEFINING DIMENSION TABLES 3.Identify the dimension attributes 3.1 In the dimension column section of the Dimension Table page Click Add to display the list of selected attributes page
  • 29. DEFINING DIMENSION TABLES 3.2 Select the type of column 3.3 Prefix can be set by selecting prefix the unique name 3.4 From the list of dimension table columns , select the attributes that need to be included 3.5 Click Ok 4.0 Save the Dimension table definition
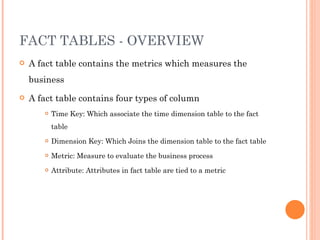
  • 30. FACT TABLES - OVERVIEW A fact table contains the metrics which measures the business A fact table contains four types of column Time Key: Which associate the time dimension table to the fact table Dimension Key: Which Joins the dimension table to the fact table Metric: Measure to evaluate the business process Attribute: Attributes in fact table are tied to a metric
  • 31. DEFINING FACT TABLES-STEPS 1.Select the fact table and set the table properties 1.1 Click administration> Schema Design > Analytic Schema 1.2 From the show list , Select Fact tables
  • 32. DEFINING FACT TABLES - STEPS 1.3 Click add to display the fact table page 1.4 Click Select button next to table name to display the list of tables
  • 33. DEFINING FACT TABLES - STEPS 1.5 Select a table name , PowerAnalyzer sets the default properties from the repository 1.6 Click Ok
  • 34. DEFINING FACT TABLES - STEPS 2. Set up the time keys 2.1 In the time key section of the fact table page Click Add from table. The fact table columns page displays the list of columns in the table
  • 35. DEFINING FACT TABLES - STEPS 2.2 Select the type of columns. 2.3 To include a column as a time key in the fact table, select the time key property next to column name. 2.4 Click next to display Map time key page display 2.5 Select the granularity of the time key 2.6 Click done
  • 36. DEFINING FACT TABLES- STEPS 3. Set up the dimension keys, Metric and attributes 3.1 In the dimension key section of the fact table page, Click Add from table. The Fact columns Page displays a list of columns in the table
  • 37. DEFINING FACT TABLES - STEPS 3.2 Select the type of columns to see in the list 3.3 To set prefix to column ,check the box above with label prefix the unique name 3.4 From the list of fact columns , select the metrics , attributes, or dimension key to include in the fact table 3.5 Click next , displays the Map dimension key page with the list of selected dimension key 3.6 Select the dimension table for each dimension Key 3.7 Click done 4.0 Save the Definition
  • 38. NON-STAR SCHEMA - OVERVIEW PowerAnalyzer supports data source that do not conform to a star schema model PowerAnalyzer does not support aggregate tables or time dimension with the Operational schema We can Perform the following task related to operational schemas Define a Operational Schema Modify a operational schema Remove or Disable Operational Schema
  • 39. NON-STAR SCHEMA - STEPS 1. Create the Operational Scheme and set the schema properties 1.1 Click Administration>Schema Design>Operational Schemas Displays the list of operational schema defined in the repository
  • 40. NON-STAR SCHEMA - STEPS 1.2 Click Add , Operational Schema Page displays 1.3 Enter the Properties of the Operational Schema
  • 41. NON-STAR SCHEMA - STEPS 2. Add Tables to the Operational Schema 2.1 In the tables section of the operational schema page , Click Add The select table Page displays the list of tables available in the repository
  • 42. NON-STAR SCHEMA - STEPS 2.2 If required we can set prefix to table name ,checking the relevant box 2.3 Select the tables to be included in the schema and click Add >> 2.4 Click OK
  • 43. NON-STAR SCHEMA - STEPS 3. Identify the metrics and attributes in each table 3.1 In the tables section of the operational page, click the name of the table to define the metric . The Operational Schema Page is displayed
  • 44. NON-STAR SCHEMA - STEPS 3.2 In the metric or attribute section , Click Add from table 3.4 From the available column list, Select the metric or attributes to be included in the table and click Add >> 3.5 Click Ok
  • 45. NON-STAR SCHEMA - STEPS 4. Setup the Relationship among the table Figure shows the relationship among the tables in valid and Invalid operational schema
  • 46. NON-STAR SCHEMA - STEPS Setup the Relationship among the table 4.1 In the join Section of the operational Schema page click Add >> Displays the join Properties page
  • 47. NON-STAR SCHEMA OR ODS 4.2 Select the join type for relation, by default it is inner join 4.3 In table1 select the table from the left side of the join 4.4 In table2 select the table for the right side of the join 4.5 Select the column and operators for the join expression 4.6 Click OK and Save
  • 48. DATA CONNECTORS - OVERVIEW Data Connector describes the data source, Time dimension, schemas for specific users or groups that needs to run reports against specific schemas. Data Connector that is available to all users is called system connector Only one of the Data Connectors can be active at any one time
  • 49. DATA CONNECTORS- CREATE STEPS Click Administration > Schema Design > Data Connectors List of data connectors is displayed
  • 50. DATA CONNECTORS- CREATE STEPS 2. Click Add The Data connector page is displayed
  • 51. DATA CONNECTORS- CREATE STEPS 3. Enter the Connector Properties listed 4. Click Ok
  • 52. ADDING DATA SOURCE TO DATA CONNECTORS- STEPS 1. Click Add Administration > Schema Design >Data Connectors 2. Create or modify Data Connectors
  • 53. ADDING DATA SOURCE TO DATA CONNECTORS- STEPS 3. Enter the data connectors properties and select primary data source 4. In the Additional Schema Mapping task area , Click Add Displays the list of data Source, time Dimension, and Schemas
  • 54. ADDING DATA SOURCE TO DATA CONNECTORS- STEPS 5. Select the Data Source from the list 6. Select time dimension form the list (optional) 7. Select schema from the schemas list Schema can be star schema :Select Fact and Dimension tables Schema can be non star : Select all tables 8. Click Add to move the schema to the selected schema list
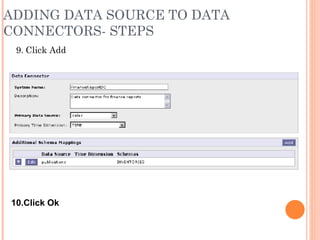
  • 55. ADDING DATA SOURCE TO DATA CONNECTORS- STEPS 9. Click Add 10.Click Ok
  • 56. REAL-TIME DATA - OVERVIEW PowerAnalyzer allows to create reports based on real- time data Real time data can come from any application that produce real time messages using JMS( Java Messaging service) PowerAnalyzer read those messages in the JMS Provider and displays the data in a Power Analyzer real time report To set up a real-time connector , requires a JMS provider set up with a destination queue or topic
  • 57. REAL-TIME DATA - STEPS 1. Click Administration > Real-time Configuration > Real-time Connectors List of real-time connectors defined will be displayed
  • 58. REAL-TIME DATA - STEPS 2. Click Add Real-time Connector page displays
  • 59. REAL-TIME DATA - STEPS 3. Enter the Properties 4. Click Test to verify the connection to the JMS topic or queue 5. Click Ok to Save

Editor's Notes

  • #29: Selecting Attributes from the list of dimension table Defining a new dimension attribute and setting the attribute properties
  • #35: Select time key from a list of fact table column Define a time key and set the properties
  • #37: Select dimension keys, metric or attributes from a list of fact table columns In the Dimension key section, define a dimension key and set the properties In the Metric Section, define a metric and set the properties In the Attribute section , define an attribute and set the properties
  • #42: Select tables from table definitions defined in the repository Define a table and set its properties
  • #44: Select metrics or attributes from a list of table columns In the metric session , define a metric and set its properties In the attribute session, define an attribute and set its properties
  • #46: Rules: Each table must be related to one other table in the schema Each table can be related to another table in the schema in only one way Relationship among the tables can be defined either in automatic/custom mode