SlideShare a Scribd company logo
Creation of Report
CREATION OF REPORT Select Metrics Select Attributes Select Time, Filter, Ranking Layout and Setup Analytical Workflow Publish
METRIC - OVERVIEW Metric are the measure used to evaluate the business process Metric folder contains the metric and it resides in the schema directory For example sales, cost , Revenue are the metrics that talk about your business  A calculated metric contains mathematical expression based on a metric from one or more fact tables
SELECT METRICS - STEPS 1. Click Create Report >>Select Metrics :  A list of metric folder displays in the metric folder task area
SELECT METRICS - STEPS 4. Click the metric folder from where metric to be added  5. Click the metric to be added in the report , Selected metric appears in the box Select metrics In the detail task area, from the analyze time series by list, select the time key for the metric To change the Order of the metric ,click move button up and down To create Prompt for a Metric , select prompt values Click Save
ATTRIBUTES - OVERVIEW Attributes are the factors that determines the value of a metric  Attribute Folder contains attributes. The attribute folder resides in the schema directory  For example Product, Region, Time are attributes Following task can be performed on the attributes Create a prompts for a attribute Setting up a time attribute Creating a query to search for an attribute
SELECT ATTRIBUTE - STEPS Click Create Report >Select Attributes  A list of attributes folder displays in the attribute folder task area
SELECT ATTRIBUTES - STEPS 2. Click the attribute folder from where attributes to be added 3. Select  the attribute to be added in the report 4. Click Add , Selected attributes appear in the box under select attributes 5. To change the Order of the metric ,click move button up and down 6. To create Prompt for a Metric , select prompt values 7. Click Save
TIME - OVERVIEW Setting the Time: Setting the time for a report helps to   compare metrics across time periods.  Time settings is done by selecting values for these options Calendar (Common, Fiscal , Custom) Time Period (Relative , Absolute) Granularity for the Time Period Refinements for the time period and granularity (Comparison, Calculation, Exclusion)
SELECT TIME - STEPS 1. Click >Create Report > Select Time, Filters and Rankings>Time  The Time Tab Displays
SELECT TIME - STEPS 2. From the Calendar list , select a calendar for time attributes 3. From the Time period list , select a time period for the data to be displayed in the report
SELECT TIME - STEPS 4. Selecting the granularity of the time period is optional 5. Selecting the Refinement is Optional 6. To compare data against data from another time period , select the time period from the comparison list 7. Select Calculations need to be displayed 8. To exclude certain data , Select Exclusion from the Exclusion list 9. Save
FILTER - OVERVIEW Creating Filters: Filter allow to set a range for the data that need to be displayed Types of Filter Attribute Filters Metric Filters Filterset:A Filterset is a collection of filters Grouping Multiple Filters Progressive Filtering :Allows to select values based on other filter
SELECT FILTER - STEPS 1. Click > Create Report > Select Time, Filters and Rankings>Filters The Filter tab Displays
SELECT FILTER - STEPS 2.  In the Attribute filter selection task area, Click select an attribute  to select an attribute for the filter  From the operator list , select an operator for the filter Select Values for the filter
SELECT FILTER - STEPS 5. To create a prompt for the attribute filter ,select prompt this filter before running  6. To display attributes values in a progressive manner , Enable Progressive filtering  7. To restrict user from removing filter , select restrict removal  8. To add another filter , repeat step 3 to 7 9. To view the SQL of the attribute filter ,click advanced 10. To change the Order of applying filter ,click the move arrows
SELECT FILTER - STEPS 12. To remove an attribute filter , Click the remove button 13. If more than one attribute filters need to be grouped ,Click switch to Advance group 14. Click Save
RANKING - OVERVIEW Setting Ranking Criteria: A ranked report displays data  in a specific order Types of Ranking Absolute (Similar to sorting) Percent (Based on percent values)
SELECT RANKING - STEPS 1. Click >Create Report > Select Time, Filters and Rankings>Ranking Rank Tab Displayed
SELECT RANKING - STEPS 2. In the Ranking task area, Click absolute ranking 3. From the ranking order list , Select a ranking order, Top/Bottom 4. Enter a numeric value for the number of ranked rows 5. From the attribute list ,Select an attribute for ranking 6. From the metric list, Select a metric for ranking 7. To create nested ranking , repeat step 3 to 6 8. Click Save
LAYOUT AND SETUP Set report table layout Set report table formats Add a chart to a report Creating an Analytical workflow
SET REPORT TABLE LAYOUT - STEPS Click Create Report > Layout and Setup > Table Layout : Table Layout Displays
SET REPORT TABLE LAYOUT 2. To create a cross tab report , from the row attribute area, drag an attribute to the column attribute area 3. To Create a report table with metric as rows, drag a metric to the row metric area 4.To Create a Sectional  report table, drag an attribute to the section 5.Click to Save
SET REPORT TABLE FORMATS - STEPS 1. Click Create reports > Layout and setup > Formatting Formatting Tab Displays
SET REPORT TABLE FORMATS - STEPS 2. Enter the Metric Information 3. Enter the calculation Information 4. Select date/Time Format for the date attributes in the report 5. Enter the display information 6. Enter the Fonts Information 7. Click Save
ADD A CHART TO A REPORT - STEPS 1.From the Layout and Setup page, Click Charting 2.Click Add Chart ( The Chart toolbar displays)
ADD A CHART TO A REPORT - STEPS 3. To display the chart based on row or column data, click Draw series  4. To hide the colored dots for highlighting in the chart, click Hide Metadata 5. To hide the report chart in the analyze tab, click Hide chart 6. Enter the Information on the displayed page 7. To add another chart click Add chart 8. To display the chart, click Display 9. Click Save
ANALYTICAL WORKFLOW - OVERVIEW An Analytical workflow is a list of reports linked together in a hierarchy The First/Primary Report can be on-demand report or cached report On the Analyze tab, the workflow tab displays the analytical wok flow associated with a report Figure Below  is a sample  workflow
CREATE AN ANALYTICAL WORKFLOW - STEPS 1. Click Create Report > Layout and setup > Workflows  Workflow Tab displays
CREATE AN ANALYTICAL WORKFLOW - STEPS 2. Click the Add workflow Node button 3.Create workflow by adding , inserting as needed
CREATE AN ANALYTICAL WORKFLOW - STEPS 4. For each report in the analytic workflow, click create report to create report 5. Click save
PUBLISH – STEPS TO DEFINE REPORT PROPERTIES 1 . Click Create report > Publish > Define Report Properties  The Properties tab appears 2. Enter the Information required in the page 3. Click Save
PUBLISH – STEPS TO SUBSCRIBE GROUPS& USER  1. Click Create Report > Publish> Subscribe Users Displays Subscribe tab 2. To select users, Click the user name and click Subscribe
PUBLISH – STEPS TO BROADCAST 1. On the create Report tab, Click Publish >Setup Broadcasting Displays the Broadcasting tab 2.Enter the name of the Broadcasting rule
PUBLISH – STEPS TO BROADCAST  3.Click the Recipients to select the recipients 4.Click Go  5.Click the user or group name to select ,and then click Add 6.Click Ok
Working with Report Data
WORKING WITH REPORT DATA Highlighting Metric Values Drilling into a Report Using Analytical workflow Displaying a Report Chart Exporting Report Data to Excel
HIGHLIGHTING METRIC VALUES - OVERVIEW Helps to Identify important data , trends and patterns at a glance Helpful in reports with multiple metrics or many rows Highlighting of Values in  a real-time ,on-demand , cached report is done by applying Highlighting rule To highlight a metric value, we can use colors, patterns, symbols It is also called as Exception Handling or Traffic Highlighting among Business User
HIGHLIGHTING METRIC VALUES - STEPS 1. Open the report to create a highlighting rule 2. Click the metric name to create the rule 3. Click Highlighting ( Highlight Tab Displays)
HIGHLIGHTING METRIC VALUES - STEPS 4.Enter the Required Information in the Displayed Tab 5.Click Ok
DRILLING INTO A REPORT - STEPS 1. Open the report to drill  The Report Displays on the Analyze Tab
DRILLING INTO A REPORT - STEPS 2. Select the attribute value for the drill 3. Click Drill ( Drill Path is Displayed on the Drill Tab)
DRILLING INTO A REPORT - STEPS 4. From the available drill paths, Select the attribute to be displayed 5. Click Drill 6. To Drill anywhere in the report ,from the Drill tab , click the Drill Anywhere button
USING WORKFLOW IN A REPORT - STEPS 1. Open the Report 2. Click the attribute value for the analysis filter 3. Click the workflows tab
USING WORKFLOW IN A REPORT - STEPS 4. To display detail , Click Detail view 5. Click the workflow report (analyzer displays the workflow report )
DISPLAY A REPORT CHART - STEPS 1.Open the report 2.Click Charts on the Analyze tab (Chart Tab Displays)
DISPLAY A REPORT CHART - STEPS 3. On the chart tab, Click the chart type
DISPLAY A REPORT CHART - STEPS 4. Click the show Chart toolbar button to show chart type 5. Click Go
EXPORT REPORT DATA TO EXCEL PIVOT TABLE Choose this option if further analysis on the report data is required   PowerAnalyzer uses a Macro to refresh the data
EXPORT REPORT DATA USING AN EXCEL TEMPLATE FILE PowerAnalyzer creates a new excel file based on the chosen template
RETAINING POWERANALYZER FORMATTING PowerAnalyzer Creates an excel file that contains the data in the format that is seen on the analyze tab

More Related Content

Viewers also liked (18)

PPTX
Applications
Edward Blurock
 
PDF
Relational algebra1
Tianlu Wang
 
PPTX
Triggers
work
 
PPT
Android tutorial (2)
Kumar
 
PPT
Dataware housing
work
 
DOCX
Cloud Computing
Abdul Aslam
 
PDF
Chain Reactions
Edward Blurock
 
PPTX
Android structure
Kumar
 
DOCX
Spm report
Abdul Aslam
 
PPTX
Leadership
Kumar
 
PPTX
Extracting data from xml
Kumar
 
PPT
Informatica PowerAnalyzer 4.0 3 of 3
ganblues
 
PPTX
Introduction to XML
Kumar
 
PDF
Mendelian Randomisation
James McMurray
 
PPT
Zackman frame work
ganblues
 
DOCX
Software Testing Tool Report
Abdul Aslam
 
PPT
Data Warehouse
ganblues
 
Applications
Edward Blurock
 
Relational algebra1
Tianlu Wang
 
Triggers
work
 
Android tutorial (2)
Kumar
 
Dataware housing
work
 
Cloud Computing
Abdul Aslam
 
Chain Reactions
Edward Blurock
 
Android structure
Kumar
 
Spm report
Abdul Aslam
 
Leadership
Kumar
 
Extracting data from xml
Kumar
 
Informatica PowerAnalyzer 4.0 3 of 3
ganblues
 
Introduction to XML
Kumar
 
Mendelian Randomisation
James McMurray
 
Zackman frame work
ganblues
 
Software Testing Tool Report
Abdul Aslam
 
Data Warehouse
ganblues
 

Similar to Informatica PowerAnalyzer 4.0 2 of 3 (20)

PPTX
MicroStrategy Basic Reporting.pptx
Vijay80411
 
PPTX
PPT: Introduction to Analytics Reporting
tonghard
 
PPTX
Custom Reporting Trainging with Bluforce
EPAY Systems
 
PPT
BI WEBI with HANA End User Material
Kishore Chaganti
 
PPT
Crystal tr///SAP Design Studio online training by design studio Export-24/7//...
venkat training
 
PPTX
Dynamics Day 2014: Microsoft Dynamics NAV - Business Insight (Reporting and A...
Intergen
 
PPTX
RentPath Reports presentation
Atlanta Salesforce Nonprofit User Group (ASNUG)
 
PPT
Netvu test slideshow
Ryan Deeds
 
PPTX
Showcase of Reports
Garth Wilson
 
PPTX
Watson Analytic
Shaily Dubey
 
DOC
Report exchange designer
Bhushan Rajgure
 
PPTX
A Business Intelligence requirement gathering checklist
Madhumita Mantri
 
PDF
Excel 2007 Advanced Report Development 1st Edition Timothy Zapawa
magujeschar
 
PDF
Business objects activities web intelligence
Dmitry Anoshin
 
PPT
SSRS 2008 R2
tomerl
 
PDF
Excel 2007 Advanced Report Development 1st Edition Timothy Zapawa
vzgfdfwm013
 
PDF
Seatug Presentation (Excel to Data Viz culture) Seattle Tableau User Group
Russell Spangler
 
PDF
Power BI Report.pdf
VishnuGone
 
PPTX
Elevate Your Reports Dashboards to New Heights
Adaptive Insights
 
PPT
It ready dw_day4_rev00
Siwawong Wuttipongprasert
 
MicroStrategy Basic Reporting.pptx
Vijay80411
 
PPT: Introduction to Analytics Reporting
tonghard
 
Custom Reporting Trainging with Bluforce
EPAY Systems
 
BI WEBI with HANA End User Material
Kishore Chaganti
 
Crystal tr///SAP Design Studio online training by design studio Export-24/7//...
venkat training
 
Dynamics Day 2014: Microsoft Dynamics NAV - Business Insight (Reporting and A...
Intergen
 
Netvu test slideshow
Ryan Deeds
 
Showcase of Reports
Garth Wilson
 
Watson Analytic
Shaily Dubey
 
Report exchange designer
Bhushan Rajgure
 
A Business Intelligence requirement gathering checklist
Madhumita Mantri
 
Excel 2007 Advanced Report Development 1st Edition Timothy Zapawa
magujeschar
 
Business objects activities web intelligence
Dmitry Anoshin
 
SSRS 2008 R2
tomerl
 
Excel 2007 Advanced Report Development 1st Edition Timothy Zapawa
vzgfdfwm013
 
Seatug Presentation (Excel to Data Viz culture) Seattle Tableau User Group
Russell Spangler
 
Power BI Report.pdf
VishnuGone
 
Elevate Your Reports Dashboards to New Heights
Adaptive Insights
 
It ready dw_day4_rev00
Siwawong Wuttipongprasert
 
Ad

More from ganblues (6)

PPT
Building the DW - ETL
ganblues
 
PPT
Warehouse components
ganblues
 
PPT
Informatica Server Manager
ganblues
 
PPT
Informatica Designer Module
ganblues
 
PPT
Informatica Power Center 7.1
ganblues
 
PPT
Informatica PowerAnalyzer 4.0 1 of 3
ganblues
 
Building the DW - ETL
ganblues
 
Warehouse components
ganblues
 
Informatica Server Manager
ganblues
 
Informatica Designer Module
ganblues
 
Informatica Power Center 7.1
ganblues
 
Informatica PowerAnalyzer 4.0 1 of 3
ganblues
 
Ad

Recently uploaded (20)

PDF
AI Unleashed - Shaping the Future -Starting Today - AIOUG Yatra 2025 - For Co...
Sandesh Rao
 
PPTX
OA presentation.pptx OA presentation.pptx
pateldhruv002338
 
PDF
Google I/O Extended 2025 Baku - all ppts
HusseinMalikMammadli
 
PDF
State-Dependent Conformal Perception Bounds for Neuro-Symbolic Verification
Ivan Ruchkin
 
PDF
How ETL Control Logic Keeps Your Pipelines Safe and Reliable.pdf
Stryv Solutions Pvt. Ltd.
 
PDF
A Strategic Analysis of the MVNO Wave in Emerging Markets.pdf
IPLOOK Networks
 
PDF
How Open Source Changed My Career by abdelrahman ismail
a0m0rajab1
 
PDF
Structs to JSON: How Go Powers REST APIs
Emily Achieng
 
PPTX
Agentic AI in Healthcare Driving the Next Wave of Digital Transformation
danielle hunter
 
PDF
The Future of Artificial Intelligence (AI)
Mukul
 
PDF
Generative AI vs Predictive AI-The Ultimate Comparison Guide
Lily Clark
 
PDF
Make GenAI investments go further with the Dell AI Factory
Principled Technologies
 
PPTX
Agile Chennai 18-19 July 2025 Ideathon | AI Powered Microfinance Literacy Gui...
AgileNetwork
 
PDF
Trying to figure out MCP by actually building an app from scratch with open s...
Julien SIMON
 
PPTX
Dev Dives: Automate, test, and deploy in one place—with Unified Developer Exp...
AndreeaTom
 
PPTX
Farrell_Programming Logic and Design slides_10e_ch02_PowerPoint.pptx
bashnahara11
 
PDF
Data_Analytics_vs_Data_Science_vs_BI_by_CA_Suvidha_Chaplot.pdf
CA Suvidha Chaplot
 
PDF
Per Axbom: The spectacular lies of maps
Nexer Digital
 
PPTX
IT Runs Better with ThousandEyes AI-driven Assurance
ThousandEyes
 
PDF
TrustArc Webinar - Navigating Data Privacy in LATAM: Laws, Trends, and Compli...
TrustArc
 
AI Unleashed - Shaping the Future -Starting Today - AIOUG Yatra 2025 - For Co...
Sandesh Rao
 
OA presentation.pptx OA presentation.pptx
pateldhruv002338
 
Google I/O Extended 2025 Baku - all ppts
HusseinMalikMammadli
 
State-Dependent Conformal Perception Bounds for Neuro-Symbolic Verification
Ivan Ruchkin
 
How ETL Control Logic Keeps Your Pipelines Safe and Reliable.pdf
Stryv Solutions Pvt. Ltd.
 
A Strategic Analysis of the MVNO Wave in Emerging Markets.pdf
IPLOOK Networks
 
How Open Source Changed My Career by abdelrahman ismail
a0m0rajab1
 
Structs to JSON: How Go Powers REST APIs
Emily Achieng
 
Agentic AI in Healthcare Driving the Next Wave of Digital Transformation
danielle hunter
 
The Future of Artificial Intelligence (AI)
Mukul
 
Generative AI vs Predictive AI-The Ultimate Comparison Guide
Lily Clark
 
Make GenAI investments go further with the Dell AI Factory
Principled Technologies
 
Agile Chennai 18-19 July 2025 Ideathon | AI Powered Microfinance Literacy Gui...
AgileNetwork
 
Trying to figure out MCP by actually building an app from scratch with open s...
Julien SIMON
 
Dev Dives: Automate, test, and deploy in one place—with Unified Developer Exp...
AndreeaTom
 
Farrell_Programming Logic and Design slides_10e_ch02_PowerPoint.pptx
bashnahara11
 
Data_Analytics_vs_Data_Science_vs_BI_by_CA_Suvidha_Chaplot.pdf
CA Suvidha Chaplot
 
Per Axbom: The spectacular lies of maps
Nexer Digital
 
IT Runs Better with ThousandEyes AI-driven Assurance
ThousandEyes
 
TrustArc Webinar - Navigating Data Privacy in LATAM: Laws, Trends, and Compli...
TrustArc
 

Informatica PowerAnalyzer 4.0 2 of 3

  • 2. CREATION OF REPORT Select Metrics Select Attributes Select Time, Filter, Ranking Layout and Setup Analytical Workflow Publish
  • 3. METRIC - OVERVIEW Metric are the measure used to evaluate the business process Metric folder contains the metric and it resides in the schema directory For example sales, cost , Revenue are the metrics that talk about your business A calculated metric contains mathematical expression based on a metric from one or more fact tables
  • 4. SELECT METRICS - STEPS 1. Click Create Report >>Select Metrics : A list of metric folder displays in the metric folder task area
  • 5. SELECT METRICS - STEPS 4. Click the metric folder from where metric to be added 5. Click the metric to be added in the report , Selected metric appears in the box Select metrics In the detail task area, from the analyze time series by list, select the time key for the metric To change the Order of the metric ,click move button up and down To create Prompt for a Metric , select prompt values Click Save
  • 6. ATTRIBUTES - OVERVIEW Attributes are the factors that determines the value of a metric Attribute Folder contains attributes. The attribute folder resides in the schema directory For example Product, Region, Time are attributes Following task can be performed on the attributes Create a prompts for a attribute Setting up a time attribute Creating a query to search for an attribute
  • 7. SELECT ATTRIBUTE - STEPS Click Create Report >Select Attributes A list of attributes folder displays in the attribute folder task area
  • 8. SELECT ATTRIBUTES - STEPS 2. Click the attribute folder from where attributes to be added 3. Select the attribute to be added in the report 4. Click Add , Selected attributes appear in the box under select attributes 5. To change the Order of the metric ,click move button up and down 6. To create Prompt for a Metric , select prompt values 7. Click Save
  • 9. TIME - OVERVIEW Setting the Time: Setting the time for a report helps to compare metrics across time periods. Time settings is done by selecting values for these options Calendar (Common, Fiscal , Custom) Time Period (Relative , Absolute) Granularity for the Time Period Refinements for the time period and granularity (Comparison, Calculation, Exclusion)
  • 10. SELECT TIME - STEPS 1. Click >Create Report > Select Time, Filters and Rankings>Time The Time Tab Displays
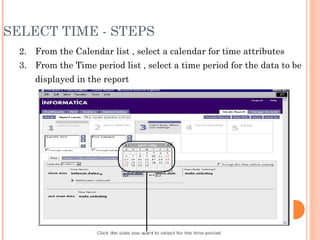
  • 11. SELECT TIME - STEPS 2. From the Calendar list , select a calendar for time attributes 3. From the Time period list , select a time period for the data to be displayed in the report
  • 12. SELECT TIME - STEPS 4. Selecting the granularity of the time period is optional 5. Selecting the Refinement is Optional 6. To compare data against data from another time period , select the time period from the comparison list 7. Select Calculations need to be displayed 8. To exclude certain data , Select Exclusion from the Exclusion list 9. Save
  • 13. FILTER - OVERVIEW Creating Filters: Filter allow to set a range for the data that need to be displayed Types of Filter Attribute Filters Metric Filters Filterset:A Filterset is a collection of filters Grouping Multiple Filters Progressive Filtering :Allows to select values based on other filter
  • 14. SELECT FILTER - STEPS 1. Click > Create Report > Select Time, Filters and Rankings>Filters The Filter tab Displays
  • 15. SELECT FILTER - STEPS 2. In the Attribute filter selection task area, Click select an attribute to select an attribute for the filter From the operator list , select an operator for the filter Select Values for the filter
  • 16. SELECT FILTER - STEPS 5. To create a prompt for the attribute filter ,select prompt this filter before running 6. To display attributes values in a progressive manner , Enable Progressive filtering 7. To restrict user from removing filter , select restrict removal 8. To add another filter , repeat step 3 to 7 9. To view the SQL of the attribute filter ,click advanced 10. To change the Order of applying filter ,click the move arrows
  • 17. SELECT FILTER - STEPS 12. To remove an attribute filter , Click the remove button 13. If more than one attribute filters need to be grouped ,Click switch to Advance group 14. Click Save
  • 18. RANKING - OVERVIEW Setting Ranking Criteria: A ranked report displays data in a specific order Types of Ranking Absolute (Similar to sorting) Percent (Based on percent values)
  • 19. SELECT RANKING - STEPS 1. Click >Create Report > Select Time, Filters and Rankings>Ranking Rank Tab Displayed
  • 20. SELECT RANKING - STEPS 2. In the Ranking task area, Click absolute ranking 3. From the ranking order list , Select a ranking order, Top/Bottom 4. Enter a numeric value for the number of ranked rows 5. From the attribute list ,Select an attribute for ranking 6. From the metric list, Select a metric for ranking 7. To create nested ranking , repeat step 3 to 6 8. Click Save
  • 21. LAYOUT AND SETUP Set report table layout Set report table formats Add a chart to a report Creating an Analytical workflow
  • 22. SET REPORT TABLE LAYOUT - STEPS Click Create Report > Layout and Setup > Table Layout : Table Layout Displays
  • 23. SET REPORT TABLE LAYOUT 2. To create a cross tab report , from the row attribute area, drag an attribute to the column attribute area 3. To Create a report table with metric as rows, drag a metric to the row metric area 4.To Create a Sectional report table, drag an attribute to the section 5.Click to Save
  • 24. SET REPORT TABLE FORMATS - STEPS 1. Click Create reports > Layout and setup > Formatting Formatting Tab Displays
  • 25. SET REPORT TABLE FORMATS - STEPS 2. Enter the Metric Information 3. Enter the calculation Information 4. Select date/Time Format for the date attributes in the report 5. Enter the display information 6. Enter the Fonts Information 7. Click Save
  • 26. ADD A CHART TO A REPORT - STEPS 1.From the Layout and Setup page, Click Charting 2.Click Add Chart ( The Chart toolbar displays)
  • 27. ADD A CHART TO A REPORT - STEPS 3. To display the chart based on row or column data, click Draw series 4. To hide the colored dots for highlighting in the chart, click Hide Metadata 5. To hide the report chart in the analyze tab, click Hide chart 6. Enter the Information on the displayed page 7. To add another chart click Add chart 8. To display the chart, click Display 9. Click Save
  • 28. ANALYTICAL WORKFLOW - OVERVIEW An Analytical workflow is a list of reports linked together in a hierarchy The First/Primary Report can be on-demand report or cached report On the Analyze tab, the workflow tab displays the analytical wok flow associated with a report Figure Below is a sample workflow
  • 29. CREATE AN ANALYTICAL WORKFLOW - STEPS 1. Click Create Report > Layout and setup > Workflows Workflow Tab displays
  • 30. CREATE AN ANALYTICAL WORKFLOW - STEPS 2. Click the Add workflow Node button 3.Create workflow by adding , inserting as needed
  • 31. CREATE AN ANALYTICAL WORKFLOW - STEPS 4. For each report in the analytic workflow, click create report to create report 5. Click save
  • 32. PUBLISH – STEPS TO DEFINE REPORT PROPERTIES 1 . Click Create report > Publish > Define Report Properties The Properties tab appears 2. Enter the Information required in the page 3. Click Save
  • 33. PUBLISH – STEPS TO SUBSCRIBE GROUPS& USER 1. Click Create Report > Publish> Subscribe Users Displays Subscribe tab 2. To select users, Click the user name and click Subscribe
  • 34. PUBLISH – STEPS TO BROADCAST 1. On the create Report tab, Click Publish >Setup Broadcasting Displays the Broadcasting tab 2.Enter the name of the Broadcasting rule
  • 35. PUBLISH – STEPS TO BROADCAST 3.Click the Recipients to select the recipients 4.Click Go 5.Click the user or group name to select ,and then click Add 6.Click Ok
  • 37. WORKING WITH REPORT DATA Highlighting Metric Values Drilling into a Report Using Analytical workflow Displaying a Report Chart Exporting Report Data to Excel
  • 38. HIGHLIGHTING METRIC VALUES - OVERVIEW Helps to Identify important data , trends and patterns at a glance Helpful in reports with multiple metrics or many rows Highlighting of Values in a real-time ,on-demand , cached report is done by applying Highlighting rule To highlight a metric value, we can use colors, patterns, symbols It is also called as Exception Handling or Traffic Highlighting among Business User
  • 39. HIGHLIGHTING METRIC VALUES - STEPS 1. Open the report to create a highlighting rule 2. Click the metric name to create the rule 3. Click Highlighting ( Highlight Tab Displays)
  • 40. HIGHLIGHTING METRIC VALUES - STEPS 4.Enter the Required Information in the Displayed Tab 5.Click Ok
  • 41. DRILLING INTO A REPORT - STEPS 1. Open the report to drill The Report Displays on the Analyze Tab
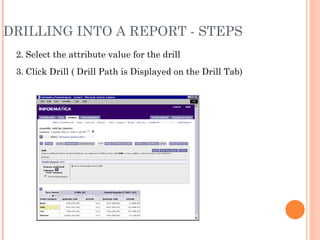
  • 42. DRILLING INTO A REPORT - STEPS 2. Select the attribute value for the drill 3. Click Drill ( Drill Path is Displayed on the Drill Tab)
  • 43. DRILLING INTO A REPORT - STEPS 4. From the available drill paths, Select the attribute to be displayed 5. Click Drill 6. To Drill anywhere in the report ,from the Drill tab , click the Drill Anywhere button
  • 44. USING WORKFLOW IN A REPORT - STEPS 1. Open the Report 2. Click the attribute value for the analysis filter 3. Click the workflows tab
  • 45. USING WORKFLOW IN A REPORT - STEPS 4. To display detail , Click Detail view 5. Click the workflow report (analyzer displays the workflow report )
  • 46. DISPLAY A REPORT CHART - STEPS 1.Open the report 2.Click Charts on the Analyze tab (Chart Tab Displays)
  • 47. DISPLAY A REPORT CHART - STEPS 3. On the chart tab, Click the chart type
  • 48. DISPLAY A REPORT CHART - STEPS 4. Click the show Chart toolbar button to show chart type 5. Click Go
  • 49. EXPORT REPORT DATA TO EXCEL PIVOT TABLE Choose this option if further analysis on the report data is required PowerAnalyzer uses a Macro to refresh the data
  • 50. EXPORT REPORT DATA USING AN EXCEL TEMPLATE FILE PowerAnalyzer creates a new excel file based on the chosen template
  • 51. RETAINING POWERANALYZER FORMATTING PowerAnalyzer Creates an excel file that contains the data in the format that is seen on the analyze tab

Editor's Notes

  • #25: Setting the report table formats , Modify the look and feel of the report