Intelligently Automating Machine Learning, Artificial Intelligence, and Data Science Processes
3 likes1,624 views

Seminar: "Intelligently Automating Machine Learning, Artificial Intelligence, and Data Science Processes" Ali Alkan | Kadir Has Univ. | 07 Dec. 2018


Ad
More Related Content
What's hot (20)
Similar to Intelligently Automating Machine Learning, Artificial Intelligence, and Data Science Processes (20)


Ad
Recently uploaded (20)


Ad
Intelligently Automating Machine Learning, Artificial Intelligence, and Data Science Processes
- 1. Intelligently Automating Machine Learning, Artificial Intelligence, and Data Science Processes Ali ALKAN Co-Founder & Principal Data Scientist ADVANCETICS B.V. [email protected] Twitter / Ali_Alkan 7 December 2018
- 2. Agenda Machine Learning, Artificial Intelligence, and Data Science Phases of Data Science Projects and CRISP-DM Guided Analytics Approach for Data Science Processes A Guided Analytics Application with KNIME Analytics Platform Q&A Session
- 3. ML vs. AI vs. DS? Data Science produces insights Machine Learning produces predictions
- 4. ML vs. AI vs. DS? Data Science produces insights Machine Learning produces predictions Artificial Intelligence produces actions
- 5. What is Artificial Intelligence? • Artificial Narrow Intelligence (ANI): Machine intelligence that equals or exceeds human intelligence or efficiency at a specific task. • Artificial General Intelligence (AGI): A machine with the ability to apply intelligence to any problem, rather than just one specific problem (human-level intelligence). • Artificial Superintelligence (ASI): An intellect that is much smarter than the best human brains in practically every field, including scientific creativity, general wisdom and social skills.
- 6. Machine Learning | Introduction • Machine Learning is a type of Artificial Intelligence that provides computers with the ability to learn without being explicitly programmed. • Provides various techniques that can learn from and make predictions on data.
- 7. Machine Learning | Learning Approaches Supervised Learning: Learning with a labeled training set • Example: email spam detector with training set of already labeled emails Unsupervised Learning: Discovering patterns in unlabeled data • Example: cluster similar documents based on the text content Reinforcement Learning: learning based on feedback or reward • Example: learn to play chess by winning or losing
- 8. Outlook | Traditional Programming
- 9. Outlook | Machine Learning
- 10. Outlook | Goal-based AI
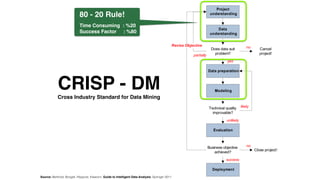
- 11. CRISP - DMCross Industry Standard for Data Mining
- 12. The CRISP-DM methodology provides a structured approach to planning a data mining project. It is a robust and well-proven methodology. It is powerful practical, flexible and useful when using analytics to solve business issues. This model is an idealised sequence of events. In practice many of the tasks can be performed in a different order and it will often be necessary to backtrack to previous tasks and repeat certain actions. CRISP-DM | Definition
- 13. CRISP-DM | Business Understanding The first stage of the CRISP-DM process is to understand what you want to accomplish from a business perspective. The goal of this stage of the process is to uncover important factors that could influence the outcome of the project. Neglecting this step can mean that a great deal of effort is put into producing the right answers to the wrong questions.
- 14. CRISP-DM | Data Understanding The second stage of the CRISP-DM process requires you to acquire the data listed in the project resources. This initial collection includes data loading, if this is necessary for data understanding. • For example, if you use a specific tool for data understanding, it makes perfect sense to load your data into this tool. • If you acquire multiple data sources then you need to consider how and when you're going to integrate these.
- 15. All steps from the raw data to the final dataset Final dataset: used for statistical modeling sometimes called ADS (analytical dataset) Includes or can include: • data source selection and loading • table selection and loading • joining data sources • data cleaning (missing values, outliers, ...) • feature generation and data transformation • taking samples of data • … CRISP-DM | Data Preparation
- 19. CRISP - DM Cross Industry Standard for Data Mining 80 - 20 Rule! Time Consuming : %20 Success Factor : %80 Source: Berthold, Borgelt, Höppner, Klawonn: Guide to Intelligent Data Analysis, Springer 2011
- 20. Sharing Tools Sharing Skills Sharing Responsibility A new generation of tools They can build their own reports A recipe for disaster Data is viral - everybody wants it Start small and just do it
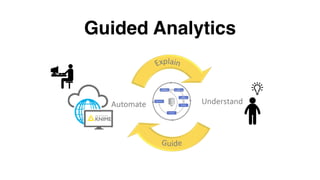
- 22. Guided Analytics
- 23. Guided Analytics | Introduction • Systems that automate the data science cycle have been gaining a lot of attention recently. • Those tools often automate only a few phases of the cycle, have a tendency to consider just a small subset of available models, and are limited to relatively straightforward, simple data formats. • Automation should not result in black boxes, hiding the interesting pieces from everyone; the modern data science environment should allow automation and interaction to be combined flexibly.
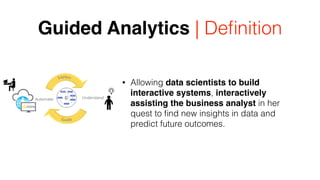
- 24. Guided Analytics | Definition • Allowing data scientists to build interactive systems, interactively assisting the business analyst in her quest to find new insights in data and predict future outcomes.
- 25. Guided Analytics | Definition • We explicitly do not aim to replace the driver (or totally automate the process) but instead offer assistance and carefully gather feedback whenever needed throughout the analysis process. • To make this successful, the data scientist needs to be able to easily create powerful analytical applications that allow interaction with the business user whenever their expertise and feedback is needed.
- 26. Guided Analytics | Environments Openness Uniformity Flexibility Agility
- 27. Guided Analytics | Environments Openness: • The environment does not post restrictions in terms of tools used – this also simplifies collaboration between scripting gurus (such as R or Python) and others who just want to reuse their expertise without diving into their code. • Obviously being able to reach out to other tools for specific data types (text, images, …) or specialized high performance or big data algorithms (such as H2O or Spark) from within the same environment would be a plus; Uniformity Flexibility Agility
- 28. Guided Analytics | Environments Openness Uniformity: The experts creating data science can do it all in the same environment: • blend data, • run the analysis, • mix & match tools, • build the infrastructure to deploy this as analytical application; Flexibility Agility
- 29. Guided Analytics | Environments Openness Uniformity Flexibility: • Underneath the analytical application, we can run simple regression models or orchestrate complex parameter optimization and ensemble models – ranging from one to thousands of models. Agility
- 30. Guided Analytics | Environments Openness Uniformity Flexibility Agility: • Once the application is used in the wild, new demands will arise quickly: more automation here, more consumer feedback there. • The environment that is used to build these analytical applications needs to make it intuitive for other members of the data science team to quickly adapt the existing analytical applications to new and changing requirements.
- 31. Guided Analytics | Auto-what? • So how do all of those driverless, automatic, automated AI or machine learning systems fit into this picture? • Their goal is either to encapsulate (and hide!) existing expert data scientists’ expertise or apply more or less sophisticated optimization schemes to the fine-tuning of the data science tasks.
- 32. Guided Analytics | Auto-what? • Obviously, this can be useful if no in-house data science expertise is available but in the end, the business analyst is locked into the pre-packaged expertise and the limited set of hard coded scenarios. • Both, data scientist expertise and parameter optimization can easily be part of a Guided Analytics workflow as well. • And since automation of whatever kind tends to always miss the important and interesting piece, adding a Guided Analytics component to this makes it even more powerful: we can guide the optimization scheme and we can adjust the pre-coded expert knowledge to the new task at hand.
- 33. Data Sciense Project | Roles www.sistek.com.tr • Data scientists – Workflow development – Data Analysis – Model Development • Business analysts – WebPortal – Data Analysis • IT administrators – Enterprise Architecture Mngmt – Cloud solution provider 5.Data Science Project –Roles
- 34. Data Science Project | Data Scientist www.sistek.com.tr Responsible for: • Creating, updating workflows • Creating, maintaining metanode templates • Building, evaluating, monitoring data and using ad hoc developed workflows • Development of WebPortal applications 5.Data Science Project – Data Scientists
- 35. Demo
- 36. About KNIME KNIME is a software for fast, easy and intuitive access to advanced data science, helping organizations drive innovation. KNIME Analytics Platform is the leading open solution for data- driven innovation, designed for discovering the potential hidden in data, mining for fresh insights, or predicting new futures. Organizations can take their collaboration, productivity and performance to the next level with a robust range of commercial extensions to Knime open source platform. For over a decade, a thriving community of data scientists in over 60 countries has been working with Knime platform on every kind of data: from numbers to images, molecules to humans, signals to complex networks, and simple statistics to big data analytics. KNIME’s headquarters are based in Zurich, with additional offices in Konstanz, Berlin, and Austin.
- 38. Chicago O'Hare International Airport (ORD)
- 39. Guided Analytics | Design The workflow defines a fully automated web based application to select, train, test, and optimize a number of machine learning models. The workflow is designed for business analysts to easily create predictive analytics solutions by applying their domain knowledge. Each of the wrapped metanodes outputs a web page with which the business analyst can interact.
- 40. Guided Analytics | Application
- 41. Sources ๏ Christian Dietz, Paolo Tamagnini, Simon Schmid, Michael Berthold: Intelligently Automating Machine Learning, Artificial Intelligence, and Data Science, https://www.knime.com/blog ๏ Berthold, Borgelt, Höppner, Klawonn: Guide to Intelligent Data Analysis, Springer 2011 ๏ Michael Berthold: Principles of Guided Analytics, https://www.knime.com/blog ๏ Ali Alkan: Veri Madenciliği Teknikleri, Eğitim Notları 2017 ๏ Ali Alkan: İleri Analitik Teknikler Seminerleri 1-2-3-5-6-7, Seminer Notları 2016-17