Intro for Power BI
Download as PPTX, PDF4 likes4,974 views

A simplified version of my presentation: - PowerBI solution architecture - Key steps to visualize data in PowerBI - PowerBI Demo - R in PowerBI - Custom Visuals - PowerBI Report Server - Azure services and Power BI


Ad
More Related Content
What's hot (20)
Similar to Intro for Power BI (20)


Ad
Recently uploaded (20)


Ad
Intro for Power BI
- 1. Intro for PowerBI 16th July 2017 by Martin X 马丁叔叔 https://www.linkedin.com/in/martin-x-523aa722/
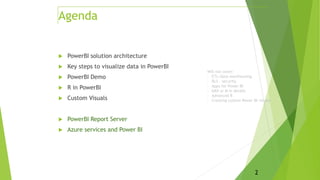
- 2. PowerBI solution architecture Key steps to visualize data in PowerBI PowerBI Demo R in PowerBI Custom Visuals PowerBI Report Server Azure services and Power BI 2 Agenda Will not cover: - ETL/data warehousing - RLS – security - Apps for Power BI - DAX or M in details - Advanced R - Creating custom Power BI visuals
- 3. PowerBI solution architecture Key steps to visualize data in PowerBI PowerBI Demo R in PowerBI Custom Visuals PowerBI Report Server Azure services and Power BI 3 Agenda
- 5. PowerBI solution architecture Key steps to visualize data in PowerBI PowerBI Demo R in PowerBI Custom Visuals PowerBI Report Server Azure services and Power BI 5 Agenda
- 6. Import data Key steps to visualize data in PowerBI
- 7. Define relationship Key steps to visualize data in PowerBI
- 8. Define calculated column Key steps to visualize data in PowerBI
- 9. Define calculated measure Key steps to visualize data in PowerBI
- 10. Define sorting Key steps to visualize data in PowerBI
- 11. Define hierarchy Key steps to visualize data in PowerBI
- 12. Choose visual and fields Key steps to visualize data in PowerBI
- 13. PowerBI solution architecture Key steps to visualize data in PowerBI PowerBI Demo R in PowerBI Custom Visuals PowerBI Report Server Azure services and Power BI 13 Agenda
- 14. PowerBI Demo
- 15. Demo
- 16. 16 Dashboard online(powerbi.com) Publish and access report online: https://app.powerbi.com/groups/13c79dd6-b776-438f-8af2- 7928cd5e68f4/dashboards/90dd4efe-1b53-497c-824f-a514f83fdb32
- 17. PowerBI solution architecture Key steps to visualize data in PowerBI PowerBI Demo R in PowerBI Custom Visuals SQL Server Reporting Services PowerBI Report Server Azure services and Power BI 17 Agenda
- 18. R within PowerBI
- 19. R within PowerBI Why PowerBI with R? - Interactive with other visuals - Security - Performance - Cost vs Shinny
- 21. Tools
- 22. PowerBI solution architecture Key steps to visual data in PowerBI PowerBI Demo R in PowerBI Custom Visuals SQL Server Reporting Services PowerBI Report Server Azure services and Power BI 22 Agenda
- 23. 23/07/201723 PowerBI Report Server – demo https://blogs.msdn.microsoft.com/sqlrsteamblog/2017/05/03/introducing-power-
- 24. Azure services and Power BI https://powerbi.microsoft.com/en-us/documentation/powerbi-azure-and- power-bi/
- 25. Q & A
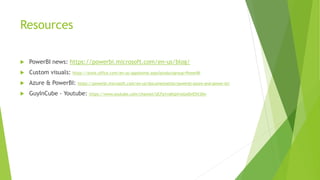
- 26. Resources PowerBI news: https://powerbi.microsoft.com/en-us/blog/ Custom visuals: https://store.office.com/en-us/appshome.aspx?productgroup=PowerBI Azure & PowerBI: https://powerbi.microsoft.com/en-us/documentation/powerbi-azure-and-power-bi/ GuyInCube - Youtube: https://www.youtube.com/channel/UCFp1vaKzpfvoGai0vE5VJ0w
Editor's Notes
- #4: Will not cover: ETL/data warehousing RLS – security Apps for Power BI DAX or M in details Advanced R Creating custom Power BI visuals
- #14: Will not cover: RLS – security Apps for Power BI DAX or M in details Advanced R Creating custom Power BI visuals
- #15: (Browser w/ Full-screen mode) Dashboard: https://app.powerbi.com/groups/13c79dd6-b776-438f-8af2-7928cd5e68f4/dashboards/90dd4efe-1b53-497c-824f-a514f83fdb32
- #16: Steps to import data, define relationship, visualize data, publish, share,..
- #19: note1: Custom R code(ggplot, dplyr…) vs Third party R visual + interact with other visuals
- #20: note1: Custom R code(ggplot, dplyr…) vs Third party R visual + interact with other visuals
- #23: Will not cover: RLS – security Apps for Power BI DAX or M in details Advanced R Creating custom Power BI visuals
- #24: Power BI Report Server is an on-premises server that enables Power BI Pro users to publish Power BI reports and distribute them broadly across the enterprise, without requiring report consumers to be licensed individually per user.
- #25: Keywords: real-time analysis, IOT, Machine Learning, etc An overview to use Azure Services/PowerBI to turn your data processing efforts into analytics and reports that provide real-time insights into your business.