A talk I gave at the MMDS workshop June 2014 on the Myria system as well as some of Seung-Hee Bae's work on scalable graph clustering.
https://mmds-data.org/
Talk given at Los Alamos National Labs in Fall 2015.
As research becomes more data-intensive and platforms become more heterogeneous, we need to shift focus from performance to productivity.
This document provides an overview of a data science course. It discusses topics like big data, data science components, use cases, Hadoop, R, and machine learning. The course objectives are to understand big data challenges, implement big data solutions, learn about data science components and prospects, analyze use cases using R and Hadoop, and understand machine learning concepts. The document outlines the topics that will be covered each day of the course including big data scenarios, introduction to data science, types of data scientists, and more.
Introduction to data science intro,ch(1,2,3)heba_ahmad
Data science is an emerging area concerned with collecting, preparing, analyzing, visualizing, managing, and preserving large collections of information. It involves data architecture, acquisition, analysis, archiving, and working with data architects, acquisition tools, analysis and visualization techniques, metadata, and ensuring quality and ethical use of data. R is an open source program for data manipulation, calculation, graphical display, and storage that is extensible and teaches skills applicable to other programs, though it is command line oriented and not always good at feedback.
From the webinar presentation "Data Science: Not Just for Big Data", hosted by Kalido and presented by:
David Smith, Data Scientist at Revolution Analytics, and
Gregory Piatetsky, Editor, KDnuggets
These are the slides for David Smith's portion of the presentation.
Watch the full webinar at:
http://www.kalido.com/data-science.htm
In this presentation, Wes Eldridge will provide a general overview on data science. The talk will cover a variety of topics, Wes will start with the dirty history of the field which will help add context. After learning about the history of data and data science Wes will discuss the common roles a data scientist holds in business and organizations. Next, he will talk about how to use data in your organization and products. Finally, he'll cover some tools to help you get started in data science. After the presentation, Wes will stick around for Q/A and data discussion.
An invited talk in the Big Data session of the Industrial Research Institute meeting in Seattle Washington.
Some notes on how to train data science talent and exploit the fact that the membrane between academia and industry has become more permeable.
A presentation delivered by Mohammed Barakat on the 2nd Jordanian Continuous Improvement Open Day in Amman. The presentation is about Data Science and was delivered on 3rd October 2015.
This document provides an overview of data science including what is big data and data science, applications of data science, and system infrastructure. It then discusses recommendation systems in more detail, describing them as systems that predict user preferences for items. A case study on recommendation systems follows, outlining collaborative filtering and content-based recommendation algorithms, and diving deeper into collaborative filtering approaches of user-based and item-based filtering. Challenges with collaborative filtering are also noted.
The document describes a 10 module data science course covering topics such as introduction to data science, machine learning techniques using R, Hadoop architecture, and Mahout algorithms. The course includes live online classes, recorded lectures, quizzes, projects, and a certificate. Each module covers specific data science topics and techniques. The document provides details on the course content, objectives, and topics covered in module 1 which includes an introduction to data science, its components, use cases, and how to integrate R and Hadoop. Examples of data science applications in various domains like healthcare, retail, and social media are also presented.
Data science remains a high-touch activity, especially in life, physical, and social sciences. Data management and manipulation tasks consume too much bandwidth: Specialized tools and technologies are difficult to use together, issues of scale persist despite the Cambrian explosion of big data systems, and public data sources (including the scientific literature itself) suffer curation and quality problems.
Together, these problems motivate a research agenda around “human-data interaction:” understanding and optimizing how people use and share quantitative information.
I’ll describe some of our ongoing work in this area at the University of Washington eScience Institute.
In the context of the Myria project, we're building a big data "polystore" system that can hide the idiosyncrasies of specialized systems behind a common interface without sacrificing performance. In scientific data curation, we are automatically correcting metadata errors in public data repositories with cooperative machine learning approaches. In the Viziometrics project, we are mining patterns of visual information in the scientific literature using machine vision, machine learning, and graph analytics. In the VizDeck and Voyager projects, we are developing automatic visualization recommendation techniques. In graph analytics, we are working on parallelizing best-of-breed graph clustering algorithms to handle multi-billion-edge graphs.
The common thread in these projects is the goal of democratizing data science techniques, especially in the sciences.
What is Big Data? What is Data Science? What are the benefits? How will they evolve in my organisation?
Built around the premise that the investment in big data is far less than the cost of not having it, this presentation made at a tech media industry event, this presentation will unveil and explore the nuances of Big Data and Data Science and their synergy forming Big Data Science. It highlights the benefits of investing in it and defines a path to their evolution within most organisations.
This document discusses the rise of big data and data science. It notes that while data volumes are growing exponentially, data alone is just an asset - it is data scientists that create value by building data products that provide insights. The document outlines the data science workflow and highlights both the tools used and challenges faced by data scientists in extracting value from big data.
This document provides an overview of getting started with data science using Python. It discusses what data science is, why it is in high demand, and the typical skills and backgrounds of data scientists. It then covers popular Python libraries for data science like NumPy, Pandas, Scikit-Learn, TensorFlow, and Keras. Common data science steps are outlined including data gathering, preparation, exploration, model building, validation, and deployment. Example applications and case studies are discussed along with resources for learning including podcasts, websites, communities, books, and TV shows.
Big Data [sorry] & Data Science: What Does a Data Scientist Do?Data Science London
What 'kind of things' does a data scientist do? What are the foundations and principles of data science? What is a Data Product? What does the data science process looks like? Learning from data: Data Modeling or Algorithmic Modeling? - talk by Carlos Somohano @ds_ldn at The Cloud and Big Data: HDInsight on Azure London 25/01/13
Presentation at Data ScienceTech Institute campuses, Paris and Nice, May 2016 , including Intro, Data Science History and Terms; 10 Real-World Data Science Lessons; Data Science Now: Polls & Trends; Data Science Roles; Data Science Job Trends; and Data Science Future
This document discusses democratizing data science in the cloud. It describes how cloud data management involves sharing resources like infrastructure, schema, data, and queries between tenants. This sharing enables new query-as-a-service systems that can provide smart cross-tenant services by learning from metadata, queries, and data across all users. Examples of possible services discussed include automated data curation, query recommendation, data discovery, and semi-automatic data integration. The document also describes some cloud data systems developed at the University of Washington like SQLShare and Myria that aim to realize this vision.
Urban data science activities at the University of Washington, presented at the Urban@UW kickoff event.
http://urban.uw.edu/
Data Science Introduction - Data Science: What Art Thou?Gregg Barrett
The document provides an overview of data science, defining it as utilizing tools for modeling and understanding complex datasets. It discusses building an understanding of data science and outlines several key aspects, including having "purple people" who blend business and technical skills, addressing both structured and unstructured data through approaches like data lakes and UIMA, and ensuring proper data strategies, engineering capabilities, and technical understanding. It also covers collaborating with universities and startups, as well as emphasizing model validation and mapping modeling back to business value.
This document provides an overview of data science including:
- Definitions of data science and the motivations for its increasing importance due to factors like big data, cloud computing, and the internet of things.
- The key skills required of data scientists and an overview of the data science process.
- Descriptions of different types of databases like relational, NoSQL, and data warehouses versus data lakes.
- An introduction to machine learning, data mining, and data visualization.
- Details on courses for learning data science.
Data Science in 2016: Moving up by Paco Nathan at Big Data Spain 2015Big Data Spain
This document discusses trends in data science in 2016, including how data science is moving into new use cases such as medicine, politics, government, and neuroscience. It also covers trends in hardware, generalized libraries, leveraging workflows, and frameworks that could enable a big leap ahead. The document discusses learning trends like MOOCs, inverted classrooms, collaborative learning, and how O'Reilly Media is embracing Jupyter notebooks. It also covers measuring distance between learners and subject communities, and the importance of both people and automation working together.
A look back at how the practice of data science has evolved over the years, modern trends, and where it might be headed in the future. Starting from before anyone had the title "data scientist" on their resume, to the dawn of the cloud and big data, and the new tools and companies trying to push the state of the art forward. Finally, some wild speculation on where data science might be headed.
Presentation given to Seattle Data Science Meetup on Friday July 24th 2015.
Keynote - An overview on Big Data & Data Science - Dr Gregory Piatetsky-ShapiroData ScienceTech Institute
Data Science Tech Institute - Big Data and Data Science Conference around Dr Gregory Piatetsky-Shapiro.
Keynote - An overview on Big Data & Data Science Dr Gregory Piatetsky-Shapiro - KDnuggets.com Founder & Editor.
Paris May 23rd & Nice May 26th 2016 @ Data ScienceTech Institute (https://www.datasciencetech.institute/)
This document provides an introduction to data science and analytics. It discusses why data science jobs are in high demand, what skills are needed for these roles, and common types of analytics including descriptive, predictive, and prescriptive. It also covers topics like machine learning, big data, structured vs unstructured data, and examples of companies that utilize data and analytics like Amazon and Facebook. The document is intended to explain key concepts in data science and why attending a talk on this topic would be beneficial.
Introduction to various data science. From the very beginning of data science idea, to latest designs, changing trends, technologies what make then to the application that are already in real world use as we of now.
In this talk, we introduce the Data Scientist role , differentiate investigative and operational analytics, and demonstrate a complete Data Science process using Python ecosystem tools, like IPython Notebook, Pandas, Matplotlib, NumPy, SciPy and Scikit-learn. We also touch the usage of Python in Big Data context, using Hadoop and Spark.
Bill Howe discussed emerging topics in responsible data science for the next decade. He described how the field will focus more on what should be done with data rather than just what can be done. Specifically, he talked about incorporating societal constraints like fairness, transparency and ethics into algorithmic decision making. He provided examples of unfair outcomes from existing algorithms and discussed approaches to measure and achieve fairness. Finally, he discussed the need for reproducibility in science and potential techniques for more automatic scientific claim checking and deep data curation.
Ordinary people included anyone who is not a Geek like myself. This book is written for ordinary people. That includes manager, marketers, technical writers, couch potatoes and so on.
Data Science and Analytics for Ordinary People is a collection of blogs I have written on LinkedIn over the past year. As I continue to perform big data analytics, I continue to discover, not only my weaknesses in communicating the information, but new insights into using the information obtained from analytics and communicating it. These are the kinds of things I blog about and are contained herein.
Two hour lecture I gave at the Jyväskylä Summer School. The purpose of the talk is to give a quick non-technical overview of concepts and methodologies in data science. Topics include a wide overview of both pattern mining and machine learning.
See also Part 2 of the lecture: Industrial Data Science. You can find it in my profile (click the face)
This document provides an overview of the key concepts in data science including statistics, machine learning, data mining, and data analysis tools. It also discusses classification, regression, clustering, and data reduction techniques. Additionally, it defines what a data scientist is and how they work with data to understand patterns, ask questions, and solve problems as part of a team. The document demonstrates some examples of admissions data and analyses simpson's paradox to illustrate data science concepts.
Introduction to Data Science and AnalyticsSrinath Perera
This webinar serves as an introduction to WSO2 Summer School. It will discuss how to build a pipeline for your organization and for each use case, and the technology and tooling choices that need to be made for the same.
This session will explore analytics under four themes:
Hindsight (what happened)
Oversight (what is happening)
Insight (why is it happening)
Foresight (what will happen)
Recording http://t.co/WcMFEAJHok
Intro to Data Science for Enterprise Big DataPaco Nathan
If you need a different format (PDF, PPT) instead of Keynote, please email me: pnathan AT concurrentinc DOT com
An overview of Data Science for Enterprise Big Data. In other words, how to combine structured and unstructured data, leveraging the tools of automation and mathematics, for highly scalable businesses. We discuss management strategy for building Data Science teams, basic requirements of the "science" in Data Science, and typical data access patterns for working with Big Data. We review some great algorithms, tools, and truisms for building a Data Science practice, and provide plus some great references to read for further study.
Presented initially at the Enterprise Big Data meetup at Tata Consultancy Services, Santa Clara, 2012-08-20 http://www.meetup.com/Enterprise-Big-Data/events/77635202/
Workshop with Joe Caserta, President of Caserta Concepts, at Data Summit 2015 in NYC.
Data science, the ability to sift through massive amounts of data to discover hidden patterns and predict future trends and actions, may be considered the "sexiest" job of the 21st century, but it requires an understanding of many elements of data analytics. This workshop introduced basic concepts, such as SQL and NoSQL, MapReduce, Hadoop, data mining, machine learning, and data visualization.
For notes and exercises from this workshop, click here: https://github.com/Caserta-Concepts/ds-workshop.
For more information, visit our website at www.casertaconcepts.com
Demystifying Data Science with an introduction to Machine LearningJulian Bright
The document provides an introduction to the field of data science, including definitions of data science and machine learning. It discusses the growing demand for data science skills and jobs. It also summarizes several key concepts in data science including the data science pipeline, common machine learning algorithms and techniques, examples of machine learning applications, and how to get started in data science through online courses and open-source tools.
Introduction to Data Science and Large-scale Machine LearningNik Spirin
This document is a presentation about data science and artificial intelligence given by James G. Shanahan. It provides an outline that covers topics such as machine learning, data science applications, architecture, and future directions. Shanahan has over 25 years of experience in data science and currently works as an independent consultant and teaches at UC Berkeley. The presentation provides background on artificial intelligence and machine learning techniques as well as examples of their successful applications.
This presentation is prepared by one of our renowned tutor "Suraj"
If you are interested to learn more about Big Data, Hadoop, data Science then join our free Introduction class on 14 Jan at 11 AM GMT. To register your interest email us at [email protected]
I work in a Data Innovation Lab with a horde of Data Scientists. Data Scientists gather data, clean data, apply Machine Learning algorithms and produce results, all of that with specialized tools (Dataiku, Scikit-Learn, R...). These processes run on a single machine, on data that is fixed in time, and they have no constraint on execution speed.
With my fellow Developers, our goal is to bring these processes to production. Our constraints are very different: we want the code to be versioned, to be tested, to be deployed automatically and to produce logs. We also need it to run in production on distributed architectures (Spark, Hadoop), with fixed versions of languages and frameworks (Scala...), and with data that changes every day.
In this talk, I will explain how we, Developers, work hand-in-hand with Data Scientists to shorten the path to running data workflows in production.
H2O World - Intro to Data Science with Erin LedellSri Ambati
This document provides an introduction to data science. It defines data science as using data to solve problems through the scientific method. The roles of data scientists, data analysts, and data engineers on a data science team are discussed. Popular tools for data science include Python, R, and APIs that connect data processing engines. Machine learning algorithms are used to perform tasks like classification, regression, and clustering by learning from data rather than being explicitly programmed. Deep learning and ensemble methods are also introduced. Resources for learning more about data science and machine learning are provided.
Applied Data Science: Building a Beer Recommender | Data Science MD - Oct 2014Austin Ogilvie
The document outlines Greg Lamp's presentation at a Data Science MD Meetup in October 2014 about Applied Data Science with Yhat. The presentation covers the challenges of building analytical applications, a case study of a beer recommender system built in Python using beer review data, and a demonstration of deploying the model through Yhat's platform. It concludes with a question and answer section.
Introduction to data science and candidate data science projectsJay (Jianqiang) Wang
This document provides an overview of potential data science projects and resources for a bootcamp program. It introduces the speaker and their background in data science. Several example projects are then outlined that involve analyzing Twitter data, bike sharing data, startup funding data, product sales data, and activity recognition data. Techniques like visualization, machine learning, and prediction modeling are discussed. Resources for learning statistics, programming, and data science are also listed. The document concludes with information about an online learning platform and a request for questions.
This document provides an introduction to data science, noting that 90% of the world's data was generated in the last two years. It discusses the fields of computer science, business, statistics, and data science. It describes two types of data scientists: statisticians who specialize in analysis and developers who specialize in building tools. It also lists some popular programming languages and visualization tools used in data science like Python, R, and Tableau. Finally, it provides some tips for those interested in data science such as learning design, public speaking, coding, and finding value.
Introduction to Data Science: A Practical Approach to Big Data AnalyticsIvan Khvostishkov
Meetup Moscow Big Systems/Big Data invited 3 March 2016 an engineer from EMC Corporation, Ivan Khvostishkov, to speak on key technologies and tools used in Big Data analytics, explain differences between Data Science and Business Intelligence and look closer on real use case from the industry. Materials are useful for engineers and analysts, who want to become contributors to Big Data projects, database professionals, college graduates and all, who want to know about Data Science as a career field.
The document outlines the typical lifecycle of a data science project, including business requirements, data acquisition, data preparation, hypothesis and modeling, evaluation and interpretation, and deployment. It discusses collecting data from various sources, cleaning and integrating data in the preparation stage, selecting and engineering features, building and validating models, and ultimately deploying results.
The document introduces the Dataset API in Spark, which provides type safety and performance benefits over DataFrames. Datasets allow operating on domain objects using compiled functions rather than Rows. Encoders efficiently serialize objects to and from the JVM. This allows type checking of operations and retaining objects in distributed operations. The document outlines the history of Spark APIs, limitations of DataFrames, and how Datasets address these through compiled encoding and working with case classes rather than Rows.
This document provides an introduction to a course on data science and R programming. The course aims to provide an overview of data science and the data science process. It introduces R, including its history and how to install R and RStudio. The first module covers basic R programming concepts such as vectors, matrices, factors, and data frames.
This document provides an introduction to analytics and data science. It defines analytics as the use of data, analysis, modeling, and fact-based management to drive decisions and actions. The benefits of analytics include better understanding of business dynamics, improved performance, and stronger decision making. Analytics can provide competitive advantages by exploiting unique organizational data. However, analytics may not be practical when there is no time or data, or when decisions rely heavily on experience. Becoming a data scientist requires skills in statistics, programming, communication, and more.
This document provides an introduction to data science. It discusses why data science is important and covers key techniques like statistics, data mining, and visualization. It also reviews popular tools and platforms for data science like R, Hadoop, and real-time systems. Finally, it discusses how data science can be applied across different business domains such as financial services, telecom, retail, and healthcare.
Bringing Machine Learning and Knowledge Graphs Together
Six Core Aspects of Semantic AI:
- Hybrid Approach
- Data Quality
- Data as a Service
- Structured Data Meets Text
- No Black-box
- Towards Self-optimizing Machines
Data Science - An emerging Stream of Science with its Spreading Reach & ImpactDr. Sunil Kr. Pandey
This is my presentation on the Topic "Data Science - An emerging Stream of Science with its Spreading Reach & Impact". I have compiled and collected different statistics and data from different sources. This may be useful for students and those who might be interested in this field of Study.
This document discusses getting to know data using R. It begins by outlining the typical steps in a data analysis, including defining the question, obtaining and cleaning the data, performing exploratory analysis, modeling, interpreting results, and creating reproducible code. It then describes different types of data science questions from descriptive to mechanistic. The remainder of the document provides more details on descriptive, exploratory, inferential, predictive, causal, and mechanistic analysis. It also discusses R, including its design, packages, data types like vectors, matrices, factors, lists, and data frames.
Talk delivered at High Performance Transaction Processing 2013
Myria is a new Big Data service being developed at the University of Washington. We feature high level language interfaces, a hybrid graph-relational data model, database-style algebraic optimization, a comprehensive REST API, an iterative programming model suitable for machine learning and graph analytics applications, and a tight connection to new theories of parallel computation.
In this talk, we describe the motivation for another big data platform emphasizing requirements emerging from the physical, life, and social sciences.
Data Science Provenance: From Drug Discovery to Fake FansJameel Syed
Knowledge work adds value to raw data; how this activity is performed is critical for how reliably results can be reproduced and scrutinized. With a brief diversion into epistemology, the presentation will outline the challenges for practitioners and consumers of Big Data analysis, and demonstrate how these were tackled at Inforsense (life sciences workflow analytics platform) and Musicmetric (social media analytics for music).
The talk covers the following issues with concrete examples:
- Representations of provenance
- Considerations to allow analysis computation to be recreated
- Reliable collection of noisy data from the internet
- Archiving of data and accommodating retrospective changes
- Using linked data to direct Big Data analytics
The document discusses data workflows and integrating open data from different sources. It defines a data workflow as a series of well-defined functional units where data is streamed between activities such as extraction, transformation, and delivery. The document outlines key steps in data workflows including extraction, integration, aggregation, and validation. It also discusses challenges around finding rules and ontologies, data quality, and maintaining workflows over time. Finally, it provides examples of data integration systems and relationships between global and source schemas.
Department of Commerce App Challenge: Big Data DashboardsBrand Niemann
The document summarizes Dr. Brand Niemann's presentation at the 2012 International Open Government Data Conference. It discusses open data principles and provides an example using EPA data. It also describes Niemann's beautiful spreadsheet dashboard for EPA metadata and APIs. Finally, it outlines Niemann's data science analytics approach for the conference, including knowledge bases, data catalog, and using business intelligence tools to analyze linked open government data.
The University of Washington eScience Institute aims to help position UW at the forefront of eScience techniques and technologies. Its strategy includes hiring research scientists, adding faculty in key fields, and building a consultancy of students. The exponential growth of data is transitioning science from data-poor to data-rich. Techniques like sensors, data management, and cloud computing are important. The "long tail" of smaller science projects is also worthy of investment and can have high impact if properly supported.
The document describes data workflows and data integration systems. It defines a data integration system as IS=<O,S,M> where O is a global schema, S is a set of data sources, and M are mappings between them. It discusses different views of data workflows including ETL processes, Linked Data workflows, and the data science process. Key steps in data workflows include extraction, integration, cleansing, enrichment, etc. Tools to support different steps are also listed. The document introduces global-as-view (GAV) and local-as-view (LAV) approaches to specifying the mappings M between the global and local schemas using conjunctive rules.
From Web Data to Knowledge: on the Complementarity of Human and Artificial In...Stefan Dietze
Inaugural lecture at Heinrich-Heine-University Düsseldorf on 28 May 2019.
Abstract:
When searching the Web for information, human knowledge and artificial intelligence are in constant interplay. On the one hand, human online interactions such as click streams, crowd-sourced knowledge graphs, semi-structured web markup or distributional semantic models built from billions of Web documents are informing machine learning and information retrieval models, for instance, as part of the Google search engine. On the other hand, the very same search engines help users in finding relevant documents, facts, or data for particular information needs, thereby helping users to gain knowledge. This talk will give an overview of recent work in both of the aforementioned areas. This includes 1) research on mining structured knowledge graphs of factual knowledge, claims and opinions from heterogeneous Web documents as well as 2) recent work in the field of interactive information retrieval, where supervised models are trained to predict the knowledge (gain) of users during Web search sessions in order to personalise rankings. Both streams of research are converging as part of online platforms and applications to facilitate access to data(sets), information and knowledge.
Scott Edmunds slides for class 8 from the HKU Data Curation (module MLIM7350 from the Faculty of Education) course covering science data, medical data and ethics, and the FAIR data principles.
"Big Data" is term heard more and more in industry – but what does it really mean? There is a vagueness to the term reminiscent of that experienced in the early days of cloud computing. This has led to a number of implications for various industries and enterprises. These range from identifying the actual skills needed to recruit talent to articulating the requirements of a "big data" project. Secondary implications include difficulties in finding solutions that are appropriate to the problems at hand – versus solutions looking for problems. This presentation will take a look at Big Data and offer the audience with some considerations they may use immediately to assess the use of analytics in solving their problems.
The talk begins with an idea of how big "Big Data" can be. This leads to an appreciation of how important "Management Questions" are to assessing analytic needs. The fields of data and analysis have become extremely important and impact nearly all facets of life and business. During the talk we will look at the two pillars of Big Data – Data Warehousing and Predictive Analytics. Then we will explore the open source tools and datasets available to NATO action officers to work in this domain. Use cases relevant to NATO will be explored with the purpose of show where analytics lies hidden within many of the day-to-day problems of enterprises. The presentation will close with a look at the future. Advances in the area of semantic technologies continue. The much acclaimed consultants at Gartner listed Big Data and Semantic Technologies as the first- and third-ranked top technology trends to modernize information management in the coming decade. They note there is an incredible value "locked inside all this ungoverned and underused information." HQ SACT can leverage this powerful analytic approach to capture requirement trends when establishing acquisition strategies, monitor Priority Shortfall Areas, prepare solicitations, and retrieve meaningful data from archives.
PAARL's 1st Marina G. Dayrit Lecture Series held at UP's Melchor Hall, 5F, Proctor & Gamble Audiovisual Hall, College of Engineering, on 3 March 2017, with Albert Anthony D. Gavino of Smart Communications Inc. as resource speaker on the topic "Using Big Data to Enhance Library Services"
Big Data in Learning Analytics - Analytics for Everyday LearningStefan Dietze
This document summarizes Stefan Dietze's presentation on big data in learning analytics. Some key points:
- Learning analytics has traditionally focused on formal learning environments but there is interest in expanding to informal learning online.
- Examples of potential big data sources mentioned include activity streams, social networks, behavioral traces, and large web crawls.
- Challenges include efficiently analyzing large datasets to understand learning resources and detect learning activities without traditional assessments.
- Initial models show potential to predict learner competence from behavioral traces with over 90% accuracy.
Data Curation and Debugging for Data Centric AIPaul Groth
It is increasingly recognized that data is a central challenge for AI systems - whether training an entirely new model, discovering data for a model, or applying an existing model to new data. Given this centrality of data, there is need to provide new tools that are able to help data teams create, curate and debug datasets in the context of complex machine learning pipelines. In this talk, I outline the underlying challenges for data debugging and curation in these environments. I then discuss our recent research that both takes advantage of ML to improve datasets but also uses core database techniques for debugging in such complex ML pipelines.
Presented at DBML 2022 at ICDE - https://www.wis.ewi.tudelft.nl/dbml2022
NSF Workshop Data and Software Citation, 6-7 June 2016, Boston USA, Software Panel
FIndable, Accessible, Interoperable, Reusable Software and Data Citation: Europe, Research Objects, and BioSchemas.org
International Collaboration Networks in the Emerging (Big) Data Sciencedatasciencekorea
This document summarizes research on international collaboration networks in emerging big data science. It finds that while global scientific collaboration is widespread, collaboration specifically in big data research is still relatively limited. The United States, Germany, United Kingdom, France, and other developed countries form the most central hubs in the big data collaboration network. The study aims to build on previous descriptive analyses by applying social network analysis and examining collaboration patterns and trends over time.
Roger hoerl say award presentation 2013Roger Hoerl
This document discusses how statistical engineering principles can help address challenges with "Big Data" projects. It argues that simply having powerful algorithms and large datasets does not guarantee good models or results. The leadership challenge for statisticians is to ensure Big Data projects are built on sound modeling foundations rather than hype. Statistical engineering principles like understanding data quality, using sequential approaches, and integrating subject matter knowledge can help improve the success of Big Data analyses and provide the statistical profession an opportunity for leadership in this area. Statistical engineering provides a framework to structure Big Data projects and incorporate fundamentals of good science that are sometimes overlooked.
This document provides an introduction and overview of the INF2190 - Data Analytics course. It discusses the instructor, Attila Barta, details on where and when the course will take place. It then provides definitions and history of data analytics, discusses how the field has evolved with big data, and references enterprise data analytics architectures. It contrasts traditional vs. big data era data analytics approaches and tools. The objective of the course is described as providing students with the foundation to become data scientists.
The document discusses using machine learning techniques to learn vector representations of SQL queries that can then be used for various workload management tasks without requiring manual feature engineering. It shows that representations learned from SQL strings using models like Doc2Vec and LSTM autoencoders can achieve high accuracy for tasks like predicting query errors, auditing users, and summarizing workloads for index recommendation. These learned representations allow workload management to be database agnostic and avoid maintaining database-specific feature extractors.
This document discusses the responsible use of data science techniques and technologies. It describes data science as answering questions using large, noisy, and heterogeneous datasets that were collected for unrelated purposes. It raises concerns about the irresponsible use of data science, such as algorithms amplifying biases in data. The work of the DataLab group at the University of Washington is presented, which aims to address these issues by developing techniques to balance predictive accuracy with fairness, increase data sharing while protecting privacy, and ensure transparency in datasets and methods.
Brief remarks on big data trends and responsible data science at the Workshop on Science and Technology for Washington State: Advising the Legislature, October 4th 2017 in Seattle.
Talk at ISIM 2017 in Durham, UK on applying database techniques to querying model results in the geosciences, with a broader position about the interaction between data science and simulation as modes of scientific inquiry.
The document discusses teaching data ethics in data science education. It provides context about the eScience Institute and a data science MOOC. It then presents a vignette on teaching data ethics using the example of an alcohol study conducted in Barrow, Alaska in 1979. The study had methodological and ethical issues in how it presented results to the community. The document concludes by discussing incorporating data ethics into all of the Institute's data science programs and initiatives like automated data curation and analyzing scientific literature visuals.
A talk at the Urban Science workshop at the Puget Sound Regional Council July 20 2014 organized by the Northwest Institute for Advanced Computing, a joint effort between Pacific Northwest National Labs and the University of Washington.
This document summarizes a presentation about Myria, a relational algorithmics-as-a-service platform developed by researchers at the University of Washington. Myria allows users to write queries and algorithms over large datasets using declarative languages like Datalog and SQL, and executes them efficiently in a parallel manner. It aims to make data analysis scalable and accessible for researchers across many domains by removing the need to handle low-level data management and integration tasks. The presentation provides an overview of the Myria architecture and compiler framework, and gives examples of how it has been used for projects in oceanography, astronomy, biology and medical informatics.
A 25 minute talk from a panel on big data curricula at JSM 2013
http://www.amstat.org/meetings/jsm/2013/onlineprogram/ActivityDetails.cfm?SessionID=208664
A taxonomy for data science curricula; a motivation for choosing a particular point in the design space; an overview of some our activities, including a coursera course slated for Spring 2012
Relational databases remain underused in the long tail of science, despite a number of significant
success stories and a natural correspondence between scientific inquiry and ad hoc database query.
Barriers to adoption have been articulated in the past, but spreadsheets and other file-oriented ap-
proaches still dominate. At the University of Washington eScience Institute, we are exploring a new
“delivery vector” for selected database features targeting researchers in the long tail: a web-based
query-as-a-service system called SQLShare that eschews conventional database design, instead empha-
sizing a simple Upload-Query-Share workflow and exposing a direct, full-SQL query interface over
“raw” tabular data. We augment the basic query interface with services for cleaning and integrating
data, recommending and authoring queries, and automatically generating visualizations. We find that
even non-programmers are able to create and share SQL views for a variety of tasks, including quality
control, integration, basic analysis, and access control. Researchers in oceanography, molecular biol-
ogy, and ecology report migrating data to our system from spreadsheets, from conventional databases,
and from ASCII files. In this paper, we will provide some examples of how the platform has enabled sci-
ence in other domains, describe our SQLShare system, and propose some emerging research directions
in this space for the database community.
This document discusses the roles that cloud computing and virtualization can play in reproducible research. It notes that virtualization allows for capturing the full computational environment of an experiment. The cloud builds on this by providing scalable resources and services for storage, computation and managing virtual machines. Challenges include costs, handling large datasets, and cultural adoption issues. Databases in the cloud may help support exploratory analysis of large datasets. Overall, the cloud shows promise for improving reproducibility by enabling sharing of full experimental environments and resources for computationally intensive analysis.
This document discusses enabling end-to-end eScience through integrating query, workflow, visualization, and mashups at an ocean observatory. It describes using a domain-specific query algebra to optimize queries on unstructured grid data from ocean models. It also discusses enabling rapid prototyping of scientific mashups through visual programming frameworks to facilitate data integration and analysis.
This document describes HaLoop, a system that extends MapReduce to efficiently support iterative data processing on large clusters. HaLoop introduces caching mechanisms that allow loop-invariant data to be accessed without reloading or reshuffling between iterations. This improves performance for iterative algorithms like PageRank, transitive closure, and k-means clustering. The largest gains come from caching invariant data in the reducer input cache to avoid unnecessary loading and shuffling. HaLoop also eliminates extra MapReduce jobs for termination checking in some cases. Overall, HaLoop shows that minimal extensions to MapReduce can efficiently support a wide range of recursive programs and languages on large-scale clusters.
This document discusses query-driven visualization in the cloud using MapReduce. It begins by explaining how all science is reducing to a database problem as data is acquired en masse independently of hypotheses. It then discusses why visualization and a cloud approach are useful before reviewing relevant technologies like relational databases, MapReduce, GridFields mesh algebra, and VisTrails workflows. Preliminary results are shown for climatology queries on a shared cloud and core visualization algorithms on a private cluster using MapReduce.
The document discusses the formation of a new partnership between the University of Washington and Carnegie Mellon University called the eScience Institute. The partnership will receive $1 million per year in funding from the state of Washington and $1.5 million from the Gordon and Betty Moore Foundation. The goal of the institute is to help universities stay competitive by positioning them at the forefront of modern techniques in data-intensive science fields like sensors, databases, and data mining.
"Machine Learning in Agriculture: 12 Production-Grade Models", Danil PolyakovFwdays
Kernel is currently the leading producer of sunflower oil and one of the largest agroholdings in Ukraine. What business challenges are they addressing, and why is ML a must-have? This talk explores the development of the data science team at Kernel—from early experiments in Google Colab to building minimal in-house infrastructure and eventually scaling up through an infrastructure partnership with De Novo. The session will highlight their work on crop yield forecasting, the positive results from testing on H100, and how the speed gains enabled the team to solve more business tasks.
办留学学历认证(USC毕业证书)南加利福尼亚大学毕业证学历证书代办服务【q微1954292140】Buy University of Southern California Diploma《正式成绩单论文没过》有文凭却得不到认证。又该怎么办???美国毕业证购买,美国文凭购买,【q微1954292140】美国文凭购买,美国文凭定制,美国文凭补办。专业在线定制美国大学文凭,定做美国本科文凭,【q微1954292140】复制美国University of Southern California completion letter。在线快速补办美国本科毕业证、硕士文凭证书,购买美国学位证、南加利福尼亚大学Offer,美国大学文凭在线购买。
主营项目:
1、真实教育部国外学历学位认证《美国毕业文凭证书快速办理南加利福尼亚大学学校原版文凭补办》【q微1954292140】《论文没过南加利福尼亚大学正式成绩单》,教育部存档,教育部留服网站100%可查.
2、办理USC毕业证,改成绩单《USC毕业证明办理南加利福尼亚大学学位证书网上查询》【Q/WeChat:1954292140】Buy University of Southern California Certificates《正式成绩单论文没过》,南加利福尼亚大学Offer、在读证明、学生卡、信封、证明信等全套材料,从防伪到印刷,从水印到钢印烫金,高精仿度跟学校原版100%相同.
3、真实使馆认证(即留学人员回国证明),使馆存档可通过大使馆查询确认.
4、留信网认证,国家专业人才认证中心颁发入库证书,留信网存档可查.
美国南加利福尼亚大学毕业证(USC毕业证书)USC文凭【q微1954292140】高仿真还原美国文凭证书和外壳,定制美国南加利福尼亚大学成绩单和信封。国外毕业证成绩单的办理流程USC毕业证【q微1954292140】学历学位证制作南加利福尼亚大学offer/学位证出售、留信官方学历认证(永久存档真实可查)采用学校原版纸张、特殊工艺完全按照原版一比一制作。帮你解决南加利福尼亚大学学历学位认证难题。
帮您解决在美国南加利福尼亚大学未毕业难题(University of Southern California)文凭购买、毕业证购买、大学文凭购买、大学毕业证购买、买文凭、日韩文凭、英国大学文凭、美国大学文凭、澳洲大学文凭、加拿大大学文凭(q微1954292140)新加坡大学文凭、新西兰大学文凭、爱尔兰文凭、西班牙文凭、德国文凭、教育部认证,买毕业证,毕业证购买,买大学文凭,【q微1954292140】学位证1:1完美还原海外各大学毕业材料上的工艺:水印,阴影底纹,钢印LOGO烫金烫银,LOGO烫金烫银复合重叠。文字图案浮雕、激光镭射、紫外荧光、温感、复印防伪等防伪工艺。《南加利福尼亚大学学位证书英文版美国毕业证书办理USC国外文凭电子版》
【办理南加利福尼亚大学成绩单Buy University of Southern California Transcripts】
购买日韩成绩单、英国大学成绩单、美国大学成绩单、澳洲大学成绩单、加拿大大学成绩单(q微1954292140)新加坡大学成绩单、新西兰大学成绩单、爱尔兰成绩单、西班牙成绩单、德国成绩单。成绩单的意义主要体现在证明学习能力、评估学术背景、展示综合素质、提高录取率,以及是作为留信认证申请材料的一部分。
南加利福尼亚大学成绩单能够体现您的的学习能力,包括南加利福尼亚大学课程成绩、专业能力、研究能力。(q微1954292140)具体来说,成绩报告单通常包含学生的学习技能与习惯、各科成绩以及老师评语等部分,因此,成绩单不仅是学生学术能力的证明,也是评估学生是否适合某个教育项目的重要依据!
南加利福尼亚大学offer/学位证、留信官方学历认证(永久存档真实可查)采用学校原版纸张、特殊工艺完全按照原版一比一制作【q微1954292140】Buy University of Southern California Diploma购买美国毕业证,购买英国毕业证,购买澳洲毕业证,购买加拿大毕业证,以及德国毕业证,购买法国毕业证(q微1954292140)购买荷兰毕业证、购买瑞士毕业证、购买日本毕业证、购买韩国毕业证、购买新西兰毕业证、购买新加坡毕业证、购买西班牙毕业证、购买马来西亚毕业证等。包括了本科毕业证,硕士毕业证。
特殊原因导致无法毕业,也可以联系我们帮您办理相关材料:
1:在南加利福尼亚大学挂科了,不想读了,成绩不理想怎么办?
2:打算回国了,找工作的时候,需要提供认证《USC成绩单购买办理南加利福尼亚大学毕业证书范本》
购买日韩毕业证、英国大学毕业证、美国大学毕业证、澳洲大学毕业证、加拿大大学毕业证(q微1954292140)新加坡大学毕业证、新西兰大学毕业证、爱尔兰毕业证、西班牙毕业证、德国毕业证,回国证明,留信网认证,留信认证办理,学历认证。从而完成就业。南加利福尼亚大学毕业证办理,南加利福尼亚大学文凭办理,南加利福尼亚大学成绩单办理和真实留信认证、留服认证、南加利福尼亚大学学历认证。学院文凭定制,南加利福尼亚大学原版文凭补办,成绩单购买办理,扫描件文凭定做,100%文凭复刻。
Understanding Large Language Model Hallucinations: Exploring Causes, Detectio...Tamanna36
This presentation delves into Large Language Model (LLM) hallucinations—incorrect or fabricated outputs that undermine reliability. It covers their causes (e.g., data limitations, transformer architecture), detection methods (like semantic entropy), prevention strategies (fine-tuning, RAG), and ethical concerns (misinformation, bias). The role of tokens and MLOps in managing hallucinations is explored, alongside the feasibility of hallucination-free LLMs. Designed for researchers, developers, and AI enthusiasts, it offers insights and practical approaches to enhance LLM accuracy and trustworthiness in critical applications like healthcare and legal systems.
Debo: A Lightweight and Modular Infrastructure Management System in Cssuser49be50
Discover Debo – a powerful, C-based infrastructure management tool inspired by Apache Ambari. This presentation details its unique architecture, highlighting its autonomous server capabilities, passive agent model, and modular directory structure. Ideal for system administrators and developers managing Hadoop-like clusters or standalone nodes.
How Data Annotation Services Drive Innovation in Autonomous Vehicles.docxsofiawilliams5966
Autonomous vehicles represent the cutting edge of modern technology, promising to revolutionize transportation by improving safety, efficiency, and accessibility.
15 Benefits of Data Analytics in Business Growth.pdfAffinityCore
Explore how data analytics boosts business growth with insights that improve decision-making, customer targeting, operations, and long-term profitability.
4. “The intuition behind this ought to be very simple: Mr. Obama
is maintaining leads in the polls in Ohio and other states that
are sufficient for him to win 270 electoral votes.”
Nate Silver, Oct. 26, 2012
“…the argument we’re making is exceedingly simple. Here it
is: Obama’s ahead in Ohio.”
Nate Silver, Nov. 2, 2012
“The bar set by the competition was invitingly low. Someone could
look like a genius simply by doing some fairly basic research into
what really has predictive power in a political campaign.”
Nate Silver, Nov. 10, 2012
DailyBeast
fivethirtyeight.com
fivethirtyeight.comsource: randy stewart
Nate Silver
5. 6/17/2015 Bill Howe, UW 5
“…the biggest win came from good old SQL on a Vertica data
warehouse and from providing access to data to dozens of
analytics staffers who could follow their own curiosity and
distill and analyze data as they needed.”
Dan Woods
Jan 13 2013, CITO Research
“The decision was made to have Hadoop do the aggregate generations
and anything not real-time, but then have Vertica to answer sort of
‘speed-of-thought’ queries about all the data.”
Josh Hendler, CTO of H & K Strategies
Related: Obama campaign’s data-driven ground game
"In the 21st century, the candidate with [the] best data,
merged with the best messages dictated by that data, wins.”
Andrew Rasiej, Personal Democracy Forum
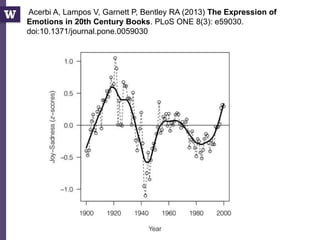
8. Acerbi A, Lampos V, Garnett P, Bentley RA (2013) The Expression of
Emotions in 20th Century Books. PLoS ONE 8(3): e59030.
doi:10.1371/journal.pone.0059030
1) Convert all the digitized books in the 20th century into n-grams
(Thanks, Google!)
(http://books.google.com/ngrams/)
2) Label each 1-gram (word) with a mood score.
(Thanks, WordNet!)
3) Count the occurences of each mood word
A 1-gram: “yesterday”
A 5-gram: “analysis is often described as”
9. Acerbi A, Lampos V, Garnett P, Bentley RA (2013) The Expression of
Emotions in 20th Century Books. PLoS ONE 8(3): e59030.
doi:10.1371/journal.pone.0059030
10. 6/17/2015 Bill Howe, UW 10
Acerbi A, Lampos V, Garnett P, Bentley RA (2013) The Expression of
Emotions in 20th Century Books. PLoS ONE 8(3): e59030.
doi:10.1371/journal.pone.0059030
11. 6/17/2015 Bill Howe, UW 11
…
2. Michel J-P, Shen YK, Aiden AP, Veres A, Gray MK, et al. (2011)
Quantitative analysis of culture using millions of digitized books.
Science 331: 176–182. doi: 10.1126/science.1199644. Find this article
online
3. Lieberman E, Michel J-P, Jackson J, Tang T, Nowak MA (2007)
Quantifying the evolutionary dynamics of language. Nature 449: 713–
716. doi: 10.1038/nature06137. Find this article online
4. Pagel M, Atkinson QD, Meade A (2007) Frequency of word-use
predicts rates of lexical evolution throughout Indo-European history.
Nature 449: 717–720. doi: 10.1038/nature06176. Find this article online
…
6. DeWall CN, Pond RS Jr, Campbell WK, Twenge JM (2011) Tuning in to
Psychological Change: Linguistic Markers of Psychological Traits and
Emotions Over Time in Popular U.S. Song Lyrics. Psychology of
Aesthetics, Creativity and the Arts 5: 200–207. doi: 10.1037/a0023195. Find
this article online
…
12. What is Data Science?
• Fortune
– “Hot New Gig in Tech”
• Hal Varian, Google’s Chief Economist, NYT, 2009:
– “The next sexy job”
– “The ability to take data—to be able to understand it, to
process it, to extract value from it, to visualize it, to
communicate it—that’s going to be a hugely important skill.”
• Mike Driscoll, CEO of metamarkets:
– “Data science, as it's practiced, is a blend of Red-Bull-fueled
hacking and espresso-inspired statistics.”
– “Data science is the civil engineering of data. Its acolytes
possess a practical knowledge of tools & materials, coupled
with a theoretical understanding of what's possible.”
6/17/2015 Bill Howe, UW 12
14. What do data scientists do?
“They need to find nuggets of truth in data and then explain it to the
business leaders”
Data scientists “tend to be “hard scientists”, particularly physicists, rather
than computer science majors. Physicists have a strong mathematical
background, computing skills, and come from a discipline in which survival
depends on getting the most from the data. They have to think about the
big picture, the big problem.”
6/17/2015 Bill Howe, UW 14
-- DJ Patil, Chief Scientist at LinkedIn
-- Rchard Snee, EMC
15. Mike Driscoll’s three sexy skills of data geeks
• Statistics
– traditional analysis
• Data Munging
– parsing, scraping, and formatting data
• Visualization
– graphs, tools, etc.
6/17/2015 Bill Howe, UW 15
16. “Data Science refers to an emerging area of work
concerned with the collection, preparation, analysis,
visualization, management and preservation of large
collections of information.”
6/17/2015 Bill Howe, UW 16
Jeffrey Stanton
Syracuse University School of Information Studies
An Introduction to Data Science
17. Data Science is about Data Products
• “Data-driven apps”
– Spellchecker
– Machine Translator
• Interactive visualizations
– Google flu application
– Global Burden of Disease
• Online Databases
– Enterprise data warehouse
– Sloan Digital Sky Survey
6/17/2015 Bill Howe, UW 17
(Mike Loukides)
Data science is about building data
products, not just answering questions
Data products empower others to use
the data.
May help communicate your results
(e.g., Nate Silver’s maps)
May empower others to do their own
analysis
(e.g., Global Burden of Disease)
18. A Typical Data Science Workflow
6/17/2015 Bill Howe, UW 18
1) Preparing to run a model
2) Running the model
3) Interpreting the results
Gathering, cleaning, integrating, restructuring,
transforming, loading, filtering, deleting, combining,
merging, verifying, extracting, shaping, massaging
“80% of the work”
-- Aaron Kimball
“The other 80% of the work”
19. 6/17/2015 Bill Howe, UW 19
What are the abstractions of
data science?
“Data Jujitsu”
“Data Wrangling”
“Data Munging”
Translation: “We have no idea what
this is all about”
20. 6/17/2015 Bill Howe, UW 20
1850s: matrices and linear algebra (today: engineers and scientists)
1950s: arrays and custom algorithms (today: C/Fortran performance junkies)
1950s: s-expressions and pure functions (today: language purists)
1960s: objects and methods (today: software engineers)
1970s: files and scripts (today: system administrators)
1970s: relations and relational algebra (today: large-scale data engineers)
1980s: data frames and functions (today: statisticians)
2000s: key-value pairs + one of the above (today: NoSQL hipsters)
But what are the abstractions of
data science?
22. 6/17/2015 Bill Howe, eScience Institute 22
Pre-Relational: if your data changed, your application broke.
Early RDBMS were buggy and slow (and often reviled), but required only 5% of
the application code.
“Activities of users at terminals and most application programs
should remain unaffected when the internal representation of data
is changed and even when some aspects of the external
representation are changed.”
Key Ideas: Programs that manipulate tabular data exhibit an
algebraic structure allowing reasoning and manipulation
independently of physical data representation
Relational Database History
-- Codd 1979
23. 6/17/2015 Bill Howe, eScience Institute 23
Key Idea: “Physical Data Independence”
physical data independence
files and
pointers
relations
SELECT seq
FROM ncbi_sequences
WHERE seq = ‘GATTACGATATTA’;
f = fopen(‘table_file’);
fseek(10030440);
while (True) {
fread(&buf, 1, 8192, f);
if (buf == GATTACGATATTA) {
. . .
24. 6/17/2015 Bill Howe, eScience Institute 24
Key Idea: An Algebra of Tables
select
project
join join
Other operators: aggregate, union, difference, cross product
25. Equivalent logical expressions
25
σp=knows(R) o=s (σp=holdsAccount(R) o=s σp=accountHomepage(R))
(σp=knows(R) o=s σp=holdsAccount(R)) o=s σp=accountHomepage(R)
σp1=knows & p2=holdsAccount & p3=accountHomepage (R x R x R)
right associative
left associative
distributive
26. 6/17/2015 Bill Howe, eScience Institute 26
Why do we care? Algebraic Optimization
N = ((z*2)+((z*3)+0))/1
Algebraic Laws:
1. (+) identity: x+0 = x
2. (/) identity: x/1 = x
3. (*) distributes: (n*x+n*y) = n*(x+y)
4. (*) commutes: x*y = y*x
Apply rules 1, 3, 4, 2:
N = (2+3)*z
two operations instead of five, no division operator
Same idea works with the Relational Algebra!
27. So what? RA is now ubiquitous
• Galaxy – “bioinformatics workflows”
• Pandas and Blaze: High Performance Arrays in Python
merge(left, right, on=‘key’)
• dplyr in R
filter(x), select(x), arrange(x), groupby(x),
inner_join(x, y), left_join(x, y)
• Hadoop and contemporaries all evolved to support RA-like interfaces:
Pig, HIVE, Cascalog, Flume, Spark/Shark, Dremel
“…Operate on Genomics Intervals -> Join”
29. Year
System/
Paper
Scale to
1000s
Primary
Index
Secondary
Indexes Transactions
Joins/
Analytics
Integrity
Constraints Views
Language/
Algebra
Data
model my label
1971 RDBMS O ✔ ✔ ✔ ✔ ✔ ✔ ✔ tables sql-like
2003 memcached ✔ ✔ O O O O O O key-val nosql
2004 MapReduce ✔ O O O ✔ O O O key-val batch
2005 CouchDB ✔ ✔ ✔ record MR O ✔ O document nosql
2006 BigTable/Hbase ✔ ✔ ✔ record compat. w/MR / O O ext. record nosql
2007 MongoDB ✔ ✔ ✔ EC, record O O O O document nosql
2007 Dynamo ✔ ✔ O O O O O O ext. record nosql
2008 Pig ✔ O O O ✔ / O ✔ tables sql-like
2008 HIVE ✔ O O O ✔ ✔ O ✔ tables sql-like
2008 Cassandra ✔ ✔ ✔ EC, record O ✔ ✔ O key-val nosql
2009 Voldemort ✔ ✔ O EC, record O O O O key-val nosql
2009 Riak ✔ ✔ ✔ EC, record MR O key-val nosql
2010 Dremel ✔ O O O / ✔ O ✔ tables sql-like
2011 Megastore ✔ ✔ ✔ entity groups O / O / tables nosql
2011 Tenzing ✔ O O O O ✔ ✔ ✔ tables sql-like
2011 Spark/Shark ✔ O O O ✔ ✔ O ✔ tables sql-like
2012 Spanner ✔ ✔ ✔ ✔ ? ✔ ✔ ✔ tables sql-like
2013 Impala ✔ O O O ✔ ✔ O ✔ tables sql-like
NoSQL and related systems, by feature
30. 6/17/2015 Bill Howe, UW 30
Year
System/
Paper
Scale to
1000s
Primary
Index
Secondary
Indexes Transactions
Joins/
Analytics
Integrity
Constraints Views
Language/
Algebra
Data
model my label
1971 RDBMS O ✔ ✔ ✔ ✔ ✔ ✔ ✔ tables sql-like
2003 memcached ✔ ✔ O O O O O O key-val nosql
2004 MapReduce ✔ O O O ✔ O O O key-val batch
2005 CouchDB ✔ ✔ ✔ record MR O ✔ O document nosql
2006 BigTable (Hbase) ✔ ✔ ✔ record compat. w/MR / O O ext. record nosql
2007 MongoDB ✔ ✔ ✔ EC, record O O O O document nosql
2007 Dynamo ✔ ✔ O O O O O O ext. record nosql
2008 Pig ✔ O O O ✔ / O ✔ tables sql-like
2008 HIVE ✔ O O O ✔ ✔ O ✔ tables sql-like
2008 Cassandra ✔ ✔ ✔ EC, record O ✔ ✔ O key-val nosql
2009 Voldemort ✔ ✔ O EC, record O O O O key-val nosql
2009 Riak ✔ ✔ ✔ EC, record MR O key-val nosql
2010 Dremel ✔ O O O / ✔ O ✔ tables sql-like
2011 Megastore ✔ ✔ ✔ entity groups O / O / tables nosql
2011 Tenzing ✔ O O O O ✔ ✔ ✔ tables sql-like
2011 Spark/Shark ✔ O O O ✔ ✔ O ✔ tables sql-like
2012 Spanner ✔ ✔ ✔ ✔ ? ✔ ✔ ✔ tables sql-like
2012 Accumulo ✔ ✔ ✔ record compat. w/MR / O O ext. record nosql
2013 Impala ✔ O O O ✔ ✔ O ✔ tables sql-like
Scale was the primary motivation!
31. 6/17/2015 Bill Howe, UW 31
Rick Cattel’s clustering from
“Scalable SQL and NoSQL Data Stores”
SIGMOD Record, 2010
extensible record stores
document stores
key-value stores
Year
System/
Paper
Scale to
1000s
Primary
Index
Secondary
Indexes Transactions
Joins/
Analytics
Integrity
Constraints Views
Language/
Algebra
Data
model my label
1971 RDBMS O ✔ ✔ ✔ ✔ ✔ ✔ ✔ tables sql-like
2003 memcached ✔ ✔ O O O O O O key-val nosql
2004 MapReduce ✔ O O O ✔ O O O key-val batch
2005 CouchDB ✔ ✔ ✔ record MR O ✔ O document nosql
2006 BigTable (Hbase) ✔ ✔ ✔ record compat. w/MR / O O ext. record nosql
2007 MongoDB ✔ ✔ ✔ EC, record O O O O document nosql
2007 Dynamo ✔ ✔ O O O O O O key-val nosql
2008 Pig ✔ O O O ✔ / O ✔ tables sql-like
2008 HIVE ✔ O O O ✔ ✔ O ✔ tables sql-like
2008 Cassandra ✔ ✔ ✔ EC, record O ✔ ✔ O key-val nosql
2009 Voldemort ✔ ✔ O EC, record O O O O key-val nosql
2009 Riak ✔ ✔ ✔ EC, record MR O key-val nosql
2010 Dremel ✔ O O O / ✔ O ✔ tables sql-like
2011 Megastore ✔ ✔ ✔ entity groups O / O / tables nosql
2011 Tenzing ✔ O O O O ✔ ✔ ✔ tables sql-like
2011 Spark/Shark ✔ O O O ✔ ✔ O ✔ tables sql-like
2012 Spanner ✔ ✔ ✔ ✔ ? ✔ ✔ ✔ tables sql-like
2012 Accumulo ✔ ✔ ✔ record compat. w/MR / O O ext. record nosql
2013 Impala ✔ O O O ✔ ✔ O ✔ tables sql-like
32. 6/17/2015 Bill Howe, UW 32
Year
System/
Paper
Scale to
1000s
Primary
Index
Secondary
Indexes Transactions
Joins/
Analytics
Integrity
Constraints Views
Language/
Algebra
Data
model my label
1971 RDBMS O ✔ ✔ ✔ ✔ ✔ ✔ ✔ tables sql-like
2003 memcached ✔ ✔ O O O O O O key-val nosql
2004 MapReduce ✔ O O O ✔ O O O key-val batch
2005 CouchDB ✔ ✔ ✔ record MR O ✔ O document nosql
2006
BigTable
(Hbase) ✔ ✔ ✔ record compat. w/MR / O O ext. record nosql
2007 MongoDB ✔ ✔ ✔ EC, record O O O O document nosql
2007 Dynamo ✔ ✔ O O O O O O ext. record nosql
2008 Pig ✔ O O O ✔ / O ✔ tables sql-like
2008 HIVE ✔ O O O ✔ ✔ O ✔ tables sql-like
2008 Cassandra ✔ ✔ ✔ EC, record O ✔ ✔ O key-val nosql
2009 Voldemort ✔ ✔ O EC, record O O O O key-val nosql
2009 Riak ✔ ✔ ✔ EC, record MR O key-val nosql
2010 Dremel ✔ O O O / ✔ O ✔ tables sql-like
2011 Megastore ✔ ✔ ✔ entity groups O / O / tables nosql
2011 Tenzing ✔ O O O ✔ ✔ ✔ ✔ tables sql-like
2011 Spark/Shark ✔ O O O ✔ ✔ O ✔ tables sql-like
2012 Spanner ✔ ✔ ✔ ✔ ? ✔ ✔ ✔ tables sql-like
2012 Accumulo ✔ ✔ ✔ record compat. w/MR / O O ext. record nosql
2013 Impala ✔ O O O ✔ ✔ O ✔ tables sql-like
MapReduce-based Systems
33. 6/17/2015 Bill Howe, UW 33
2004
Hadoop
2005
MapReduce
2006
2007
2008
2009
2010
2011
2012
MapReduce-based Systems
non-Google open
source implementation
direct influence /
shared features
compatible
implementation of
Pig
HIVE
Tenzing
Impala
34. 6/17/2015 Bill Howe, UW 34
Year
System/
Paper
Scale to
1000s
Primary
Index
Secondary
Indexes Transactions
Joins/
Analytics
Integrity
Constraints Views
Language/
Algebra
Data
model my label
1971 RDBMS O ✔ ✔ ✔ ✔ ✔ ✔ ✔ tables sql-like
2003 memcached ✔ ✔ O O O O O O key-val nosql
2004 MapReduce ✔ O O O ✔ O O O key-val batch
2005 CouchDB ✔ ✔ ✔ record MR O ✔ O document nosql
2006
BigTable
(Hbase) ✔ ✔ ✔ record compat. w/MR / O O ext. record nosql
2007 MongoDB ✔ ✔ ✔ EC, record O O O O document nosql
2007 Dynamo ✔ ✔ O O O O O O ext. record nosql
2008 Pig ✔ O O O ✔ / O ✔ tables sql-like
2008 HIVE ✔ O O O ✔ ✔ O ✔ tables sql-like
2008 Cassandra ✔ ✔ ✔ EC, record O ✔ ✔ O key-val nosql
2009 Voldemort ✔ ✔ O EC, record O O O O key-val nosql
2009 Riak ✔ ✔ ✔ EC, record MR O key-val nosql
2010 Dremel ✔ O O O / ✔ O ✔ tables sql-like
2011 Megastore ✔ ✔ ✔ entity groups O / O / tables nosql
2011 Tenzing ✔ O O O ✔ ✔ ✔ ✔ tables sql-like
2011 Spark/Shark ✔ O O O ✔ ✔ O ✔ tables sql-like
2012 Spanner ✔ ✔ ✔ ✔ ? ✔ ✔ ✔ tables sql-like
2012 Accumulo ✔ ✔ ✔ record compat. w/MR / O O ext. record nosql
2013 Impala ✔ O O O ✔ ✔ O ✔ tables sql-like
35. 6/17/2015 Bill Howe, UW 35
BigTable
Cassandra
2004
2005
memcached
2006
2007
2008
2009
Spanner
Megastore
2010
2011
2012
NoSQL Systems
direct influence /
shared features
compatible
implementation of
Dynamo
Voldemort Riak
Accumulo
2003
CouchDB
MongoDB
36. 6/17/2015 Bill Howe, UW 36
A lot of these systems give up joins!
Year source
System/
Paper
Scale to
1000s
Primary
Index
Secondary
Indexes Transactions
Joins/
Analytics
Integrity
Constraints Views
Language/
Algebra
Data
model my label
1971 many RDBMS O ✔ ✔ ✔ ✔ ✔ ✔ ✔ tables SQL-like
2003 other memcached ✔ ✔ O O O O O O key-val lookup
2004 Google MapReduce ✔ O O O ✔ O O O key-val MR
2005 couchbase CouchDB ✔ ✔ ✔ record MR O ✔ O document filter/MR
2006 Google BigTable (Hbase) ✔ ✔ ✔ record compat. w/MR / O O ext. record filter/MR
2007 10gen MongoDB ✔ ✔ ✔ EC, record O O O O document filter
2007 Amazon Dynamo ✔ ✔ O O O O O O key-val lookup
2007 Amazon SimpleDB ✔ ✔ ✔ O O O O O ext. record filter
2008 Yahoo Pig ✔ O O O ✔ / O ✔ tables RA-like
2008 Facebook HIVE ✔ O O O ✔ ✔ O ✔ tables SQL-like
2008 Facebook Cassandra ✔ ✔ ✔ EC, record O ✔ ✔ O key-val filter
2009 other Voldemort ✔ ✔ O EC, record O O O O key-val lookup
2009 basho Riak ✔ ✔ ✔ EC, record MR O key-val filter
2010 Google Dremel ✔ O O O / ✔ O ✔ tables SQL-like
2011 Google Megastore ✔ ✔ ✔ entity groups O / O / tables filter
2011 Google Tenzing ✔ O O O ✔ ✔ ✔ ✔ tables SQL-like
2011 Berkeley Spark/Shark ✔ O O O ✔ ✔ O ✔ tables SQL-like
2012 Google Spanner ✔ ✔ ✔ ✔ ? ✔ ✔ ✔ tables SQL-like
2012 Accumulo Accumulo ✔ ✔ ✔ record compat. w/MR / O O ext. record filter
2013 Cloudera Impala ✔ O O O ✔ ✔ O ✔ tables SQL-like
37. Joins
• Ex: Show all comments by “Sue” on any blog post by “Jim”
• Method 1:
– Lookup all blog posts by Jim
– For each post, lookup all comments and filter for “Sue”
• Method 2:
– Lookup all comments by Sue
– For each comment, lookup all posts and filter for “Jim”
• Method 3:
– Filter comments by Sue, filter posts by Jim,
– Sort all comments by blog id, sort all blogs by blog id
– Pull one from each list to find matches
6/17/2015 Bill Howe, UW 37
38. 6/17/2015 Bill Howe, UW 38
Year
System/
Paper
Scale to
1000s
Primary
Index
Secondary
Indexes Transactions
Joins/
Analytics
Integrity
Constraints Views
Language/
Algebra
Data
model my label
1971 RDBMS O ✔ ✔ ✔ ✔ ✔ ✔ ✔ tables SQL-like
2003 memcached ✔ ✔ O O O O O O key-val lookup
2004 MapReduce ✔ O O O ✔ O O O key-val MR
2005 CouchDB ✔ ✔ ✔ record MR O ✔ O document filter/MR
2006 BigTable (Hbase) ✔ ✔ ✔ record compat. w/MR / O O ext. record filter/MR
2007 MongoDB ✔ ✔ ✔ EC, record O O O O document filter
2007 Dynamo ✔ ✔ O O O O O O key-val lookup
2008 Pig ✔ O O O ✔ / O ✔ tables RA-like
2008 HIVE ✔ O O O ✔ ✔ O ✔ tables SQL-like
2008 Cassandra ✔ ✔ ✔ EC, record O ✔ ✔ O key-val filter
2009 Voldemort ✔ ✔ O EC, record O O O O key-val lookup
2009 Riak ✔ ✔ ✔ EC, record MR O key-val filter
2010 Dremel ✔ O O O / ✔ O ✔ tables SQL-like
2011 Megastore ✔ ✔ ✔ entity groups O / O / tables filter
2011 Tenzing ✔ O O O O ✔ ✔ ✔ tables SQL-like
2011 Spark/Shark ✔ O O O ✔ ✔ O ✔ tables SQL-like
2012 Spanner ✔ ✔ ✔ ✔ ? ✔ ✔ ✔ tables SQL-like
2012 Accumulo ✔ ✔ ✔ record compat. w/MR / O O ext. record filter
2013 Impala ✔ O O O ✔ ✔ O ✔ tables SQL-like
39. • Two value propositions
– Performance: “I started with MySQL, but
had a hard time scaling it out in a
distributed environment”
– Flexibility: “My data doesn’t conform to a
rigid schema”
6/17/2015 Bill Howe, UW 39
NoSQL Criticism
Stonebraker CACM (blog 2)
40. NoSQL Criticism: flexibility argument
• Who are the customers of NoSQL?
– Lots of startups
• Very few enterprises. Why? most
applications are traditional OLTP on
structured data; a few other applications
around the “edges”, but considered less
important
6/17/2015 Bill Howe, UW 40
Stonebraker CACM (blog 2)
41. Some Takeaways
• Data wrangling is the hard part of data
science, not statistics
• Relational algebra is the right
abstraction for reasoning about data
wrangling
• Even “NoSQL” systems that explicitly
rejected relational concepts eventually
brought them back
6/17/2015 Bill Howe, UW 41