Handout used by the Westerville Public Library for the Introduction to Excel 2007 class. Provides basic information about creating a spreadsheet using Microsoft Excel 2007.
Microsoft Excel allows users to organize data into spreadsheets. It contains workbooks with multiple worksheets made of cells organized into rows and columns. Excel provides functions to perform calculations and analyze data. Users can format worksheets, insert charts and images, and print selections of cells or entire worksheets. Formulas using built-in functions can easily calculate and manipulate data in Excel.
- The document provides a tutorial on using Microsoft Excel. It begins with an introduction to Excel and its widespread use.
- The tutorial then covers basic Excel functions like opening and saving worksheets, formatting cells, using formulas to perform calculations, and creating a checkbook register to track expenses and balances.
- An example is provided to demonstrate setting up a basic checkbook in Excel with columns for date, description, withdrawals, deposits and balance. Formulas are used to automatically calculate the running balance.
This document provides an overview of key aspects of Microsoft Excel including its features, file formats, navigation keys, worksheets, formatting, cells and ranges, formulas, functions, and error values. It describes Excel's abilities for number crunching, creating charts and graphs, organizing lists, and accessing other data. It also outlines the basic components of formulas in Excel including operators, cell references, values/text, and functions. Finally, it provides examples of commonly used functions like SUM, AVERAGE, VLOOKUP, and COUNTIF.
This document provides instructions for using basic features in Microsoft Excel, including:
- Opening and navigating the Excel interface
- Entering data into cells
- Formatting cells and adjusting column widths/row heights
- Using AutoSum to calculate totals
- Saving workbooks
- Inserting and deleting rows/columns of data
- Using basic formulas
- Printing and previewing worksheets
- Autofilling data to expand budgets over multiple periods
This document provides an introduction and overview of Microsoft Excel. It discusses key aspects of Excel including its use as a spreadsheet program to record and analyze numerical data in columns and rows. It describes the Office button, formatting text, inserting rows and columns, sorting and editing data, using formulas and functions, and some shortcut keys.
Excel is a spreadsheet program used to store and manipulate data. It consists of workbooks containing worksheets with rows and columns that intersect to form cells. The basic Excel features include functions, auto fill, charts, and pivot tables. Shortcut keys allow quick navigation between tabs, selecting ranges, editing cells, and common commands like save, print, open and close. The document provides an overview of Excel and its key components along with examples of functions and commonly used shortcut keys.
This document provides an overview of key Excel concepts and tasks, including:
1) Excel is a program used to enter and analyze quantitative data in spreadsheets. It allows what-if analysis by changing values to assess impacts.
2) The tutorial covers navigating and exploring Excel, entering data, formulas and functions, formatting cells, inserting and deleting rows/columns/worksheets, and printing worksheets.
3) Formulas use operators to combine values from cells and return a single result. Functions are predefined formulas like SUM to simplify calculations.
This document provides an introduction and overview of key concepts in Microsoft Excel including worksheets, cells, formatting, formulas, functions, charts, and pivot tables. It explains how to create and manage worksheets, format cells, perform calculations with formulas and functions, create charts to visualize data, build pivot tables to summarize and filter data, and consolidate data across multiple worksheets. Examples and step-by-step instructions are provided for common Excel tasks like renaming sheets, merging cells, using arithmetic and logical operators in formulas, and linking worksheets to consolidate data.
Microsoft Word is word processing software that allows users to create a variety of documents. It has features like tables, illustrations, fonts, and formatting tools. Documents can be opened, saved, printed, and shared. The ribbon interface contains tabs for common tasks like inserting objects, formatting text, and manipulating paragraphs. Users can also search and replace text, add page borders, and insert watermarks.
This document provides an overview of the basic features and interface of Microsoft Excel, including how to open and save worksheets, customize Excel, modify worksheets by formatting cells and adding formulas and functions, and sort and filter data. It describes the main parts of the Excel interface such as the ribbon, formula bar, rows and columns, scroll bars, and sheet tabs. It also explains how to exit Excel.
The document provides an overview of Microsoft Excel, including:
- Excel is used to organize and manipulate numerical data in electronic spreadsheets. It allows users to perform calculations, create charts and graphs, and format information.
- The Excel interface includes tabs for worksheets, a title bar, menu bar, and toolbars for common functions like formatting and calculations.
- Key functions covered include entering and formatting data, creating formulas for calculations, sorting and filtering data, inserting charts and graphs, printing worksheets, and using keyboard shortcuts.
This document provides an overview of functions in Microsoft Excel. It discusses the different categories of functions available, including financial, date & time, maths & trigonometric, statistical, lookup & references, database, text, logical, and engineering functions. It explains that VBA enables powerful programming capabilities in Excel for tasks like data analysis, modeling, report generation, and more. Examples of commonly used financial, date & time, and math functions are also listed.
The document is a tutorial for using Microsoft Excel. It provides step-by-step instructions on how to navigate the Excel interface and use basic functions. The tutorial covers topics such as navigating the Excel screen, entering formulas and data, formatting worksheets, creating charts, and using keyboard shortcuts. It also includes explanations and instructions for common Excel tasks like opening and saving files, editing data, printing worksheets, and more.
This document provides an introduction to Microsoft Excel. It begins with opening Excel and navigating within workbooks and worksheets. It describes entering different types of data like numbers, text, formulas. It discusses selecting cells, entering and editing data, copying and moving data using fill handle. It also covers saving workbooks in compatibility mode to allow opening in older Excel versions. The document is presented by Abdulbasit H. Mhdi and contains guidance, instructions and screenshots to explain key Excel concepts.
Microsoft Word is a word processing software that allows users to type documents. It has various tools and functions that can be accessed via shortcuts, ribbons, and dialog boxes to format text and insert items into documents. The document provides an overview of the MS Word environment and interface, describes common shortcuts, and explains how to use various formatting, editing, reviewing, page layout, and viewing tools.
This document provides a 3-paragraph summary of a PowerPoint presentation on Excel:
The presentation introduces Excel as a software program developed by Microsoft that allows users to organize and calculate data in a spreadsheet. It describes the basic Excel interface including worksheets, cells, formulas, and functions. Common functions like SUM, AVERAGE, MIN, and MAX are explained. The presentation also covers formatting text and numbers, inserting shapes and pictures, printing options, and other Excel features.
Excel functions and formulas are demonstrated including relative and absolute cell references. Logical IF functions are introduced to conditionally format cells based on comparisons. Syntax for IF functions is provided. Common Excel elements like toolbars, menus, sorting, and conditional formatting
Excel is an application used to perform numeric calculations, analyze data, and present results. It contains worksheets made up of cells organized into rows and columns that can hold numbers, text, formulas, or a combination. Each cell is identified by its row and column address. Users can enter or edit data directly into cells or with formulas and select ranges of multiple cells to perform actions on groups of cells at once.
Microsoft Excel is a spreadsheet application that allows users to organize and calculate data across rows and columns in a workbook. It can import various data types and formats them for analysis. Excel uses formulas and functions to perform calculations on cell values. Common functions include SUM to add values and AVERAGE to calculate means. Charts and graphs can visually represent data. Workbooks may contain multiple worksheets to organize related data in different tables.
Microsoft Excel 2016 Basics Course contentsAnil Kumar
Microsoft Excel 2016 Basics course for Beginners
Objective: This is free Microsoft Excel 2016 Basics course. In this course, you will learn about working with Microsoft Excel 2016.
After completion of this course, you will be familiar to work with Microsoft Excel 2016.
Microsoft Excel 2016 Basics Course Contents
1. Introduction to Microsoft Excel 2016
2. Microsoft Excel 2016 New Features
3. Microsoft Excel 2016 Application Interface
4. Data Entry in Excel, Cells and Ranges
5. Formatting Data and Conditional Formatting
6. Introduction to Tables
7. Saving Workbooks in Multiple Formats
8. Basic Functions in Excel
9. Creating Charts
10. Printing Options in Excel 2016
check out more details about this course from http://msofficeguru.in (Anil Kumar Devarasetti)
This document provides an introduction to basic Excel concepts like worksheets, cells, entering and formatting data, selecting ranges, and using formulas. It explains that worksheets are comprised of cells organized in rows and columns. It demonstrates how to select cells, enter and modify text and values, format cell appearance, work with ranges, and create basic formulas using functions like SUM and COUNTIF. The document is an introductory guide to getting started with the fundamentals of the Excel program.
Formulas in Excel begin with an equal sign and include cell references and operators. Functions are predefined formulas that perform calculations using specific cell values called arguments. Both formulas and functions can be copied and will adjust cell references depending on whether they use relative, absolute, or mixed references. Functions simplify formulas by using cell ranges and built-in calculations like SUM, AVERAGE, and TODAY.
Microsoft Excel is the world's most widely used spreadsheet program and part of the Microsoft Office suite. Excel excels at creating charts, solving numerical problems, and handling non-numerical problems. Formulas in Excel use mathematical instructions and references to cells or ranges to perform calculations using operators, constants, and functions. Scenarios in Excel allow users to model different outcomes by changing inputs and seeing updated results.
Microsoft Word is a word processing program that allows users to create documents by typing text and formatting it. Word is part of the Microsoft Office suite and is commonly used to create documents, save them, print them, and share them electronically. The document provides instructions on how to open and work with a basic Word document, including how to insert text, pictures, tables, and headers/footers and how to format text using fonts, alignment, line spacing, and other tools. It also describes how to check spelling and grammar, undo/redo actions, and close a Word document.
MS Excel Learning for PPC Google AdWords Training CourseRanjan Jena
MS Excel learning to get expertise in Google AdWords training course. Learn all important tips and techniques in MS Excel for your fast and easy approach to Google AdWords analysis and reporting formats.
Ranjan Jena conducts Adwords Training session in Bangalore, currently with more than 45 students already graduated under his guidance and mentorship. For any training need, you can directly reach him at +91-7760969452
1. This document provides instructions for using basic Microsoft Excel functions like opening Excel, navigating the ribbon interface, entering data into cells, formatting cells, using autofill, and other common tasks.
2. It explains the different parts of the Excel interface like tabs, groups, commands, and describes the different data types Excel recognizes.
3. The document provides step-by-step examples for tasks like entering text and numbers, selecting cells, cutting/copying/pasting data, inserting and deleting rows and columns, and using basic formatting options.
PowerPoint as an Interactive Teaching ToolGeoff Cain
PowerPoint can be an effective interactive teaching tool if used properly, but it also has some drawbacks if overused or used passively. When used interactively with activities like questions, games, and focusing exercises, it can help students engage with and process information. However, it tends to oversimplify information if it becomes the sole delivery method with too many bullet points and not enough discussion. The key is to use PowerPoint to supplement other materials and activities, not replace discussion or other learning methods.
This document provides guidance on using PowerPoint effectively for presentations. It discusses the various toolbars in PowerPoint and how to use them. It also offers tips on creating slides, such as using simple designs with short bullet points, consistent formatting, and colors. The document emphasizes keeping content concise and using visual elements like images, charts and animation effects sparingly to reinforce key points.
Microsoft PowerPoint is a presentation program developed by Microsoft as part of its Microsoft Office suite. It allows users to create slideshow presentations consisting of text, images, videos, and other objects that can be displayed on-screen or printed. PowerPoint has tools for inserting tables, charts, graphics, and other media and formatting slide layouts, as well as tools for animating and transitioning between slides during a live presentation. The main components of the PowerPoint interface include the ribbon, which contains tabs for commonly used tools, and the Microsoft Office button for creating new presentations or accessing recently opened ones.
Microsoft PowerPoint is a program used to create slideshow presentations. It allows users to choose layouts, content, designs, templates, animations and transitions for their slides. Originally called PRESENTER and developed by Forethought, Inc., it was acquired by Microsoft in 1987 and renamed to PowerPoint. It provides templates, design options and tips to help users create effective presentations.
How to create a basic power point presentationjoluisae
This document provides instructions for creating a basic PowerPoint presentation in 9 steps:
1) Open PowerPoint and save your project, saving often to prevent data loss.
2) Create a title slide with the presentation title and subtitle.
3) Choose a slide design template.
4) Add new slides and edit the slide layout.
5) Add text to slides by adjusting font settings.
6) Add pictures to slides by inserting images from your computer.
7) Create multiple slides by following steps 4-6.
8) Add slide transitions by selecting different transition styles and settings.
9) Repeat step 8 to add transitions to other slides and preview the completed presentation.
This document provides an overview of key Excel features and functions for formatting worksheets, entering and editing data, printing worksheets, and more. It discusses topics like the Excel interface, creating and saving workbooks/worksheets, inserting and deleting rows/columns, formatting cells and worksheets, using auto-fill, and printing options for worksheets or the entire workbook. The document is intended as a basic introduction and reference for common Excel tasks.
This document provides an overview of key Excel features and functions for formatting worksheets, entering and editing data, printing worksheets, and more. It discusses topics like the Excel interface, creating and saving workbooks/worksheets, inserting and deleting rows/columns, formatting cells and worksheets, using auto-fill, and printing options for worksheets or selections. The document is intended as a basic introduction and reference for common Excel tasks.
Microsoft Excel is a spreadsheet application that allows users to organize and calculate data across rows and columns in a workbook. It can import various data types and formats them for analysis. Excel uses formulas and functions to perform calculations on cell values. Common functions include SUM to add values and AVERAGE to calculate means. Charts and graphs can visually represent spreadsheet data. Workbooks may contain multiple worksheets to organize different data sets.
Excel is an application used to create spreadsheets containing numerical values, formulas, and charts. It allows users to enter data into cells organized into rows and columns and perform calculations on that data. The basic elements of an Excel file include worksheets containing grids of cells organized by column letters and row numbers, grouped together in workbooks. Formulas and functions can be used to calculate and analyze the data in cells. Common tasks like formatting, sorting, conditional formatting, and summarizing data help users understand and visualize information in Excel spreadsheets.
This document provides an overview of basic MS Excel functions including creating and opening workbooks, navigating worksheets, entering different types of data like text, numbers, dates and times, formatting cells, editing data, inserting and deleting columns and rows, and using basic formulas. It explains key Excel concepts such as the ribbon, columns, rows and cells, worksheets, cell references, and functions. It provides step-by-step instructions for common tasks in Excel.
This document provides an introduction to Microsoft Excel by covering the Excel interface, opening and saving worksheets, entering and editing data, building formulas and functions, and formatting and printing data. It explores the components of the Excel window including the standard toolbar, formatting toolbar, formula bar, name box, row and column headings, active cell, and fill handle. It also describes how to enter and edit data, move around the worksheet, copy and move data, and work with Excel documents by opening, saving, and creating new workbooks.
Microsoft Excel is a spreadsheet program that allows users to enter, organize, and analyze data. It maintains records relating to finances, products, activities, events, and services. Excel workbooks contain individual worksheets made up of cells organized into rows and columns. Formulas can be used to perform calculations with cell values. Navigation between cells can be done using the mouse, keyboard shortcuts, or by entering cell references.
ms excel for mba first sem students of dr hs gour university sagar(m.p)gaurav jain
This document provides an overview and introduction to Microsoft Excel. It discusses the Excel screen layout including titles bars, menus, toolbars, and worksheets. It describes how to navigate and enter data into cells. Various Excel functions are also outlined such as formulas for addition, subtraction, multiplication and division. Other topics covered include formatting worksheets, creating charts, printing, and keyboard shortcuts. The document serves as a basic guide for getting started using Excel.
The document provides an introduction to Microsoft Excel by covering key topics such as the Excel interface, entering and editing data, building formulas and functions, formatting cells and data, and printing. It explains how to open and save Excel files, navigate and select cells, clear cell contents, copy and move data, and get help. Formulas, functions, formatting, and printing are described in more detail.
This document defines key terms related to the Excel user interface and workbooks. It describes:
1) The main components of the Excel interface including the title bar, menus, toolbars, worksheet, cells, and sheet tabs.
2) How workbooks contain worksheets made up of columns and rows that intersect to form cells.
3) How to navigate within and between worksheets using keyboard shortcuts, scroll bars, and sheet tabs.
This document provides training on creating a workbook in Microsoft Excel 2007. It covers topics such as opening a new workbook, understanding worksheets and cells, entering data, and editing data. The training is broken into 3 lessons:
1) Meet the workbook - Covers basics like the ribbon interface, workbooks, worksheets, columns, rows, and cells.
2) Enter data - Explains how to enter text, numbers, dates, and times. Also covers quick data entry methods like AutoComplete and AutoFill.
3) Edit data and revise worksheets - Shows how to edit existing data, remove data formatting, and add or delete columns and rows. Practice questions and exercises are included.
This document provides a training course on creating a workbook in Microsoft Excel 2007. It covers topics such as opening a new workbook, entering data, editing data, and revising worksheets by inserting and deleting columns and rows. The training includes lessons on meeting the workbook, entering data, and editing data. It provides instructions, screenshots and examples for common tasks in Excel as well as practice questions for each lesson.
Microsoft Excel 2007: Create Your First Workbookomoviejohn
This document provides an overview and lessons for a Microsoft Excel 2007 training course on creating a workbook. The course covers entering and editing data in Excel by teaching students how to create and navigate workbooks and worksheets, enter text, numbers, dates and times into cells, and use the ribbon interface. The goals are to create a new workbook, enter and edit data, and insert and delete columns and rows. Lesson 1 focuses on the workbook, worksheets, columns, rows and cells, and Lesson 2 covers entering data into cells.
This document provides an overview and contents of a 3-day Microsoft Excel 2010 training course. The training is intended for beginners and will cover setting up workbooks, customizing the Excel window, working with data and tables, applying visual effects, and printing workbooks. Specific topics include entering data into cells, editing data, formatting cells, and inserting and deleting columns and rows.
Uses & applications of microsoft excel in vph researchDr Alok Bharti
Microsoft Excel is a spreadsheet application that allows users to enter and organize data into columns and rows, perform calculations with formulas, and visualize data through graphs and charts. It consists of worksheets where data is entered into cells that are organized by columns and rows. Common functions include formatting cells, filtering and sorting data, and using formulas to analyze data through calculations and pivot tables to examine relationships between variables.
This document provides instructions for starting a new workbook in Excel by creating a blank workbook, inserting text into cells, editing and deleting text, navigating through the worksheet using keyboard shortcuts, and saving the workbook. It explains how to select cells and enter text, delete text using backspace or delete keys, move through the sheet using tab and arrow keys, and save the workbook for the first time or with a new name. The challenge at the end asks the user to practice these skills in a new blank workbook.
This document provides an overview and lessons for creating your first workbook in Microsoft Excel 2007. It covers topics such as opening a new workbook, entering data into cells, editing data, and inserting/deleting columns and rows. The lessons include instructions and screenshots to help the reader learn Excel basics like working with the ribbon interface, entering text, dates, numbers, and using auto-complete and auto-fill functions. Practice questions and answers are provided to test comprehension. The overall goal is to teach the skills needed to work in Excel and create a basic workbook.
The document provides an overview of key features in Microsoft Excel 2013, including:
- Creating and editing spreadsheets with cells, cell content like text and formulas, and basic functions like SUM.
- Managing worksheets through inserting, deleting, copying and moving rows and columns.
- Formatting cells through wrapping text, merging and formatting cells.
- Using the Excel interface including the Ribbon, Quick Access toolbar and Backstage view.
Slavery was introduced to the British North American colonies in 1619 when approximately 20 Africans were sold as slaves in Jamestown, Virginia. While slavery was banned in the Northwest Territory in 1787, it was not abolished nationwide until the passage of the 13th amendment in 1865 after the Civil War, which the South fought to protect their right to own slaves.
From a barn to a one-room schoolhouse to a system with over 25 buildings, discover the changes in education from 1808 to today. For more information, visit www.westervillelibrary.org.
The document provides information about upcoming events at the Westerville Public Library in Westerville, Ohio. It announces that Emily Giffin, a popular author of chick lit novels, will be visiting the library on April 6th for a presentation and book signing. It also advertises the library's hoopla digital service which allows patrons to instantly borrow movies, music, audiobooks and more with no wait times or late fees. Additionally, it provides a schedule of upcoming children's and adult programs at the library throughout April and May.
The document provides information about upcoming events at the Westerville Public Library in Westerville, Ohio for winter 2016-2017. It includes details about author presentations by Chris Bohjalian and Lisa Wood, cooking demonstrations, music performances, reading programs for adults and children, and assistance for students preparing Ohio History Day projects. The library has once again been recognized as a Five-Star Library by Library Journal, placing it in the top 1% of libraries nationally.
Hoopla for Libraries: Instructions for Your Computer or DeviceWesterville Library
Hoopla is a digital media lending platform available through Westerville Library that allows users to stream or download movies, TV shows, music, eBooks, audiobooks and comics to their computers, tablets, phones and e-readers by accessing content with their library card. Users can browse and search Hoopla's catalog, check out available titles, and the loans will automatically return at the end of the lending period, ranging from 3 days for movies/TV to 21 days for eBooks/audiobooks. The instructions guide users through creating an account, accessing content from any device using the Hoopla app, and playing or downloading checked out titles.
The document provides information about upcoming events at the Westerville Public Library, including presentations on genealogy research, a water project in Congo, preventing child abduction, local author talks, and activities for youth like an ice cream social and making guacamole. It also announces that the Library Link program awarded top-participating schools Mark Twain Elementary and Heritage Middle School for most materials delivered to students this school year.
This document provides information about upcoming events at the Westerville Public Library in Westerville, Ohio. It announces that Pulitzer Prize-winning author Anthony Doerr will give a presentation and book signing on May 7. It also advertises sports-themed activities for children and teens from May 26-June 30 as part of the library's summer reading program. Additionally, it invites community members to participate in surveys and video interviews during National Library Week from April 10-16 for a chance to win a gift card.
This annual report summarizes the Westerville Public Library's activities and accomplishments in 2015. It highlights that the library hosted a popular author event series and circulated over 2 million items. It also details new services offered including 3D printing and WiFi hotspots, facility improvements like upgrades to the local history center, and strong financial support from the local community.
The first pioneers came to Westerville using an Indian trail that became 161. More than 150 years passed before the completion of I-270 at Westerville Road. Vehicles changed from horse and oxen-drawn wagons to cars, trucks and motorcycles fueled by gas, diesel and electricity. The arrival of the train and trolley were greeted with great excitement by Westerville citizens but both disappeared as new forms of transportation became popular.
If those pioneers who came here 200 years ago could visit today, we can only imagine their shock at the changes in transportation: forests have become roads; bridges span the local creeks; airplanes occupy the sky with the birds; and cars travel busy highways at 70 miles per hour arriving quickly at their destinations.
For more information, visit www.westervillelibrary.org
The *nervous system of insects* is a complex network of nerve cells (neurons) and supporting cells that process and transmit information. Here's an overview:
Structure
1. *Brain*: The insect brain is a complex structure that processes sensory information, controls behavior, and integrates information.
2. *Ventral nerve cord*: A chain of ganglia (nerve clusters) that runs along the insect's body, controlling movement and sensory processing.
3. *Peripheral nervous system*: Nerves that connect the central nervous system to sensory organs and muscles.
Functions
1. *Sensory processing*: Insects can detect and respond to various stimuli, such as light, sound, touch, taste, and smell.
2. *Motor control*: The nervous system controls movement, including walking, flying, and feeding.
3. *Behavioral responThe *nervous system of insects* is a complex network of nerve cells (neurons) and supporting cells that process and transmit information. Here's an overview:
Structure
1. *Brain*: The insect brain is a complex structure that processes sensory information, controls behavior, and integrates information.
2. *Ventral nerve cord*: A chain of ganglia (nerve clusters) that runs along the insect's body, controlling movement and sensory processing.
3. *Peripheral nervous system*: Nerves that connect the central nervous system to sensory organs and muscles.
Functions
1. *Sensory processing*: Insects can detect and respond to various stimuli, such as light, sound, touch, taste, and smell.
2. *Motor control*: The nervous system controls movement, including walking, flying, and feeding.
3. *Behavioral responses*: Insects can exhibit complex behaviors, such as mating, foraging, and social interactions.
Characteristics
1. *Decentralized*: Insect nervous systems have some autonomy in different body parts.
2. *Specialized*: Different parts of the nervous system are specialized for specific functions.
3. *Efficient*: Insect nervous systems are highly efficient, allowing for rapid processing and response to stimuli.
The insect nervous system is a remarkable example of evolutionary adaptation, enabling insects to thrive in diverse environments.
The insect nervous system is a remarkable example of evolutionary adaptation, enabling insects to thrive
CBSE - Grade 8 - Science - Chemistry - Metals and Non Metals - WorksheetSritoma Majumder
Introduction
All the materials around us are made up of elements. These elements can be broadly divided into two major groups:
Metals
Non-Metals
Each group has its own unique physical and chemical properties. Let's understand them one by one.
Physical Properties
1. Appearance
Metals: Shiny (lustrous). Example: gold, silver, copper.
Non-metals: Dull appearance (except iodine, which is shiny).
2. Hardness
Metals: Generally hard. Example: iron.
Non-metals: Usually soft (except diamond, a form of carbon, which is very hard).
3. State
Metals: Mostly solids at room temperature (except mercury, which is a liquid).
Non-metals: Can be solids, liquids, or gases. Example: oxygen (gas), bromine (liquid), sulphur (solid).
4. Malleability
Metals: Can be hammered into thin sheets (malleable).
Non-metals: Not malleable. They break when hammered (brittle).
5. Ductility
Metals: Can be drawn into wires (ductile).
Non-metals: Not ductile.
6. Conductivity
Metals: Good conductors of heat and electricity.
Non-metals: Poor conductors (except graphite, which is a good conductor).
7. Sonorous Nature
Metals: Produce a ringing sound when struck.
Non-metals: Do not produce sound.
Chemical Properties
1. Reaction with Oxygen
Metals react with oxygen to form metal oxides.
These metal oxides are usually basic.
Non-metals react with oxygen to form non-metallic oxides.
These oxides are usually acidic.
2. Reaction with Water
Metals:
Some react vigorously (e.g., sodium).
Some react slowly (e.g., iron).
Some do not react at all (e.g., gold, silver).
Non-metals: Generally do not react with water.
3. Reaction with Acids
Metals react with acids to produce salt and hydrogen gas.
Non-metals: Do not react with acids.
4. Reaction with Bases
Some non-metals react with bases to form salts, but this is rare.
Metals generally do not react with bases directly (except amphoteric metals like aluminum and zinc).
Displacement Reaction
More reactive metals can displace less reactive metals from their salt solutions.
Uses of Metals
Iron: Making machines, tools, and buildings.
Aluminum: Used in aircraft, utensils.
Copper: Electrical wires.
Gold and Silver: Jewelry.
Zinc: Coating iron to prevent rusting (galvanization).
Uses of Non-Metals
Oxygen: Breathing.
Nitrogen: Fertilizers.
Chlorine: Water purification.
Carbon: Fuel (coal), steel-making (coke).
Iodine: Medicines.
Alloys
An alloy is a mixture of metals or a metal with a non-metal.
Alloys have improved properties like strength, resistance to rusting.
Multi-currency in odoo accounting and Update exchange rates automatically in ...Celine George
Most business transactions use the currencies of several countries for financial operations. For global transactions, multi-currency management is essential for enabling international trade.
Understanding P–N Junction Semiconductors: A Beginner’s GuideGS Virdi
Dive into the fundamentals of P–N junctions, the heart of every diode and semiconductor device. In this concise presentation, Dr. G.S. Virdi (Former Chief Scientist, CSIR-CEERI Pilani) covers:
What Is a P–N Junction? Learn how P-type and N-type materials join to create a diode.
Depletion Region & Biasing: See how forward and reverse bias shape the voltage–current behavior.
V–I Characteristics: Understand the curve that defines diode operation.
Real-World Uses: Discover common applications in rectifiers, signal clipping, and more.
Ideal for electronics students, hobbyists, and engineers seeking a clear, practical introduction to P–N junction semiconductors.
Geography Sem II Unit 1C Correlation of Geography with other school subjectsProfDrShaikhImran
The correlation of school subjects refers to the interconnectedness and mutual reinforcement between different academic disciplines. This concept highlights how knowledge and skills in one subject can support, enhance, or overlap with learning in another. Recognizing these correlations helps in creating a more holistic and meaningful educational experience.
GDGLSPGCOER - Git and GitHub Workshop.pptxazeenhodekar
This presentation covers the fundamentals of Git and version control in a practical, beginner-friendly way. Learn key commands, the Git data model, commit workflows, and how to collaborate effectively using Git — all explained with visuals, examples, and relatable humor.
How to Subscribe Newsletter From Odoo 18 WebsiteCeline George
Newsletter is a powerful tool that effectively manage the email marketing . It allows us to send professional looking HTML formatted emails. Under the Mailing Lists in Email Marketing we can find all the Newsletter.
A measles outbreak originating in West Texas has been linked to confirmed cases in New Mexico, with additional cases reported in Oklahoma and Kansas. The current case count is 817 from Texas, New Mexico, Oklahoma, and Kansas. 97 individuals have required hospitalization, and 3 deaths, 2 children in Texas and one adult in New Mexico. These fatalities mark the first measles-related deaths in the United States since 2015 and the first pediatric measles death since 2003.
The YSPH Virtual Medical Operations Center Briefs (VMOC) were created as a service-learning project by faculty and graduate students at the Yale School of Public Health in response to the 2010 Haiti Earthquake. Each year, the VMOC Briefs are produced by students enrolled in Environmental Health Science Course 581 - Public Health Emergencies: Disaster Planning and Response. These briefs compile diverse information sources – including status reports, maps, news articles, and web content– into a single, easily digestible document that can be widely shared and used interactively. Key features of this report include:
- Comprehensive Overview: Provides situation updates, maps, relevant news, and web resources.
- Accessibility: Designed for easy reading, wide distribution, and interactive use.
- Collaboration: The “unlocked" format enables other responders to share, copy, and adapt seamlessly. The students learn by doing, quickly discovering how and where to find critical information and presenting it in an easily understood manner.
CURRENT CASE COUNT: 817 (As of 05/3/2025)
• Texas: 688 (+20)(62% of these cases are in Gaines County).
• New Mexico: 67 (+1 )(92.4% of the cases are from Eddy County)
• Oklahoma: 16 (+1)
• Kansas: 46 (32% of the cases are from Gray County)
HOSPITALIZATIONS: 97 (+2)
• Texas: 89 (+2) - This is 13.02% of all TX cases.
• New Mexico: 7 - This is 10.6% of all NM cases.
• Kansas: 1 - This is 2.7% of all KS cases.
DEATHS: 3
• Texas: 2 – This is 0.31% of all cases
• New Mexico: 1 – This is 1.54% of all cases
US NATIONAL CASE COUNT: 967 (Confirmed and suspected):
INTERNATIONAL SPREAD (As of 4/2/2025)
• Mexico – 865 (+58)
‒Chihuahua, Mexico: 844 (+58) cases, 3 hospitalizations, 1 fatality
• Canada: 1531 (+270) (This reflects Ontario's Outbreak, which began 11/24)
‒Ontario, Canada – 1243 (+223) cases, 84 hospitalizations.
• Europe: 6,814
A measles outbreak originating in West Texas has been linked to confirmed cases in New Mexico, with additional cases reported in Oklahoma and Kansas. The current case count is 795 from Texas, New Mexico, Oklahoma, and Kansas. 95 individuals have required hospitalization, and 3 deaths, 2 children in Texas and one adult in New Mexico. These fatalities mark the first measles-related deaths in the United States since 2015 and the first pediatric measles death since 2003.
The YSPH Virtual Medical Operations Center Briefs (VMOC) were created as a service-learning project by faculty and graduate students at the Yale School of Public Health in response to the 2010 Haiti Earthquake. Each year, the VMOC Briefs are produced by students enrolled in Environmental Health Science Course 581 - Public Health Emergencies: Disaster Planning and Response. These briefs compile diverse information sources – including status reports, maps, news articles, and web content– into a single, easily digestible document that can be widely shared and used interactively. Key features of this report include:
- Comprehensive Overview: Provides situation updates, maps, relevant news, and web resources.
- Accessibility: Designed for easy reading, wide distribution, and interactive use.
- Collaboration: The “unlocked" format enables other responders to share, copy, and adapt seamlessly. The students learn by doing, quickly discovering how and where to find critical information and presenting it in an easily understood manner.
1. WESTERVILLE PUBLIC LIBRARY
Introduction to Microsoft
Excel 2007
2009
What Can I Do with Excel?
• You can enter two basic kinds of data into worksheet cells: numbers and text.
• You can use Excel to create budgets, to work with taxes, or to record student
grades.
• You can use Excel to list the products you sell or to record student
attendance.
• You can even use Excel to track how much you exercise every day, and your
weight loss, or how much your house remodel is costing you. The possibilities
are endless.
126 SOUTH STATE STREET WESTERVILLE OH 43081
2. Creating a new workbook
When you start Excel, you open a workbook that is called Book1. Each new workbook comes
with three worksheets, like pages in a document. You enter data into the worksheets.
(Worksheets are sometimes called spreadsheets.) The illustrated workbook has three tabs, one for
each of the three worksheets.
Click this tab to add a new worksheet.
It's a good idea to rename the sheet tabs to make the information on each sheet easier to identify.
For example, you might have sheet tabs called January, February, and March for budgets or
student grades for those months, or Northcoast and Westcoast for sales regions. You can add and
delete additional worksheets as needed. To rename the sheet tabs right-click on the tab and click
Rename in the menu options.
To create a new workbook:
• Click the Microsoft Office Button at the upper left.
• Then click New.
• In the New Workbook window, click Blank workbook.
2
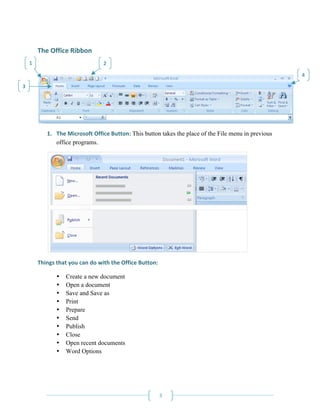
3. The Office Ribbon
1 2
4
3
1. The Microsoft Office Button: This button takes the place of the File menu in previous
office programs.
Things that you can do with the Office Button:
• Create a new document
• Open a document
• Save and Save as
• Print
• Prepare
• Send
• Publish
• Close
• Open recent documents
• Word Options
3
4. 2. Quick Access Toolbar: Commands can be added to and removed from this toolbar. This is
a good place to add commands that you use often.
3. Tabs: Sits across the top of the Ribbon. Once you select a given tab (Home, Insert, Page
Layout, etc.), different task buttons will appear.
4. Help Button: This button will open up a help window; you will need an Internet
connection to use this function.
How data is organized in Excel
Excel organizes data in a grid of cells, columns (1), and rows (2).
• Columns go from top to bottom on the worksheet, vertically. Column headings are
indicated by letters.
• Rows go from left to right on the worksheet, horizontally. Row headings are indicated by
numbers.
• A cell is the space where one column and one row meet. The content of a cell is uniquely
identified based on the intersection where the column and row meet. To refer to a cell,
you will need to find the column letter and the row number. (For example, the first cell
in a worksheet is referred to as A1).
4
5. When you open a new workbook, the first cell is the active cell. It has a black outline. In the
second picture, cell C5 is selected and is the active cell. It is outlined in black.
1. Column C is highlighted.
2. Row 5 is highlighted.
3. Cell C5, the active cell, is shown in the Name Box in the upper-left corner of the
worksheet.
You can enter data by clicking any cell in the worksheet.
Keep in mind that there are 17,179,869,184 cells on each worksheet. You could get lost without
the cell reference to tell you where you are.
Entering Data
5
6. When you enter data, it's a good idea to start by entering titles at the top of each column and
beginning of each row so that anyone who shares your worksheet can understand what the data
means (and so that you can understand it yourself, later on).
In the above picture, the column titles are the months of the year, across the top of the worksheet.
To change the active cell, press TAB to move one cell to the right. Press ENTER to move down
one cell.
Enter date and time
6
7. Excel aligns text on the left side of cells, but it aligns dates on the right side of cells.
To enter a date in column B, the Date column, you should use a slash or a hyphen to separate the
parts: 7/16/2009 or 16-July-2009. Excel will recognize this as a date.
If you need to enter a time, type the numbers, a space, and then "a" or "p" — for example, 9:00
p. If you enter just the number, Excel automatically recognizes a time and enters it as AM.
Tip: To enter today's date, press CTRL and the semicolon (;) together. To enter the current time,
press CTRL and SHIFT and the semicolon all at once.
Enter numbers
Excel aligns numbers on the right side of cells.
To enter the sales amounts in column C, the Amount column, you would type the dollar sign ($),
followed by the amount.
Other numbers and how to enter them:
• To enter fractions, leave a space between the whole number and the fraction. For
example, 1 1/8.
• To enter a fraction only, enter a zero first. For example, 0 1/4. If you enter 1/4 without the
zero, Excel will interpret the number as a date, January 4.
• To enter a negative number, type the number in parenthesis, such as (100). Excel will
display the number as -100.
Quick ways to enter data
Here are two time-savers you can use to enter data in Excel:
AutoFill Enter the months of the year, the days of the week, multiples of 2 or 3, or other data
in a series. You type one or more entries, and then extend the series by dragging the corner of the
cell.
AutoComplete If the first few letters you type in a cell match an entry you've already made in
that column, Excel will fill in the remaining characters for you. Just press ENTER when you see
them added. This works for text or for text with numbers. It does not work for numbers only, for
dates, or for times.
7
8. Edit data
1. Double-click a cell to edit the data in it.
2. Or, after clicking in the cell, edit the data in the formula bar.
3. The worksheet displays Edit in the status bar.
Remember to press ENTER or TAB when you are finished so that your changes stay in the cell.
Remove data formatting
8
9. Excel often formats your cells based on certain criteria. If you want to remove any formatting
automatically created by Excel, click in the cell and then, on the Home tab, in the Editing group,
click the arrow on the Clear Button image. Then click Clear Formats, which removes the
format from the cell. Or you can click Clear All to remove both the data and the formatting at
the same time.
To insert a column:
• Click any cell in the column immediately to the right of where you want the new column
to go. So if you want to add a column between columns B and C, you'd click a cell in
column C, to the right of the new location.
• Then, on the Home tab, in the Cells group, click the arrow on Insert.
• On the drop-down menu, click Insert Sheet Columns.
• A new blank column is inserted.
To insert a row:
• Click any cell in the row immediately below where you want the new row to go.
• For example, to insert a new row between row 4 and row 5, click a cell in row 5.
• Then in the Cells group, click the arrow on Insert.
• On the drop-down menu, click Insert Sheet Rows.
• A new blank row is inserted.
Sizing Rows and Columns
To change the size of a row or column, move your cursor over the top of the divider on the top
(for a column) or left side (for a row) of the spreadsheet. When the pointer turns into a cross with
arrows you can click and drag the divider to where you want it. You also can double-click on the
divider and it will automatically adjust to fit the data in the row or column.
How to save a file
To save a workbook in Excel:
• Click on the Office button and choose Save As.
• Where it says Save as Type choose, Excel 97-03 Workbook from the list.
• You will be asked to name the file and then choose a location for the file.
• Note: You can save the document as an Excel 2007 file, but if you will be sharing files
with someone who still uses Office 2003, they will be unable to open your file. It is best
practice to save your files as Excel 97-03 documents.
9
10. Entering Formulas
The two CDs purchased in February cost $12.99 and $16.99. The total of these two values is the
CD expense for the month.
You can add these values in Excel by typing a simple formula into cell C6.
Excel formulas always begin with an equal sign (=). Here's the formula typed into cell C6 to add
12.99 and 16.99:
=12.99+16.99
The plus sign (+) is a math operator that tells Excel to add the values.
If you wonder later on how you got this result, the formula is visible in the formula bar Formula
bar near the top of the worksheet whenever you click in cell C6 again.
How to use math operators
Math operators
Add (+) =10+5
Subtract (‐) =10‐5
Multiply (*) =10*5
Divide (/) =10/5
• Excel uses familiar signs to build formulas.
• To do more than add, use other math operators as you type formulas into worksheet cells.
• Remember to always start each formula with an equal sign.
10
11. Total all the values in a column
To add up the total of expenses for January, you don't have to type all those values again.
Instead, you can use a prewritten formula, called a function.
You can get the January total in cell B7 by highlighting the cells you want to add together, then
clicking Sum in the Editing group on the Home tab. This enters the SUM function, which
adds up all the values in a range of cells. To save time, use this function whenever you have
more than a few values to add up, so that you don't have to type the formula.
Pressing ENTER displays the SUM function result 95.94 in cell B7. The formula
=SUM(B3:B6) appears in the formula bar whenever you click in cell B7.
B3:B6 is the information, called the argument, which tells the SUM function what to add. By
using a cell reference (B3:B6) instead of the values in those cells, Excel can automatically update
results if values change later on. The colon (:) in B3:B6 indicates a cell range in column B, rows
3 through 6. The parentheses are required to separate the argument from the function.
Copy a formula
Sometimes it's easier to copy formulas than to create new ones. In this example, you'll see how to
copy the formula you used to get the January total and use it to add up the February expenses.
11
12. 1. Drag the black cross from the cell containing the formula to the cell where the formula
will be copied, and then release the fill handle.
2. Auto Fill Options button appears but requires no actions.
Cell references
Cell references Refer to values in
A10 the cell in column A and row 10
A10,A20 cell A10 and cell A20
A10:A20 the range of cells in column A and rows 10 through 20
B15:E15 the range of cells in row 15 and columns B through E
A10:E20 the range of cells in columns A through E and rows 10 through 20
Cell references can indicate particular cells or cell ranges in columns and rows.
12
13. You can type cell references directly into cells, or you can enter cell references by clicking cells,
which avoids typing errors.
In the first lesson you saw how to use the SUM function to add all the values in a column. You
could also use the SUM function to add just a few values in a column, by selecting the cell
references to include.
Imagine that you want to know the combined cost for video rentals and CDs in February. You
don't need to store the total, so you could enter the formula in an empty cell and delete it later.
The example uses cell C9.
The example shows you how to enter the formula. You would click the cells you want to include
in the formula instead of typing the cell references. A color marquee surrounds each cell as it is
selected and disappears when you press ENTER to display the result 45.94. The formula
=SUM(C4,C6) appears in the formula bar near the top of the worksheet whenever cell C9 is
selected.
The arguments C4 and C6 tell the SUM function what values to calculate with. The parentheses
are required to separate the arguments from the function. The comma, which is also required,
separates the arguments.
Simplify using formulas with functions
Function name Calculates
AVERAGE An average
MAX The maximum number
MIN The minimum number
13
14. SUM is just one of the many Excel functions. These prewritten formulas simplify the process of
entering calculations. Using functions, you can easily and quickly create formulas that might be
difficult to build.
To find the average of a range, click in cell D7, and then:
1. On the Home tab, in the Editing group, click the arrow on the Sum button , and
then click Average in the list.
2. Press ENTER to display the result in cell D7.
14
15. To find the largest value in a range, click in cell F7 and then:
1. On the Home tab, in the Editing group, click the arrow on the Sum button, and then
click Max in the list.
2. Press ENTER to display the result in cell F7.
Print formulas
You can print formulas and put them up on your bulletin board to remind you how to create
them.
To print formulas, you need to display formulas on the worksheet:
• Click the Formulas tab, and in the Formula Auditing group, clicking Show Formulas
Button image.
• Then click the Microsoft Office Button in the upper left, and click Print.
Tips:
• Hide the formulas on the worksheet by repeating the step to display them.
• You can also press CTRL+` (the ` key is next to the 1 key on most keyboards) to display
and hide formulas.
• Displaying formulas can also help you spot errors.
15