Introduction to Microsoft Excel basics | Excel Intro | Excel | Excel for starters
14 likes6,651 views

This document serves as an introduction to Microsoft Excel, detailing its features such as calculation, graphing tools, and the Excel ribbon functionalities. It explains how to navigate the spreadsheet grid, enter and edit data, and apply formatting options like font style, size, color, and data alignment. Additionally, it covers number formatting and saving workbooks in the Excel environment.


Introduction to Microsoft Excel basics | Excel Intro | Excel | Excel for starters
- 1. CORP-SKOOL Introduction to Microsoft Excel CORP-SKOOL , 2nd Floor Basude Towers, Opp Punjab Restaurant, Super market, Gulbarga Page 1 CORP-SKOOL Building managers.. Introduction to Microsoft Excel
- 2. CORP-SKOOL Introduction to Microsoft Excel CORP-SKOOL , 2nd Floor Basude Towers, Opp Punjab Restaurant, Super market, Gulbarga Page 2 Contents 1. Introduction to Excel 2. Closer look at excel ribbon 3. Excel Rows and Columns 4. How to Enter Text and Numbers in a Cell 5. How to Edit Text in a Cell 6. Formatting the font (Style, Size and Color) 7. Data Alignment 8. Number formatting 9. Saving the worksheet
- 3. CORP-SKOOL Introduction to Microsoft Excel CORP-SKOOL , 2nd Floor Basude Towers, Opp Punjab Restaurant, Super market, Gulbarga Page 3 1. Introduction to excel Microsoft Excel is a spreadsheet application developed by Microsoft for Microsoft Windows and Mac OS. It features calculation, graphing tools, pivot tables, and a macro programming language called Visual Basic for Applications. Microsoft Excel has the basic features of all spreadsheets, using a grid of cells arranged in numbered rows and letter-named columns to organize data manipulations like arithmetic operations. It has a battery of supplied functions to answer statistical, engineering and financial needs. In addition, it can display data as line graphs, histograms and charts, and with a very limited three-dimensional graphical display. Versions of excel Microsoft Windows Excel 1.0 was not released for Windows or MS-DOS. As a result, Excel 2.0 for Windows is the first version of Excel for Intel platform. Excel 2.0 (1987) Excel 3.0 (1990) Excel 4.0 (1992) Excel 5.0 (1993) Excel 95 (v7.0) Excel 97 (v8.0) Excel 2000 (v9.0) Excel 2002 (v10.0) Excel 2003 (v11.0) Excel 2007 (v12.0) Excel 2010 (v14.0) Excel 2013 (v15.0)
- 4. CORP-SKOOL Introduction to Microsoft Excel CORP-SKOOL , 2nd Floor Basude Towers, Opp Punjab Restaurant, Super market, Gulbarga Page 4 2. Closer look at excel ribbon In the top left side of the Ribbon there's a big circle with windows logo. Click on this, and you'll see all the file operations: Close, Open, New, Exit, etc:
- 5. CORP-SKOOL Introduction to Microsoft Excel CORP-SKOOL , 2nd Floor Basude Towers, Opp Punjab Restaurant, Super market, Gulbarga Page 5 We'll go through all these later, along with the various options on the Ribbon. But the best place to start with Excel is with all those numbers and letters on the grid. These are the referenced as Rows and columns. 3. Excel Rows and Columns Spreadsheets are displayed in a grid layout. The letters across the top header are Column headings. To highlight an entire Column, click on any of the letters. The image below shows the B Column highlighted:
- 6. CORP-SKOOL Introduction to Microsoft Excel CORP-SKOOL , 2nd Floor Basude Towers, Opp Punjab Restaurant, Super market, Gulbarga Page 6 If you look down the left side of the grid, you'll see numbers, which start at number 1 at the very top and go down to over a million. (The exact number of rows and columns are 1,048,576 rows and XFD which is 16,384 columns. You've never going to need this many!) You can click a number to highlight an entire Row. If you look at the image below, you'll see that Row 5 has been highlighted. Spreadsheets are all about individual cells. A Cell is a letter combined with a number. So if you combine the B column with Row 5, you get Cell B5. Combine Column D with Row 5 and you get Cell D5. To see this for yourself, click inside any of the cells on your spreadsheet. In the Images below, we have clicked inside cell A1 and cell C3. The first picture is Column A, Row 1 (A1), and the second picture is Column C Row 3 (C3). Notice that the cells we clicked on have a black border around them. This tells you the cell is active. The cell that is active will have its Column letter and Row number displayed in the top left, just above the letters A and B in the pictures. When you click into a cell, you can then type text and numbers. To move around the spreadsheet, and make other cells active, you can either just click inside a Cell, or press the arrow keys on your keyboard. Click inside a Cell and notice the Cell reference appear above the letters A and B. Press your arrow keys and notice how the active cells moves. Before going any further, make sure you understand how the spreadsheet grid works. If you are asked to locate Cell H2, you should be able to do so.
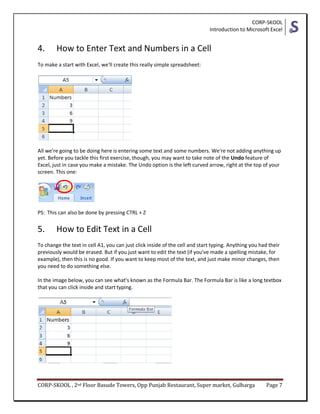
- 7. CORP-SKOOL Introduction to Microsoft Excel CORP-SKOOL , 2nd Floor Basude Towers, Opp Punjab Restaurant, Super market, Gulbarga Page 7 4. How to Enter Text and Numbers in a Cell To make a start with Excel, we'll create this really simple spreadsheet: All we're going to be doing here is entering some text and some numbers. We're not adding anything up yet. Before you tackle this first exercise, though, you may want to take note of the Undo feature of Excel, just in case you make a mistake. The Undo option is the left curved arrow, right at the top of your screen. This one: PS: This can also be done by pressing CTRL + Z 5. How to Edit Text in a Cell To change the text in cell A1, you can just click inside of the cell and start typing. Anything you had their previously would be erased. But if you just want to edit the text (if you've made a spelling mistake, for example), then this is no good. If you want to keep most of the text, and just make minor changes, then you need to do something else. In the image below, you can see what's known as the Formula Bar. The Formula Bar is like a long textbox that you can click inside and start typing.
- 8. CORP-SKOOL Introduction to Microsoft Excel CORP-SKOOL , 2nd Floor Basude Towers, Opp Punjab Restaurant, Super market, Gulbarga Page 8 To edit a Cell in Excel, first click inside the cell you want to edit (A1 for us). Then click inside the formula bar. Notice where your cursor is now: PS: Short cut is “F2” key The image above shows that the cell A1 is active, but the cursor is inside of the formula bar. With the cursor in the Formula Bar, try changing the text "Numbers" to "Add these Numbers". Press the Enter key when you've made the changes. Your spreadsheet should look like ours below: Notice that the active cell is now A2, and that the Formula Bar has a 3 in it. However, there's a problem. There's not enough room in cell A1 for our new text. Part of it seems to be in the B column. The solution is to widen the whole of Column A. Try this: • Move your mouse up to the start of the A Column • The pointer will change shape and now be a black arrow
- 9. CORP-SKOOL Introduction to Microsoft Excel CORP-SKOOL , 2nd Floor Basude Towers, Opp Punjab Restaurant, Super market, Gulbarga Page 9 • Move your mouse over the line that separates Column A and Column B • Your mouse pointer will change shape again, this time to a cross with arrows • When you see the new shape, hold down your left mouse button • Keep the left mouse button held down, and drag your cross to the right • Once you have all the text in the A column, let go of the left mouse button. The images below show the process in action: Other way of adjusting the text in the cell to fit in is double click on the column line to auto fit. This method takes the cell with maximum characters and adjusts the rest accordingly. The cell A5 has the maximum width, so double clicking on the column line the cell width is adjusted as per cell A5
- 10. CORP-SKOOL Introduction to Microsoft Excel CORP-SKOOL , 2nd Floor Basude Towers, Opp Punjab Restaurant, Super market, Gulbarga Page 10 6. Formatting the font (Style, Size and Color) FONT STYLE Excel has a much wider range of formatting options than previous versions, and it's relatively easy to turn a dull spreadsheet into something that really shines. We'll start with changing the font. Choosing a Font in Excel You can pick a different font for the data you enter into cells, as well as choosing the size you want. The color of the font, and the cell background, can be changed, too. In Excel, Themes have been introduced, so that you can format your spreadsheets more easily. You'll meet these later. First, we'll see how to change the font type. • Highlight cell A1 on your spreadsheet by simply clicking into it • Locate the Font panel on the Excel Ribbon at the top of the page: The font in the panel above is set to Calibri by default. To see more fonts, click the black down arrow:
- 11. CORP-SKOOL Introduction to Microsoft Excel CORP-SKOOL , 2nd Floor Basude Towers, Opp Punjab Restaurant, Super market, Gulbarga Page 11 The good things about Excel is that when you move your mouse over one of the fonts on the list, the text in your selected cell (A1) will change automatically. This is just a preview, though. When you have decided on the font you want, click it with the left mouse button. FONT SIZE You can change the size of the font in the same way - just choose a new font size from the list of numbers in the drop down box. If you want to change the font via the Format Cells dialogue box, as you did in previous versions of Excel, you can click the small arrow in the bottom right of the Font panel (the one circled below): When you click the arrow, you'll see the Format Cells dialogue box. You can choose various options from this dialogue box: Font size, style, size, etc. The dialogue box looks like this:
- 12. CORP-SKOOL Introduction to Microsoft Excel CORP-SKOOL , 2nd Floor Basude Towers, Opp Punjab Restaurant, Super market, Gulbarga Page 12 You can also set the font color from here, and add text effects. Click OK when you have made your choices. When you have changed the font and font size, your A1 cell might look something like this:
- 13. CORP-SKOOL Introduction to Microsoft Excel CORP-SKOOL , 2nd Floor Basude Towers, Opp Punjab Restaurant, Super market, Gulbarga Page 13 FONT COLOR Change the Background Color of a Cell To change the background color of cells in Excel, you first have to highlight the ones you want to alter. We'll start with the cells A2 to A5. So highlight these cells on your spreadsheet. With the cells A2 to A5 highlighted, locate the Font panel on the Ribbon at the top of the Excel Locate the Paint Bucket, and click the arrow just to the right of it. You'll see some colors appear: Move your mouse over any of the colors and the cells will change automatically. You can then see what the new color looks like. Click with the left mouse button to set the color you want. If you don't like any of the colors displayed, click on "More Colors". Once you have the number cells formatted in a different color, click on the cell A1. Now do exactly the same thing, only this time chooses a contrasting color for the background of this cell. Your spreadsheet should then look something like the one below.
- 14. CORP-SKOOL Introduction to Microsoft Excel CORP-SKOOL , 2nd Floor Basude Towers, Opp Punjab Restaurant, Super market, Gulbarga Page 14 Change the text color To change the color of the text itself, click the down arrow just to the right of the letter A, which is just to the right of the Paint Bucket on the Font panel. Select a color just like you did for the background color of the cell. Here's what your spreadsheet might look like with the background cell color changes, and the text color: 7. Data alignment By clicking inside of a cell it makes it active, so that you can make changes. We want to centre all our numbers and the text. Here's the spreadsheet we have: So we need cells A1, A2, A3 and A4 to be active. In Excel, you can do this by highlighting thecells.
- 15. CORP-SKOOL Introduction to Microsoft Excel CORP-SKOOL , 2nd Floor Basude Towers, Opp Punjab Restaurant, Super market, Gulbarga Page 15 Place your mouse over cell A1 Your pointer should now be in the shape of a white cross When your pointer changes to the white cross, hold your left mouse button down and drag to cell A4 Let go of the left mouse button when cells A1, A2, A3 and A4 are highlighted The image below shows what you are aiming for The cells highlighted in the image above have a different color to the normal white color of a cell. When you highlight cells, you can do things to all the cells as a group. To centre the text and numbers in our highlighted cells, try this: From the Excel Ribbon at the top of the screen, locate the Alignment panel: You can see the various alignment options laid out. These ones: Hold your mouse over each alignment icon and you'll see an explanation of what they do. Click each icon and see what they do to your highlighted cells. You can also click the arrow in the bottom right of the Alignment panel to bring up the Format Cells box (the one circled below).
- 16. CORP-SKOOL Introduction to Microsoft Excel CORP-SKOOL , 2nd Floor Basude Towers, Opp Punjab Restaurant, Super market, Gulbarga Page 16 When you click the arrow, you'll see this dialogue box: Notice the Text Alignment section at the top of the Alignment tab. It has two drop down menus, one for Horizontal alignment and one for Vertical alignment. Click the arrow on the Horizontal drop down menu, the one with Left (Indent) on it You'll see the following:
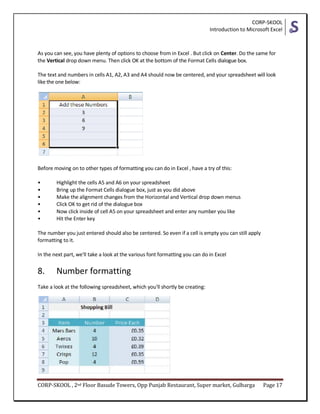
- 17. CORP-SKOOL Introduction to Microsoft Excel CORP-SKOOL , 2nd Floor Basude Towers, Opp Punjab Restaurant, Super market, Gulbarga Page 17 As you can see, you have plenty of options to choose from in Excel . But click on Center. Do the same for the Vertical drop down menu. Then click OK at the bottom of the Format Cells dialogue box. The text and numbers in cells A1, A2, A3 and A4 should now be centered, and your spreadsheet will look like the one below: Before moving on to other types of formatting you can do in Excel , have a try of this: • Highlight the cells A5 and A6 on your spreadsheet • Bring up the Format Cells dialogue box, just as you did above • Make the alignment changes from the Horizontal and Vertical drop down menus • Click OK to get rid of the dialogue box • Now click inside of cell A5 on your spreadsheet and enter any number you like • Hit the Enter key The number you just entered should also be centered. So even if a cell is empty you can still apply formatting to it. In the next part, we'll take a look at the various font formatting you can do in Excel 8. Number formatting Take a look at the following spreadsheet, which you'll shortly be creating:
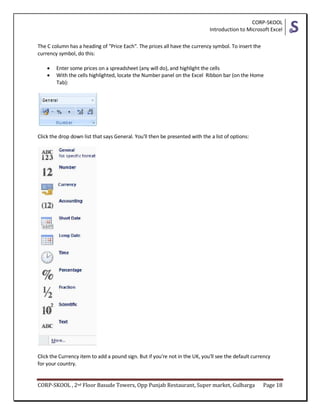
- 18. CORP-SKOOL Introduction to Microsoft Excel CORP-SKOOL , 2nd Floor Basude Towers, Opp Punjab Restaurant, Super market, Gulbarga Page 18 The C column has a heading of "Price Each". The prices all have the currency symbol. To insert the currency symbol, do this: Enter some prices on a spreadsheet (any will do), and highlight the cells With the cells highlighted, locate the Number panel on the Excel Ribbon bar (on the Home Tab): Click the drop down list that says General. You'll then be presented with the a list of options: Click the Currency item to add a pound sign. But if you're not in the UK, you'll see the default currency for your country.
- 19. CORP-SKOOL Introduction to Microsoft Excel CORP-SKOOL , 2nd Floor Basude Towers, Opp Punjab Restaurant, Super market, Gulbarga Page 19 To see other currencies, click on More. The Format Cells dialogue box appears. In the Category list, click on currency. Select a Currency sign from the Symbol list. The dialogue box will then look like this: Click OK to set the pound sign as the currency. 9. Saving the worksheet Now that your spreadsheet is coming along nicely, you'll want to save your work. To save your spreadsheet using Excel, do the following. • Click on circular File button in the very top left of Excel. This one: When you click the File button, you'll see the File Operations dialogue box appear:
- 20. CORP-SKOOL Introduction to Microsoft Excel CORP-SKOOL , 2nd Floor Basude Towers, Opp Punjab Restaurant, Super market, Gulbarga Page 20 The File button used to be a file menu in previous versions of Excel. In Excel, you perform all the File operations by clicking the button. Clicking Close, for example, will close the current Excel spreadsheet, but won't close down Excel itself. To close down Excel, click the "Exit Excel" button in the bottom right of this dialogue box. If you want to open a recent Excel document, click its name under the Recent Documents heading. But to save your work, click the Save option. You will then see another dialogue box appear - Save As:
- 21. CORP-SKOOL Introduction to Microsoft Excel CORP-SKOOL , 2nd Floor Basude Towers, Opp Punjab Restaurant, Super market, Gulbarga Page 21 At the top of the dialogue box, you'll see this: Save in means "Where would you like to save your spreadsheet?" In the image above, we're saving it to a folder called excel. Notice the blue down-pointing arrow on the Save in drop down list. Click the arrow to reveal more locations:
- 22. CORP-SKOOL Introduction to Microsoft Excel CORP-SKOOL , 2nd Floor Basude Towers, Opp Punjab Restaurant, Super market, Gulbarga Page 22 Choose a new location from the list, if you prefer. The large white rectangle on the Save as dialogue box will then show you all the files already in the location. When you're happy with your file location, type a name for your file in the area at the bottom of the dialogue box: Notice the "Save as Type" box below the file name. The type is a XLSX file, and this is new to Excel. The old ending was XLS. Excel can open older XLS files, but previous versions of Excel will struggle to open XLSX files. Remember to save you work on a regular basis, by clicking the round File Operation button in the top left, and then the Save option. A quicker way is to just click the disk icon on the Ribbon:
- 23. CORP-SKOOL Introduction to Microsoft Excel CORP-SKOOL , 2nd Floor Basude Towers, Opp Punjab Restaurant, Super market, Gulbarga Page 23 CORP-SKOOL Building managers.. #144,2nd Floor Basude Towers, Laxmi Silks Building, Opp Punjab Restaurant, Super market, Gulbarga 585101 PH: 8095735672 & 9538599102 www.corpskool.com