Introduction to Monitoring Tools for DevOps
Download as PPTX, PDF0 likes27 views

Introduction to Monitoring Tools for DevOps


Ad
More Related Content
Similar to Introduction to Monitoring Tools for DevOps (20)
More from Puneet Kumar Bhatia (MBA, ITIL V3 Certified) (20)


Ad
Recently uploaded (20)


Ad
Introduction to Monitoring Tools for DevOps
- 1. Continuous Monitoring Continuous Monitoring is all about the ability of an organization to detect, report, respond, contain and mitigate the attacks that occur, in its infrastructure.
- 2. Type of Monitoring Depending on how complicated your monitoring needs are, there are many different services available that can help you monitor you applications at various levels. Some of commonly used monitoring activities are. • Real Time Monitoring - Perform real-time continuous monitoring of business processes and data analytics. For example Splunk. • Application Performance Monitoring - To fully manage and monitor the performance of an application. For Example AppDynamics, Scout • Infrastructure Monitoring – SolarWinds, Nagios, Zabbix • Log Monitoring – SumoLogic, Splunk, ELK Stack
- 3. ELK Stack
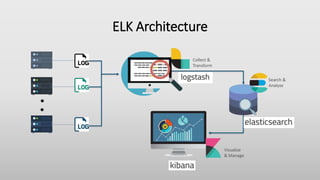
- 4. ELK Stack • Popularly known as ELK Stack has been recently re-branded as Elastic Stack. It is a powerful collection of three open source tools: Elasticsearch, Logstash, and Kibana. • These three different products are most commonly used together for log analysis in different IT environments. Using ELK Stack you can perform centralized logging which helps in identifying the problems with the web servers or applications. It lets you search through all the logs at a single place and identify the issues spanning through multiple servers by correlating their logs within a specific time frame.
- 6. Logstash Logstash is the data collection pipeline tool. It the first component of ELK Stack which collects data inputs and feeds it to the Elasticsearch. It collects various types of data from different sources, all at once and makes it available immediately for further use.
- 7. Elasticsearch Elasticsearch is a NoSQL database which is based on Lucene search engine and is built with RESTful APIs that uses JSON as the data exchange format. It is a highly flexible and distributed search and analytics engine. Also, it provides simple deployment, maximum reliability, and easy management through horizontal scalability. It provides advanced queries to perform detailed analysis and stores all the data centrally for quick search of the documents.
- 8. Kibana Kibana is a data visualization tool. It is used for visualizing the Elasticsearch documents and helps the developers to have an immediate insight into it. Kibana dashboard provides various interactive diagrams, geospatial data, timelines, and graphs to visualize the complex queries done using Elasticsearch. Using Kibana you can create and save custom graphs according to your specific needs.
- 9. ELK Configuration… All these three tools are based on JVM and before start installing them, please verify that JDK has been properly configured. Check that standard JDK 1.8 installation, JAVA_HOME and PATH set up is already done. Elasticsearch •Download latest version of Elasticsearch from this download page and unzip it any folder. •Run binelasticsearch.bat from command prompt. •By default, it would start at http://localhost:9200
- 10. ELK Configuration… Kibana •Download the latest distribution from download page and unzip into any folder. •Open config/kibana.yml in an editor and set elasticsearch.url to point at your Elasticsearch instance. In our case as we will use the local instance just uncomment elasticsearch.url: "http://localhost:9200" •Run binkibana.bat from command prompt. •Once started successfully, Kibana will start on default port 5601 and Kibana UI will be available at http://localhost:5601 Logstash •Download the latest distribution from download page and unzip into any folder. •Create one file logstash.conf as per configuration instructions. We will again come to this point during actual demo time for exact configuration. Now run bin/logstash -f logstash.conf to start logstash
- 12. Nagios
- 13. What is Nagios? • Nagios is used for Continuous monitoring of systems, applications, services, and business processes etc in a DevOps culture. In the event of a failure, Nagios can alert technical staff of the problem, allowing them to begin remediation processes before outages affect business processes, end-users, or customers. With Nagios, you don’t have to explain why an unseen infrastructure outage affect your organization’s bottom line.
- 14. Nagios Architecture •Nagios is built on a server/agents architecture. •Usually, on a network, a Nagios server is running on a host, and Plugins interact with local and all the remote hosts that need to be monitored. •These plugins will send information to the Scheduler, which displays that in a GUI.
- 15. Nagios Remote Plugin Executor (NRPE) •The check_nrpe plugin, resides on the local monitoring machine. •The NRPE daemon, runs on the remote Linux/Unix machine. •There is a SSL (Secure Socket Layer) connection between monitoring host and remote host as shown in the diagram above.
- 16. Nagios configuration files • The main configuration file is “nagios.cfg” in etc • cfg_file=contactgroups.cfg • cfg_file=contacts.cfg • cfg_file=dependencies.cfg • cfg_file=escalations.cfg • cfg_file=hostgroups.cfg • cfg_file=hosts.cfg • cfg_file=services.cfg • cfg_file=timeperiods.cfg • These are much like #include statements, allowing you to structure your files.
- 17. Hosts.cfg define host{ use generic-host ; Name of host template host_name server1 ; name of computer alias server1.localdomain ; canonical name address 10.0.0.1 ; ip address check_command check-host-alive ; defined in commands.cfg max_check_attempts 10 ; used when check fails notification_interval 60 ; how long between notification events notification_period 24x7 ; defined in timeperiods.cfg notification_options d,u,r ; }
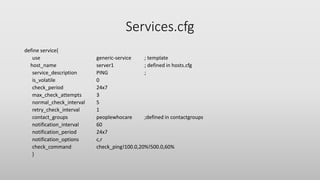
- 18. Services.cfg define service{ use generic-service ; template host_name server1 ; defined in hosts.cfg service_description PING ; is_volatile 0 check_period 24x7 max_check_attempts 3 normal_check_interval 5 retry_check_interval 1 contact_groups peoplewhocare ;defined in contactgroups notification_interval 60 notification_period 24x7 notification_options c,r check_command check_ping!100.0,20%!500.0,60% }
- 19. Nagios Web UI
- 20. Thanks