Introduction to segmentation fault handling
44 likes•35,979 views

The document discusses segmentation faults in Linux, including their definition, examples, and strategies for debugging. It highlights techniques such as using dmesg for initial fault information, compiling with debugging symbols, and analyzing core dumps. The document also introduces the use of objdump to investigate assembly code for diagnosing the causes of segmentation faults.


![Tips to get SegfaultTips to get Segfault
informationinformation (3 of 7)(3 of 7)
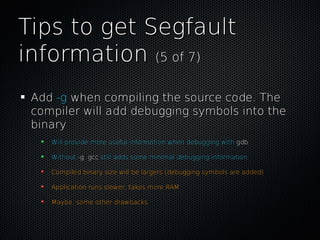
How to readHow to read dmesgdmesg outputs ?outputs ?
S eg fault[19960]: s eg fault at 7fffff7feff8 ip 400480 s p 7fffff7ff000 error 6 in
S eg fault[400000+1000]
Application
name
Reason
it crashed
Address
caused fault
Instruction
Pointer address
Additional
error code
Stack
Pointer address
Other values ???
I DON'T KNOW...](https://image.slidesharecdn.com/introductiontosegmentationfaulthandling-101026020318-phpapp02/85/Introduction-to-segmentation-fault-handling-9-320.jpg)


![Segfault DebuggingSegfault Debugging
TechniquesTechniques
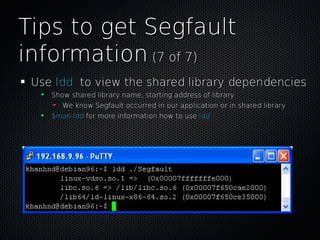
Using gdb – The GNU DebuggerUsing gdb – The GNU Debugger (2 of 6)(2 of 6)
In order to effectively debug program, addIn order to effectively debug program, add -g-g
when compiling withwhen compiling with gccgcc
Load a program into gdb:Load a program into gdb:
$gdb$gdb programprogram
Once you are in gdb, you can run the programOnce you are in gdb, you can run the program
(gdb)(gdb)runrun [parameters to program][parameters to program]
To stop program, pressTo stop program, press Ctrl+CCtrl+C
To quit gdb, execute commandTo quit gdb, execute command qq](https://image.slidesharecdn.com/introductiontosegmentationfaulthandling-101026020318-phpapp02/85/Introduction-to-segmentation-fault-handling-16-320.jpg)


Introduction to segmentation fault handling
- 1. Intro to SegmentationIntro to Segmentation Fault Handling in LinuxFault Handling in Linux By Khanh Ngo-DuyBy Khanh Ngo-Duy [email protected]@elarion.com
- 2. SeminarSeminar What is Segmentation Fault (Segfault)What is Segmentation Fault (Segfault) Examples and ScreenshotsExamples and Screenshots Tips to get Segfault informationTips to get Segfault information Segfault Debugging TechniquesSegfault Debugging Techniques
- 3. What is SegmentationWhat is Segmentation Fault?Fault? Segmentation Fault (Segfault)Segmentation Fault (Segfault) oror accessaccess violationviolation is a particular error condition that canis a particular error condition that can occur during the operation of computeroccur during the operation of computer softwaresoftware A Segfault occurs when a program attempts toA Segfault occurs when a program attempts to access a memory location that is not allowedaccess a memory location that is not allowed to access, or attempts to access a memoryto access, or attempts to access a memory location in a way that is not allowedlocation in a way that is not allowed Write to a read-only locationWrite to a read-only location To overwrite part of the operating system or protected memoryTo overwrite part of the operating system or protected memory locationslocations Access to invalid memory location. e.g : memorry address NULL, -1 . . .Access to invalid memory location. e.g : memorry address NULL, -1 . . . etc . . .etc . . .
- 4. Examples andExamples and ScreenshotsScreenshots (1 of 3)(1 of 3) Write to Read-Only memory address
- 5. Examples andExamples and ScreenshotsScreenshots (2 of 3)(2 of 3) Write to Invalid memory address (NULL = 0x00)
- 6. Examples andExamples and ScreenshotsScreenshots (3 of 3)(3 of 3) Stack overflow
- 7. Tips to get SegfaultTips to get Segfault informationinformation (1 of 7)(1 of 7) Generally, when Segfault occurs, very lessGenerally, when Segfault occurs, very less information is provided (see previous slides)information is provided (see previous slides) • →→ Very hard to debugVery hard to debug
- 8. Tips to get SegfaultTips to get Segfault informationinformation (2 of 7)(2 of 7) UseUse dmesgdmesg to show information that saved byto show information that saved by the Kernel when any application crashesthe Kernel when any application crashes Last Segfault information
- 9. Tips to get SegfaultTips to get Segfault informationinformation (3 of 7)(3 of 7) How to readHow to read dmesgdmesg outputs ?outputs ? S eg fault[19960]: s eg fault at 7fffff7feff8 ip 400480 s p 7fffff7ff000 error 6 in S eg fault[400000+1000] Application name Reason it crashed Address caused fault Instruction Pointer address Additional error code Stack Pointer address Other values ??? I DON'T KNOW...
- 10. Tips to get SegfaultTips to get Segfault informationinformation (4 of 7)(4 of 7) AddAdd -g-g when compiling the source code. Thewhen compiling the source code. The compiler will add debugging symbols into thecompiler will add debugging symbols into the binarybinary Will provide more useful information when debugging with gdbWill provide more useful information when debugging with gdb Compiled binary size will be largers (debugging symbols are added)Compiled binary size will be largers (debugging symbols are added) Application runs slower, takes more RAMApplication runs slower, takes more RAM Maybe, some other drawbacksMaybe, some other drawbacks
- 11. Tips to get SegfaultTips to get Segfault informationinformation (5 of 7)(5 of 7) AddAdd -g-g when compiling the source code. Thewhen compiling the source code. The compiler will add debugging symbols into thecompiler will add debugging symbols into the binarybinary Will provide more useful information when debugging withWill provide more useful information when debugging with gdbgdb WithoutWithout -g-g,, gccgcc still adds some minimal debugging informationstill adds some minimal debugging information Compiled binary size will be largers (debugging symbols are added)Compiled binary size will be largers (debugging symbols are added) Application runs slower, takes more RAMApplication runs slower, takes more RAM Maybe, some other drawbacksMaybe, some other drawbacks
- 12. Tips to get SegfaultTips to get Segfault informationinformation (6 of 7)(6 of 7) UseUse nmnm to view the symbols in the binary fileto view the symbols in the binary file Address of symbol, symbol type, symbol name can be listedAddress of symbol, symbol type, symbol name can be listed Give us chance to know the Segfault occurred with what symbolGive us chance to know the Segfault occurred with what symbol $man nm$man nm for more informationfor more information on the usageon the usage
- 13. Tips to get SegfaultTips to get Segfault informationinformation (7 of 7)(7 of 7) UseUse lddldd to view the shared library dependenciesto view the shared library dependencies Show shared library name, starting address of libraryShow shared library name, starting address of library We know Segfault occurred in our application or in shared libraryWe know Segfault occurred in our application or in shared library $man ldd$man ldd for more information how to usefor more information how to use lddldd
- 14. Segfault DebuggingSegfault Debugging TechniquesTechniques UsingUsing gdbgdb – The GNU Debugger– The GNU Debugger Core dump fileCore dump file andand gdbgdb objdumpobjdump
- 15. Segfault DebuggingSegfault Debugging TechniquesTechniques Using gdb – The GNU DebuggerUsing gdb – The GNU Debugger (1 of 6)(1 of 6) gdbgdb supports:supports: Starting programs , attaching to running programs or debuggingStarting programs , attaching to running programs or debugging crashed programscrashed programs Debugging locally or remotely (viaDebugging locally or remotely (via gdbservergdbserver)) Setting breakpoints and watchpointsSetting breakpoints and watchpoints Examining variables, registers and call stackExamining variables, registers and call stack Changing data and calling functionsChanging data and calling functions Automating debug tasksAutomating debug tasks Multi threaded programsMulti threaded programs
- 16. Segfault DebuggingSegfault Debugging TechniquesTechniques Using gdb – The GNU DebuggerUsing gdb – The GNU Debugger (2 of 6)(2 of 6) In order to effectively debug program, addIn order to effectively debug program, add -g-g when compiling withwhen compiling with gccgcc Load a program into gdb:Load a program into gdb: $gdb$gdb programprogram Once you are in gdb, you can run the programOnce you are in gdb, you can run the program (gdb)(gdb)runrun [parameters to program][parameters to program] To stop program, pressTo stop program, press Ctrl+CCtrl+C To quit gdb, execute commandTo quit gdb, execute command qq
- 17. Segfault DebuggingSegfault Debugging TechniquesTechniques Using gdb – The GNU DebuggerUsing gdb – The GNU Debugger (3 of 6)(3 of 6) ← Step 1: Load the program into gdb ← Step 2: execute the program ← Step 3: Quit from gdb ← gdb detects Segfault but very less info (-g is not add when compiling)
- 18. Segfault DebuggingSegfault Debugging TechniquesTechniques Using gdb – The GNU DebuggerUsing gdb – The GNU Debugger (4 of 6)(4 of 6) ← add -g when compile ← Step 1: Load ← Step 3: Quit from gdb ← gdb detects Segfault, shows the lines which caused Segfault Line 6, in main(), file: Segfault.c ← Step 2: Run
- 19. Segfault DebuggingSegfault Debugging TechniquesTechniques Using gdb – The GNU DebuggerUsing gdb – The GNU Debugger (5 of 6)(5 of 6) Is thisIs this usefuluseful andand easyeasy ?? YES!!!YES!!! ButBut why?why? Because ofBecause of -g-g → we can see the→ we can see the file namefile name,, function namefunction name andand line numberline number Because of the source code is available → can see the exactly line of codeBecause of the source code is available → can see the exactly line of code If there is no source code → we can see the filename, function name, lineIf there is no source code → we can see the filename, function name, line number but NOT contents of the line cause Segfault ← No problem, stillnumber but NOT contents of the line cause Segfault ← No problem, still GOOD! :-)GOOD! :-) Because this situation is simple, sometime you can NOT use thisBecause this situation is simple, sometime you can NOT use this technique! See next...technique! See next...
- 20. Segfault DebuggingSegfault Debugging TechniquesTechniques Using gdb – The GNU DebuggerUsing gdb – The GNU Debugger (6 of 6)(6 of 6) This technique canThis technique can ON LYON LY be used when:be used when: You know for sure, Segfault will occurYou know for sure, Segfault will occur Only when testing. When in production time, you can NOT → gdb causesOnly when testing. When in production time, you can NOT → gdb causes manymany side effectsside effects: slow down the running, running is not stable etc …: slow down the running, running is not stable etc … Even when testing, if application is soEven when testing, if application is so BigBig oror ComplicatedComplicated (many(many threads, many resources)threads, many resources) →→ gdb can not handlegdb can not handle To be able to debug when your application is in production mode and notTo be able to debug when your application is in production mode and not able to reduce the Segfault ? See the next techniques → ....able to reduce the Segfault ? See the next techniques → ....
- 21. Segfault DebuggingSegfault Debugging TechniquesTechniques core dump file and gdbcore dump file and gdb (1 of 5)(1 of 5) A core dump consists of the recorded state ofA core dump consists of the recorded state of the working memory of a computer program atthe working memory of a computer program at a specific time, generally when the programa specific time, generally when the program has terminated abnormally (crashed)has terminated abnormally (crashed) Core dump file might contain: processor registers, which may include theCore dump file might contain: processor registers, which may include the program counter and stack pointer, memory management information, andprogram counter and stack pointer, memory management information, and other processor and operating system flags and informationother processor and operating system flags and information Core dumps are disabled by default on some Linux distributionsCore dumps are disabled by default on some Linux distributions To force the core dump generation, you can using command lineTo force the core dump generation, you can using command line $ulimit$ulimit -c <limit size of core file>-c <limit size of core file> To force the core dump generation, you can also insert code to yourTo force the core dump generation, you can also insert code to your application to request generating the core dump when it crashesapplication to request generating the core dump when it crashes To disable the core dump just setTo disable the core dump just set <limit size of core file><limit size of core file> toto 00
- 22. Segfault DebuggingSegfault Debugging TechniquesTechniques core dump file and gdbcore dump file and gdb (2 of 5)(2 of 5) ← Enable core dump, limit to 1024 MB, just once ← core file is generated when app crashes ← It is here!
- 23. Segfault DebuggingSegfault Debugging TechniquesTechniques core dump file and gdbcore dump file and gdb (3 of 5)(3 of 5) Once you have core dump, what to do ?Once you have core dump, what to do ? →→ Just load it into gdb and seeJust load it into gdb and see $gdb$gdb <application name> <core file name><application name> <core file name>
- 24. Segfault DebuggingSegfault Debugging TechniquesTechniques core dump file and gdbcore dump file and gdb (4 of 5)(4 of 5) ← Load the application and core file ← gdb reads core file and shows the results as if the Application has just run and crashed, actually core dump just shows the actual HISTORY
- 25. Segfault DebuggingSegfault Debugging TechniquesTechniques core dump file and gdbcore dump file and gdb (5 of 5)(5 of 5) Is this better than the previous technique ?Is this better than the previous technique ? Yes, because I could not reproduce theYes, because I could not reproduce the Segfault, however, core file shows meSegfault, however, core file shows me Though it is good, still some disadvantagesThough it is good, still some disadvantages Core file may grow very large if your application uses much memory, soCore file may grow very large if your application uses much memory, so sometime you simply can not use this methodsometime you simply can not use this method In case of complicated application, thereIn case of complicated application, there might be some side effectsmight be some side effects whenwhen forcing core dump → your application might run unstableforcing core dump → your application might run unstable What I read till now, justWhat I read till now, just s ide effec tss ide effec ts .. Is there anyIs there any else? I don't want to risk the production system! →else? I don't want to risk the production system! → YES. There is, see the last techniques ..YES. There is, see the last techniques ....
- 26. Segfault DebuggingSegfault Debugging TechniquesTechniques objdumpobjdump (1 of 9)(1 of 9) AdvantagesAdvantages No need to addNo need to add -g-g → do not affect the memory and reduce the size of binary→ do not affect the memory and reduce the size of binary filefile No need to generating core dump → no side effects, do not take disk spaceNo need to generating core dump → no side effects, do not take disk space Actually, you do not need to do anything, what will come will come, and youActually, you do not need to do anything, what will come will come, and you will solve it!will solve it! Disadvantages ?Disadvantages ? You need a little knowledge aboutYou need a little knowledge about assemblyassembly language :-) → don't be scare, stilllanguage :-) → don't be scare, still easy!easy! If adding optimization flag toIf adding optimization flag to gccgcc ((-O-O,, -O2-O2,, -O3-O3) it will be a little hard you to) it will be a little hard you to read assembly code laterread assembly code later
- 27. Segfault DebuggingSegfault Debugging TechniquesTechniques objdumpobjdump (2 of 9)(2 of 9) First of all, what you need is the output of dmesgFirst of all, what you need is the output of dmesg (very first slide told you).(very first slide told you). Note theNote the “Address caused fault”“Address caused fault” andand “Instruction pointer address”“Instruction pointer address” Use the tool namedUse the tool named objdumpobjdump to generate information from your applicationto generate information from your application Output of objdump should be redirected to a file, we need this file later!Output of objdump should be redirected to a file, we need this file later! $objdump$objdump -DCl <application name> > <output file>-DCl <application name> > <output file>
- 28. Segfault DebuggingSegfault Debugging TechniquesTechniques objdumpobjdump (3 of 9)(3 of 9)
- 29. Segfault DebuggingSegfault Debugging TechniquesTechniques objdumpobjdump (4 of 9)(4 of 9) OK, so my fault address isOK, so my fault address is 0x40058c0x40058c andand instruction pointer isinstruction pointer is 0x40048c0x40048c myDumpmyDump contains the assembly code of my appcontains the assembly code of my app Now I will see at what line of code, my appNow I will see at what line of code, my app crashed → just find where iscrashed → just find where is 0x40048c0x40048c inin myDumpmyDump $grep$grep -n -A 100 -B 100 “40048c” ./myDump-n -A 100 -B 100 “40048c” ./myDump What it does it just find the line having 40048c in ./myDump, and also showWhat it does it just find the line having 40048c in ./myDump, and also show 100 more lines after the found line, and 100 lines before the found line. You100 more lines after the found line, and 100 lines before the found line. You can customize the grep command as you want ;)can customize the grep command as you want ;)
- 30. Segfault DebuggingSegfault Debugging TechniquesTechniques objdumpobjdump (5 of 9)(5 of 9) ← Step 1: Find instruction pointer address ← Step 2: Found, This caused segfault ← Step 3: Look above to see the code that caused segfault in what function? Here it is in main()
- 31. Segfault DebuggingSegfault Debugging TechniquesTechniques objdumpobjdump (6 of 9)(6 of 9) Now you know the code that cause Segfault inNow you know the code that cause Segfault in assemblyassembly.. What to do is open your source code (in C, C++What to do is open your source code (in C, C++ …) to see the appropriate line of code…) to see the appropriate line of code corresponding to that Assembly code, you willcorresponding to that Assembly code, you will figure out what caused Segfault :-)figure out what caused Segfault :-)
- 32. Segfault DebuggingSegfault Debugging TechniquesTechniques objdumpobjdump (7 of 9)(7 of 9) 0x48 = 'H'
- 33. Segfault DebuggingSegfault Debugging TechniquesTechniques objdumpobjdump (8 of 9)(8 of 9) You are done now! Bravo !!!You are done now! Bravo !!! Just with “Just with “Instruction PointerInstruction Pointer””, you know where, you know where caused Segfault exactlycaused Segfault exactly How about the “How about the “Address caused faultAddress caused fault”” ((0x40058c0x40058c), we have not used it, haven't we?), we have not used it, haven't we? No we don't. BUT, till now I can say the line caused Segfault isNo we don't. BUT, till now I can say the line caused Segfault is *s = 'H';*s = 'H'; And, the address of variableAnd, the address of variable ss at that time is 0x40058cat that time is 0x40058c Meaningless to know this?Meaningless to know this? NO! There is sometime you will need it to knowNO! There is sometime you will need it to know the root cause, see the next slidethe root cause, see the next slide
- 34. Segfault DebuggingSegfault Debugging TechniquesTechniques objdumpobjdump (9 of 9)(9 of 9) Sometimes, the “Sometimes, the “Address caused faultAddress caused fault” tell you” tell you the root cause. See the following example, wethe root cause. See the following example, we can say that, value ofcan say that, value of ss isis N U LLN U LL
- 35. Thanks for watchingThanks for watchingIf you see it useful → clap your hands :-)If you see it useful → clap your hands :-)