Introduction to statistics...ppt rahul
Download as ppsx, pdf199 likes150,153 views

This document provides an introduction to statistics and biostatistics. It discusses key concepts including: - The definitions and origins of statistics and biostatistics. Biostatistics applies statistical methods to biological and medical data. - The four main scales of measurement: nominal, ordinal, interval, and ratio scales. Nominal scales classify data into categories while ratio scales allow for comparisons of magnitudes and ratios. - Descriptive statistics which organize and summarize data through methods like frequency distributions, measures of central tendency, and graphs. Frequency distributions condense data into tables and charts. Measures of central tendency include the mean, median, and mode.


Introduction to statistics...ppt rahul
- 2. INTRODUCTION The word statistics conveys a variety of meaning to people in different walks of life. 2R Dh@ker, Lecturer, PCNMS The word statistics comes from the Italian words Statista ( Statement).
- 3. CONT…INTRODUCTION The German word Statistik 3 RDh@ker,Lecturer,PCNMS Political state The word Statistics today refers to either quantitative information or a method of delaling with quantitative or qualitative information.
- 4. DEFINITION “Statistics is defined as collection, Presentation, analysis and interpretation of numerical data”. Acc. Croxton & cowden 4 RDh@ker,Lecturer,PCNMS statistics is the sciences and art of dealing with figure and facts.
- 5. Biostatistics is the branch of statistics applied to biological or medical sciences. Biostatistics is the methods used in dealing with statistics in the field of health sciences such as biology, medicine, nursing, public health etc. 5 RDh@ker,Lecturer,PCNMS
- 6. Biostatistics is the branch of statistics applied to biology or medical sciences. Biostatistics is also called “Biometry” 6 RDh@ker,Lecturer,PCNMS In Greek, Bios Life Metron So, it is measurement of life Measured
- 7. USE & APPLICATION OF STATISTICS It facilitates comparisons It simplifies the message of figure It helps in formulating and testing hypothesis It help in prediction 7 RDh@ker,Lecturer,PCNMS
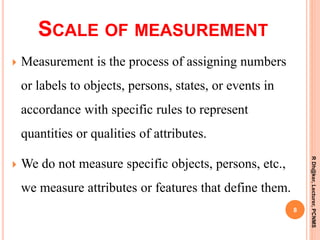
- 8. SCALE OF MEASUREMENT Measurement is the process of assigning numbers or labels to objects, persons, states, or events in accordance with specific rules to represent quantities or qualities of attributes. We do not measure specific objects, persons, etc., we measure attributes or features that define them. 8 RDh@ker,Lecturer,PCNMS
- 9. Nominal Scales Ordinal Scales Interval Scales Ratio Scales FOUR BASIC SCALES OF MEASUREMENT 9 RDh@ker,Lecturer,PCNMS
- 11. There must be distinct classes but these classes have no quantitative properties. Therefore, no comparison can be made in terms of one category being higher than the other. For example - there are two classes for the variable gender - males and females. There are no quantitative properties for this variable or these classes and, therefore, gender is a nominal variable. 11 RDh@ker,Lecturer,PCNMS
- 12. CONT…NOMINAL SCALE Sometimes numbers are used to designate category membership- Example: Country of Origin 1 = United States 3 = Canada 2 = Mexico 4 = Other 12 RDh@ker,Lecturer,PCNMS
- 13. There are distinct classes but these classes have a natural ordering or ranking. The differences can be ordered on the basis of magnitude. For example - final position of horses in a thoroughbred race is an ordinal variable. The horses finish first, second, third, fourth, and so on. The difference between first and second is not necessarily equivalent to the difference between second and third, or between third and fourth. 13 RDh@ker,Lecturer,PCNMS Ordinal Scales
- 14. CONT…ORDINAL SCALES Does not assume that the intervals between numbers are equal Example: finishing place in a race (first place, second place) 1 hour 2 hours 3 hours 4 hours 5 hours 6 hours 7 hours 8 hours 1st place 2nd place 3rd place 4th place 14 RDh@ker,Lecturer,PCNMS
- 15. INTERVAL SCALES It is possible to compare differences in magnitude, but importantly the zero point does not have a natural meaning. It captures the properties of nominal and ordinal scales - used by most psychological tests. Designates an equal-interval ordering - The distance between, for example, a 1 and a 2 is the same as the distance between a 4 and a 5 15 RDh@ker,Lecturer,PCNMS
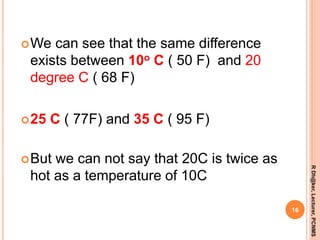
- 16. We can see that the same difference exists between 10o C ( 50 F) and 20 degree C ( 68 F) 25 C ( 77F) and 35 C ( 95 F) But we can not say that 20C is twice as hot as a temperature of 10C 16 RDh@ker,Lecturer,PCNMS
- 17. RDh@ker,Lecturer,PCNMS 17 Example - Celsius temperature is an interval variable. It is meaningful to say that 25 degrees Celsius is 3 degrees hotter than 22 degrees Celsius, and that 17 degrees Celsius is the same amount hotter (3 degrees) than 14 degrees Celsius. Notice, however, that 0 degrees Celsius does not have a natural meaning. That is, 0 degrees Celsius does not mean the absence of heat!
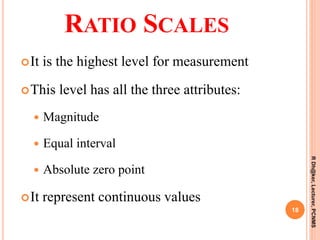
- 18. RATIO SCALES It is the highest level for measurement This level has all the three attributes: Magnitude Equal interval Absolute zero point It represent continuous values 18 RDh@ker,Lecturer,PCNMS
- 19. Example: Biophysical parameters Weight Height Volume Blood pressure 19 RDh@ker,Lecturer,PCNMS
- 20. 30 Kg is thrice of 10 kg 20 cm is twice of 10 cm 8 hours is four time of 2 hours 20 RDh@ker,Lecturer,PCNMS
- 21. TYPES OF MEASUREMENT SCALES (CONT.) Each of these scales have different properties (i.e., difference, magnitude, equal intervals, or a true zero point) and allows for different interpretations. 21 RDh@ker,Lecturer,PCNMS
- 22. The scales are listed in hierarchical order. Nominal scales have the fewest measurement properties and ratio having the most properties including the properties of all the scales beneath it on the hierarchy. 22 RDh@ker,Lecturer,PCNMS TYPES OF MEASUREMENT SCALES (CONT.)
- 23. The goal is to be able to identify the type of measurement scale, and to understand proper use and interpretation of the scale. 23 RDh@ker,Lecturer,PCNMS TYPES OF MEASUREMENT SCALES (CONT.)
- 24. B o b G e n e S a m PRIMARY SCALES OF MEASUREMENT Scale Nominal Symbols Assigned to Runners Ordinal Rank Order of Winners Interval Performance Rating on a 0 to 10 Scale Ratio Time to Finish, in Seconds 3rd place 2nd place 1st place Finish Finish 3 7 9 15.2 14.1 13.4 24 RDh@ker,Lecturer,PCNMS
- 25. 26 RDh@ker,Lecturer,PCNMS Scale Basic Characteristics Common Examples Marketing Examples Nominal Numbers identify & classify objects Social Security nos., numbering of football players Brand nos., store types Ordinal Nos. indicate the relative positions of objects but not the magnitude of differences between them Quality rankings, rankings of teams in a tournament Preference rankings, market position, social class Interval Differences between objects can be compared, zero point is arbitrary Temperature (Fahrenheit) Celsius) Attitudes, opinions, index nos. Ratio Zero point is fixed, ratios of scale values can be compared Length, weight Age, sales, income, costs
- 26. Descriptive statisticsuse to organize and summarize the data to draw meaningful interpretations. Descriptive statisticsdeal with the enumeration, organization and graphical representation of data. R Dh@ker, Lecturer, PCNMS 27
- 27. CONT…DESCRIPTIVE STATISTICS Descriptive statistics includes- Measures to condense data Measures of central tendency Measures of dispersion Measures of relationship ( Correlation coefficient) R Dh@ker, Lecturer, PCNMS 28
- 28. Measures to condense data Frequency and percentage distribution through tabulation and graphic presentation. Table Graphsand diagrams Percentages R Dh@ker, Lecturer, PCNMS 29
- 29. Type Frequency distributiontable Contingency table MultipleResponsetable Miscellaneoustable R Dh@ker, Lecturer, PCNMS 30
- 30. FREQUENCY DISTRIBUTION TABLE The data may be qualitative or quantitative 31 RDh@ker,Lecturer,PCNMS
- 31. The following are the weight in kg 48 medical students. Construct the frequency distribution table 50, 61, 70 71 63 34 75 80 45 56 57 58 60 62 72 78 48 50 63 64 67 52 52 54 55 56 57 70 71 72 73 64 65 66 67 62 63 65 52 60 54 56 58 57 61 81 82 80 32 RDh@ker,Lecturer,PCNMS
- 32. RELATIVE FREQUENCY Relative frequency = Class frequency --------------------------- Total frequency 33 RDh@ker,Lecturer,PCNMS
- 33. FREQUENCY DENSITY OF A CLASS Frequency density of a class= frequency of the class ------------------------------- width of the class 34 RDh@ker,Lecturer,PCNMS
- 34. 105 100 109 106 122 103 122 107 102 105 103 100 119 116 120 122 115 119 118 109 103 108 106 107 104 103 105 102 106 103 109 114 122 114 100 116 115 110 120 100 117 120 107 116 119 122 122 107 106 117 35 RDh@ker,Lecturer,PCNMS
- 35. 138 164 150 132 144 125 149 157 146 158 140 109 136 148 152 144 168 126 138 186 163 109 154 165 146 183 105 108 135 153 140 135 161 145 135 142 150 156 145 128 36 RDh@ker,Lecturer,PCNMS
- 36. Type Bar diagram Pie chart Histogram Frequency polygon Line diagram R Dh@ker, Lecturer, PCNMS 37 Cumulative frequency curve Scattered diagram Pictograms Map diagrams
- 37. CONT…GRAPHS AND DIAGRAMS Presentation of quantitative, continuous or measured data is through graphs. The common graphs in use are:- Histogram Frequency polygon Frequency curve Line chart or graph Cumulative frequency diagram Scatter or dot diagram R Dh@ker, Lecturer, PCNMS 38
- 38. Presentation of qualitative , discrete or counted data is through diagrams. The common diagrams in use are:- Bar diagram Pie diagram Pictogram diagram Map diagram or spot map R Dh@ker, Lecturer, PCNMS 39 CONT…Graphs and diagrams
- 39. Measures of central tendency Arithmeticmean Median Mode Geometric mean R Dh@ker, Lecturer, PCNMS 40
- 40. MEASUREMENT OF CENTRAL TENDENCY R Dh@ker, Lecturer, PCNMS 41 Sl. no Data level Characteristics Measurement of central tendency 1 Nominal Measured on scale of frequency of categories Mode (Mo) 2 Ordinal Measured on no scale but can be ranked Median (Md) 3 Interval Measured on a scale with no true zero Mean (M) 4 Ratio Measured on a scale with absolute zero Mean (M)