Introduction to the IBM Watson Data Platform
4 likes1,360 views

In this talk that I gave to the SW Data meetup group in Bristol I went through the Watson Data Platform showing various examples using open data.


![@MargrietGr
Cloudant is "schemaless"
{
"_id": "1",
"firstname": "John",
"lastname": "Smith",
"dob": "1970-01-01",
"email": "john.smith@gmail.com",
"confirmed": true,
"tags": ["tall", "glasses"]
}](https://image.slidesharecdn.com/170227watsonopendata-170228171041/85/Introduction-to-the-IBM-Watson-Data-Platform-24-320.jpg)
![@MargrietGr
Cloudant is "schemaless"
{
"_id": "1",
"firstname": "John",
"lastname": "Smith",
"dob": "1970-01-01",
"email": "john.smith@gmail.com",
"confirmed": true,
"tags": ["tall", "glasses"],
"address" : {
"number": 14,
"street": "Front Street",
"town": "Luton",
"postcode": "LU1 1AB"
}
}](https://image.slidesharecdn.com/170227watsonopendata-170228171041/85/Introduction-to-the-IBM-Watson-Data-Platform-25-320.jpg)


Ad
More Related Content
What's hot (20)
Viewers also liked (20)


Ad
Similar to Introduction to the IBM Watson Data Platform (20)


Ad
More from Margriet Groenendijk (18)


Recently uploaded (20)


Introduction to the IBM Watson Data Platform
- 1. IBM Watson Data Platform and Open Data 27 February 2017 Margriet Groenendijk | Developer Advocate | IBM Watson Data Platform @MargrietGr https://medium.com/ibm-watson-data-lab
- 2. @MargrietGr About me Developer Advocate, Data scientist Previous Research Fellow at University of Exeter, UK PhD at VU University Amsterdam, the Netherlands
- 3. @MargrietGr IBM Watson Data Platform Connect Discover Accelerate
- 4. @MargrietGr IBM Watson Data Platform
- 9. @MargrietGr
- 10. @MargrietGr
- 11. @MargrietGr
- 12. @MargrietGr
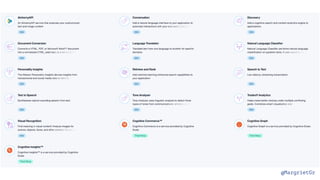
- 13. @MargrietGr APIs
- 18. @MargrietGr Example : Watson Tone Analyser
- 19. @MargrietGr Emotion Language style Social propensities Analyze how you are coming across to others
- 20. Cloudant NoSQL
- 21. @MargrietGr Cloudant is a database id firstname lastname dob 1 John Smith 1970-01-01 2 Kate Jones 1971-12-25 { "_id": "1", "firstname": "John", "lastname": "Smith", "dob": "1970-01-01" }
- 22. @MargrietGr Cloudant is "schemaless" { "_id": "1", "firstname": "John", "lastname": "Smith", "dob": "1970-01-01", "email": "[email protected]" }
- 23. @MargrietGr Cloudant is "schemaless" { "_id": "1", "firstname": "John", "lastname": "Smith", "dob": "1970-01-01", "email": "[email protected]", "confirmed": true }
- 24. @MargrietGr Cloudant is "schemaless" { "_id": "1", "firstname": "John", "lastname": "Smith", "dob": "1970-01-01", "email": "[email protected]", "confirmed": true, "tags": ["tall", "glasses"] }
- 25. @MargrietGr Cloudant is "schemaless" { "_id": "1", "firstname": "John", "lastname": "Smith", "dob": "1970-01-01", "email": "[email protected]", "confirmed": true, "tags": ["tall", "glasses"], "address" : { "number": 14, "street": "Front Street", "town": "Luton", "postcode": "LU1 1AB" } }
- 26. @MargrietGr Cloudant is built for the web ▪Store JSON Documents ▪Speaks an HTTP API ▪Lives on the web
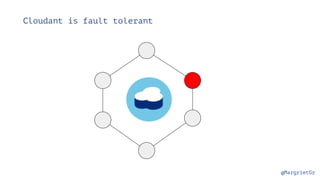
- 27. @MargrietGr Cloudant is fault tolerant
- 28. @MargrietGr Cloudant is fault tolerant
- 37. @MargrietGr
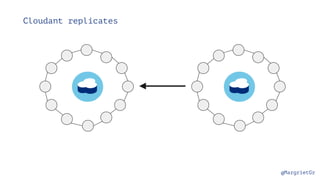
- 38. @MargrietGr Open Street Map Data IBM Cloudant Use from anywhere! Daily updates VM daily cron Python script Always up to date! Currently 12,467,460 POIs
- 39. @MargrietGr wget -c http://download.geofabrik.de/europe/netherlands- latest.osm.pbf Several data sources - world, continent, country, city or a user defined box Several data formats for which free to use conversion tools exist - pbf, osm, json, shp Example:
- 40. @MargrietGr Extract the POIs with osmosis osmosis --read-pbf netherlands-latest.osm.pbf --tf accept-nodes aerialway=station aeroway=aerodrome,helipad,heliport amenity=* craft=* emergency=* highway=bus_stop,rest_area,services historic=* leisure=* office=* public_transport=stop_position,stop_area shop=* tourism=* --tf reject-ways --tf reject-relations --write-xml netherlands.nodes.osm (easy to install with brew on Mac)
- 41. @MargrietGr Some cleaning up with osmconvert Convert from osm to json format with ogr2ogr osmconvert $netherlands.nodes.osm --drop-ways --drop-author --drop-relations --drop-versions >$netherlands.poi.osm ogr2ogr -f GeoJSON $netherlands.poi.json $netherlands.poi.osm points
- 42. @MargrietGr Upload to Cloudant with couchimport export COUCH_URL="https:// username:[email protected]" cat $netherlands.poi.json | couchimport --db poi-$netherlands --type json --jsonpath "features.*" https://github.com/glynnbird/couchimport IBM Cloudant
- 44. @MargrietGr
- 45. @MargrietGr UK Crime Data from https://data.police.uk/data/
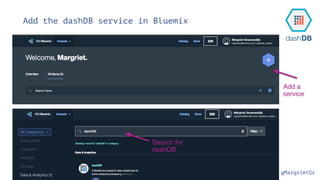
- 49. @MargrietGr Add the dashDB service in Bluemix Add a service Search for dashDB
- 50. @MargrietGr
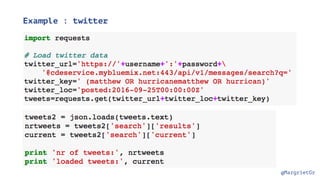
- 51. @MargrietGr 3 1 2 posted:2016-08-01,2016-10-01 followers_count:3000 friends_count: 3000 (weather OR sun OR sunny OR rain OR hail OR storm OR rainy OR drought OR flood OR hurricane OR tornado OR cold OR snow OR drizzle OR cloudy OR thunder OR lightning OR wind OR windy OR heatwave) REST API docs: https://new-console.ng.bluemix.net/docs/ services/Twitter/ twitter_rest_apis.html#rest_apis Search for tweets 4 Select table Use an existing service
- 52. @MargrietGr
- 53. Apache Spark
- 55. @MargrietGr
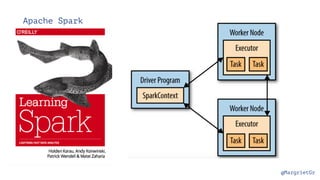
- 56. @MargrietGr RDDs : Resilient Distributed Datasets Data does not have to fit on a single machine Data is separated into partitions Creation of RDDs Load an external dataset Distribute a collection of objects Transformations construct a new RDD from a previous one (lazy!) Actions compute a result based on an RDD
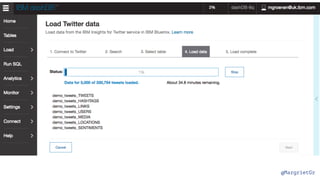
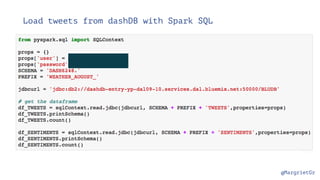
- 57. @MargrietGr Load tweets from dashDB with Spark SQL
- 58. @MargrietGr Clean data, summarise and load into pandas DataFrame
- 61. @MargrietGr
- 62. Getting started ▪ Go to datascience.ibm.com and sign in with your Bluemix account when you have one, else sign up for one at the top right of the screen
- 63. Create a project ▪ Create New project, click on the link in top of the screen ▪ Or go to the My Projects in the menu on the left of the screen and click Create New Project here
- 64. Create a project ▪ Name the Project ▪ Choose a Spark Service ▪ Choose an Object Storage ▪ Click Create
- 65. Add collaborators ▪ Click add collaborator ▪ Search for your project members ▪ Select Permission
- 66. Add a notebook ▪ Click add notebooks
- 67. Add a notebook ▪ Click add notebooks ▪ Pick your favourite: ▪ Python 2 ▪ Scala ▪ R ▪ Choose Spark 1.6 or 2.0 ▪ Click Create Notebook
- 68. Let’s write some code ▪ Click the pen icon to start adding code (edit mode) ▪ When collaborating only one person can edit, others can add comments to the notebook when in view mode
- 69. @MargrietGr Example : Bristol open data
- 73. @MargrietGr IBM Watson Data Platform Bluemix Data storage Apps Watson APIs Weather Data Science Experience Watson Machine Learning Watson Analytics