


Iurii Antykhovych "Java and performance tools and toys"
- 1. Java and Performance Tools and Toys 2021-02-25
- 2. Agend a • Methodolog y • Metric s • Profiling, Profiler s • Use Case s • Profile Viewer s • Profiling target s • Distributed profilin g • Other tool s
- 3. www.luxoft.com Starting Poin t “Use The Right Tool at the Right Place” Anonymous plumber Great Learning course at Lux Learning : В. Сонькин, Java Advanced II: Performance Photo b y Simon Migaj @ unsplash.com
- 4. www.luxoft.com Use the USE method : Resource List : ๏ CPUs: sockets, cores, hardware threads (virtual CPUs ) ๏ Memory: capacit y ๏ Network interface s ๏ Storage devices: I/O, capacit y ๏ Controllers: storage, network card s ๏ Interconnects: CPUs, memory, I/O http://www.brendangregg.com/usemethod.html
- 5. www.luxoft.com Retrieving metrics : Ad-hoc, manual : ๏ CPU: uptime, pidstat, top, vmstat, mpstat, etc . ๏ IO: sar, iostat, iotop, etc . ๏ Memory: free, top, et c ๏ Errors: dmes g ๏ … ๏ Swiss knife: dstat http://www.brendangregg.com/Articles/Netflix_Linux_Perf_Analysis_60s.pdf
- 6. www.luxoft.com Monitoring both App and USE metrics: Metrics reporting : ๏ System: collectd, telegraf, etc . ๏ Java: Micromete r Metrics aggregation : ๏ Free: Prometheus/Grafana, etc . ๏ Commercial: NewRelic, DataDog, CloudWatch, etc . NewRelic metrics Dashboard https://micrometer.io
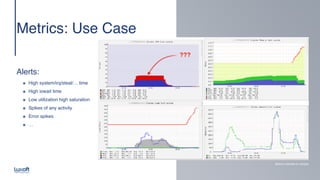
- 7. www.luxoft.com Metrics: Use Cas e Alerts : ๏ High system/irq/steal/… time ๏ High iowait time ๏ Low utilization high saturatio n ๏ Spikes of any activit y ๏ Error spike s ๏ … Metrics collected by Ganglia ???
- 8. www.luxoft.com Flamegraph s Types : ๏ CP U ๏ Off-CP U ๏ Memory, Allocatio n ๏ Software/Hardware event s ๏ Composite (Hot/Cold), Differential http://www.brendangregg.com/flamegraphs.html
- 9. www.luxoft.com Profiling and Profilers : Profiler types : ๏ Instrumenting automate d ๏ Instrumenting manua l ๏ Samplin g ๏ … Survey by RebelLabs, RedHat Summit 2015, Lessons learned from the JBoss performance team JavaDay UA 2017: Nitsan Wakart. Profilers Are Lying Hobbitses Better Profiler types : ๏ goo d ๏ bad
- 10. www.luxoft.com Async Profiler : Features : ๏ No use of JVMTI GetAllStackTraces(), Safepoint Bias-fre e ๏ Combines both worlds: Java frames - AsynGetCallTrace(), internal HotSpot API Native frames (user + kernel)- perf_event_open syscal l ๏ Flexible events: CPU cycles, tracepoints, native/Java methods, PMU counter s ๏ Flexible modes: CPU profiling, Off-CPU profiling, Allocation profilin g ๏ Flexible output: bomb dump, “collapsed” (perf compatible), JFR, flamegraphs, call trees, conversion scripts AP with Andrey Pangin: 4h-long (!!!) webinar: https://youtube.com/playlist?list=PLNCLTEx3B8h4Yo_WvKWdLvI9mj1XpTKBr https://www.vecteezy.com/free-vector/the-end
- 11. www.luxoft.com Async Profiler : Drawbacks : ๏ No Windows suppor t ๏ Allocation: same as JFR, slow path-only, TLAB bias, no JEP-331 support Resolved in jvmti-tools/heapsampler project, YourKi t ๏ No system-wide profilin g ๏ No distributed profilin g ๏ Tricky cases: e.g. cpu time/cycles vs physical time https://github.com/apangin/codeone2019-java-profilin g Photo by Emiliano Vittoriosi @ unsplash.com
- 12. www.luxoft.com Async Profiler : Configuration : ๏ Allow collecting kernel frames: $ sudo sh -c 'echo 1 >/proc/sys/kernel/perf_event_paranoid' $ sudo sh -c 'echo 0 >/proc/sys/kernel/kptr_restrict’ Running : ๏ As JVM agent -XX:+DebugNonSafepoint s ๏ Attach to process -XX:+UnlockDiagnosticVMOptions -XX:+DebugNonSafepoint s ๏ From Java application code https://www.baeldung.com/java-async-profiler Async Profiler help output
- 13. www.luxoft.com Viewing Profiles : Profile Formats : ๏ Summary (text ) ๏ Call Tre e ๏ HTML Flamegrap h ๏ SVG Flamegraph (v1.X, or requires flamegraph.pl script ) ๏ nflx (flamescope) java -cp build/converter.jar jfr2nflx myprofile.jfr out.nfl x Third-party Viewers : ๏ IntelliJ IDEA Ultimate Editio n ๏ SpeedScope (https://www.speedscope.app ) ๏ FlameScope (https://github.com/Netflix/flamescope) SpeedScope FlameScope
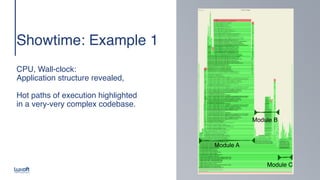
- 14. www.luxoft.com Showtime: Example 1 CPU, Wall-clock: Application structure revealed, Hot paths of execution highlighted in a very-very complex codebase. Module A Module B Module C
- 15. www.luxoft.com Example 2 CPU - Native frames Business logic Only this part is visible in VisualVM / JMC (!!!) JVM went crazy with 600 threads
- 16. www.luxoft.com Example 3 CPU, by Threads: GC at work Caption Business logic GC at work
- 17. www.luxoft.com Example 4 CPU, Reversed Caption Business logic GC at work Structured Chaotic
- 19. www.luxoft.com What to profile : Production : ๏ Enable on all or part of the nodes in pro d Loadtests : ๏ Run nightly loadtests with profiling enable d ๏ Correlate the loadtest results with metrics and perf. profiles Benchmarks : ๏ JMH integration in sbt-jmh by Konrad Malawski https://github.com/ktoso/sbt-jmh As simple as: -prof jfr / -prof async Gatling Loadtest NewRelic Dashboard Performance Profile: JFR Flamegraphs
- 20. www.luxoft.com Distributed profilin g Collapsed flow : ๏ Collect collapsed or JFR file s ๏ Concatenate collected file s ๏ Convert to desired format: svg, html, nflx (flamescope) Examples: ./flamegraph.pl --color java input.collapsed > out.svg java -cp build/converter.jar jfr2nflx myprofile.jfr out.nfl x ๏ Voila! View in favorite viewer JMC 8.0
- 21. www.luxoft.com Profiling: Other options Commercial JVM profilers : ๏ Amazon CodeGur u ๏ Google Cloud Profile r ๏ Opsian (by creator of honest-profiler ) ๏ DataDog continuous profile r ๏ … Photo by Fabian Blank @ unsplash.com
- 22. www.luxoft.com Where to go next ? Things you might want to look at : ๏ PMU counters in Java S. Kuksenko: Speed up you Java App with Hardware Counters ๏ TMAM Method: Top-down Micro-architecture Analysi s ๏ Intel vTune Profile r ๏ AMD µPro f ๏ https://github.com/andikleen/pmu-tools, TopLe v ๏ eBP F ๏ …
- 23. Thank You!