


![SJK: ttop
2014-10-01T19:27:22.825+0400 Process summary
process cpu=101.80%
application cpu=100.50% (user=86.21% sys=14.29%)
other: cpu=1.30%
GC cpu=0.00% (young=0.00%, old=0.00%)
heap allocation rate 123mb/s
safe point rate: 0.8 (events/s) avg. safe point pause: 211.69ms
safe point sync time: 0.00% processing time: 17.47% (wallclock time)
[000037] user=83.66% sys=14.02% alloc= 121mb/s - Proxy:ExtendTcpProxyService1:TcpAcceptor:TcpProcessor
[000075] user= 0.97% sys= 0.08% alloc= 411kb/s - RMI TCP Connection(35)-10.139.200.51
[000029] user= 0.61% sys=-0.00% alloc= 697kb/s - Invocation:Management
[000073] user= 0.49% sys=-0.01% alloc= 343kb/s - RMI TCP Connection(33)-10.128.46.114
[000023] user= 0.24% sys=-0.01% alloc= 10kb/s - PacketPublisher
[000022] user= 0.00% sys= 0.10% alloc= 11kb/s - PacketReceiver
[000072] user= 0.00% sys= 0.07% alloc= 22kb/s - RMI TCP Connection(31)-10.139.207.76
[000056] user= 0.00% sys= 0.05% alloc= 20kb/s - RMI TCP Connection(25)-10.139.207.76
[000026] user= 0.12% sys=-0.07% alloc= 2217b/s - Cluster|Member(Id=18, Timestamp=2014-10-01 15:58:3...
[000076] user= 0.00% sys= 0.04% alloc= 6657b/s - JMX server connection timeout 76
[000021] user= 0.00% sys= 0.03% alloc= 526b/s - PacketListener1P
[000034] user= 0.00% sys= 0.02% alloc= 1537b/s - Proxy:ExtendTcpProxyService1
[000049] user= 0.00% sys= 0.02% alloc= 6011b/s - JMX server connection timeout 49
[000032] user= 0.00% sys= 0.01% alloc= 0b/s - DistributedCache
https://github.com/aragozin/jvm-tools/blob/master/sjk-core/COMMANDS.md#ttop-command
Available via PerfCounters](https://image.slidesharecdn.com/javaprofilingdiy-jug-160831073047/85/Java-profiling-Do-It-Yourself-jug-msk-ru-2016-4-320.jpg)

![SJK: GC
[GC: Copy#1806 time: 7ms interval: 332ms mem: Eden Space: 108032k-108032k->0k[max:191168k,rate:-325397.59kb/s] Tenured
Gen: 162185k+14k->162199k[max:477888k,rate:42.22kb/s] Survivor Space: 235k-13k->222k[max:23872k,rate:-41.93kb/s]]
[GC: Copy#1807 time: 8ms interval: 338ms mem: Eden Space: 108032k-108032k->0k[max:191168k,rate:-319621.30kb/s] Tenured
Gen: 162199k+219k->162418k[max:477888k,rate:648.30kb/s] Survivor Space: 222k-217k->4k[max:23872k,rate:-644.90kb/s]]
[GC: Copy#1808 time: 7ms interval: 321ms mem: Eden Space: 108032k-108032k->0k[max:191168k,rate:-336548.29kb/s] Tenured
Gen: 162418k+0k->162418k[max:477888k,rate:0.00kb/s] Survivor Space: 4k-2k->1k[max:23872k,rate:-7.64kb/s]]
[GC: Copy#1809 time: 7ms interval: 321ms mem: Eden Space: 108032k-108032k->0k[max:191168k,rate:-336548.29kb/s] Tenured
Gen: 162418k+0k->162418k[max:477888k,rate:0.00kb/s] Survivor Space: 1k+0k->1k[max:23872k,rate:0.24kb/s]]
[GC: Copy#1810 time: 4ms interval: 700ms mem: Eden Space: 108032k-108032k->0k[max:191168k,rate:-154331.43kb/s] Tenured
Gen: 162418k+0k->162418k[max:477888k,rate:0.00kb/s] Survivor Space: 1k+288k->290k[max:23872k,rate:412.00kb/s]]
[GC: Copy#1811 time: 5ms interval: 311ms mem: Eden Space: 108032k-108032k->0k[max:191168k,rate:-347369.77kb/s] Tenured
Gen: 162418k+0k->162418k[max:477888k,rate:0.00kb/s] Survivor Space: 290k-155k->135k[max:23872k,rate:-498.52kb/s]]
[GC: Copy#1812 time: 3ms interval: 340ms mem: Eden Space: 108032k-108032k->0k[max:191168k,rate:-317741.18kb/s] Tenured
Gen: 162418k+0k->162418k[max:477888k,rate:0.00kb/s] Survivor Space: 135k-2k->132k[max:23872k,rate:-6.14kb/s]]
[GC: Copy#1813 time: 6ms interval: 325ms mem: Eden Space: 108032k-108032k->0k[max:191168k,rate:-332406.15kb/s] Tenured
Gen: 162418k+0k->162418k[max:477888k,rate:0.00kb/s] Survivor Space: 132k+0k->133k[max:23872k,rate:0.65kb/s]]
Total
Copy[ collections: 28 | avg: 0.0065 secs | total: 0.2 secs ]
MarkSweepCompact[ collections: 0 | avg: NaN secs | total: 0.0 secs ]
https://github.com/aragozin/jvm-tools/blob/master/sjk-core/COMMANDS.md#gc-command](https://image.slidesharecdn.com/javaprofilingdiy-jug-160831073047/85/Java-profiling-Do-It-Yourself-jug-msk-ru-2016-6-320.jpg)


![Working with heap dumps
HeapPath
Convenient way to extract value from dump
Error proof
Handles String, primitives/boxed and arrays
myfield1.myfield2.myfield3
myarrayfield[0].myfield
myarrayfield[*].myfield
myarrayfield[*][*]
myfield1.*.myfield3
[*].value(MyClass)
myhashmap?entrySet[key=description].value](https://image.slidesharecdn.com/javaprofilingdiy-jug-160831073047/85/Java-profiling-Do-It-Yourself-jug-msk-ru-2016-19-320.jpg)


Ad
More Related Content
What's hot (20)
Viewers also liked (10)


Ad
Similar to Java profiling Do It Yourself (jug.msk.ru 2016) (20)


Ad
More from aragozin (20)


![Секреты сборки мусора в Java [DUMP-IT 2012]](https://cdn.slidesharecdn.com/ss_thumbnails/secretsofgarbagecollectioninjava-dump2012-120525130043-phpapp01-thumbnail.jpg?width=560&fit=bounds)


Recently uploaded (20)


Java profiling Do It Yourself (jug.msk.ru 2016)
- 1. Java profiling Do It Yourself Alexey Ragozin [email protected] JUG.MSK.RU 2016
- 2. JVM diagnostic interfaces • JMX • JVMTI – native API only • Attach Protocol Ad hoc instrumentation and more • Perf counters • Heap dump • Flight recorder • Serviceability agent
- 3. MBeans: threading CPU usage per thread (user / sys) Memory allocation per thread Block / wait times Should be enabled Stack traces Invaluable
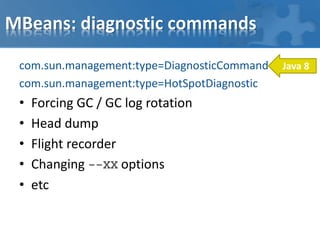
- 4. SJK: ttop 2014-10-01T19:27:22.825+0400 Process summary process cpu=101.80% application cpu=100.50% (user=86.21% sys=14.29%) other: cpu=1.30% GC cpu=0.00% (young=0.00%, old=0.00%) heap allocation rate 123mb/s safe point rate: 0.8 (events/s) avg. safe point pause: 211.69ms safe point sync time: 0.00% processing time: 17.47% (wallclock time) [000037] user=83.66% sys=14.02% alloc= 121mb/s - Proxy:ExtendTcpProxyService1:TcpAcceptor:TcpProcessor [000075] user= 0.97% sys= 0.08% alloc= 411kb/s - RMI TCP Connection(35)-10.139.200.51 [000029] user= 0.61% sys=-0.00% alloc= 697kb/s - Invocation:Management [000073] user= 0.49% sys=-0.01% alloc= 343kb/s - RMI TCP Connection(33)-10.128.46.114 [000023] user= 0.24% sys=-0.01% alloc= 10kb/s - PacketPublisher [000022] user= 0.00% sys= 0.10% alloc= 11kb/s - PacketReceiver [000072] user= 0.00% sys= 0.07% alloc= 22kb/s - RMI TCP Connection(31)-10.139.207.76 [000056] user= 0.00% sys= 0.05% alloc= 20kb/s - RMI TCP Connection(25)-10.139.207.76 [000026] user= 0.12% sys=-0.07% alloc= 2217b/s - Cluster|Member(Id=18, Timestamp=2014-10-01 15:58:3... [000076] user= 0.00% sys= 0.04% alloc= 6657b/s - JMX server connection timeout 76 [000021] user= 0.00% sys= 0.03% alloc= 526b/s - PacketListener1P [000034] user= 0.00% sys= 0.02% alloc= 1537b/s - Proxy:ExtendTcpProxyService1 [000049] user= 0.00% sys= 0.02% alloc= 6011b/s - JMX server connection timeout 49 [000032] user= 0.00% sys= 0.01% alloc= 0b/s - DistributedCache https://github.com/aragozin/jvm-tools/blob/master/sjk-core/COMMANDS.md#ttop-command Available via PerfCounters
- 5. MBeans: memory • Memory geometry information • Collection count • Last collection details for each collector • GC events available as notifications since Java 7
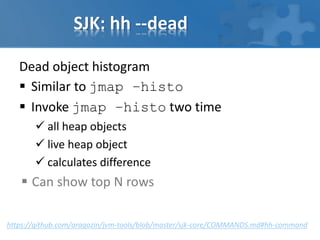
- 6. SJK: GC [GC: Copy#1806 time: 7ms interval: 332ms mem: Eden Space: 108032k-108032k->0k[max:191168k,rate:-325397.59kb/s] Tenured Gen: 162185k+14k->162199k[max:477888k,rate:42.22kb/s] Survivor Space: 235k-13k->222k[max:23872k,rate:-41.93kb/s]] [GC: Copy#1807 time: 8ms interval: 338ms mem: Eden Space: 108032k-108032k->0k[max:191168k,rate:-319621.30kb/s] Tenured Gen: 162199k+219k->162418k[max:477888k,rate:648.30kb/s] Survivor Space: 222k-217k->4k[max:23872k,rate:-644.90kb/s]] [GC: Copy#1808 time: 7ms interval: 321ms mem: Eden Space: 108032k-108032k->0k[max:191168k,rate:-336548.29kb/s] Tenured Gen: 162418k+0k->162418k[max:477888k,rate:0.00kb/s] Survivor Space: 4k-2k->1k[max:23872k,rate:-7.64kb/s]] [GC: Copy#1809 time: 7ms interval: 321ms mem: Eden Space: 108032k-108032k->0k[max:191168k,rate:-336548.29kb/s] Tenured Gen: 162418k+0k->162418k[max:477888k,rate:0.00kb/s] Survivor Space: 1k+0k->1k[max:23872k,rate:0.24kb/s]] [GC: Copy#1810 time: 4ms interval: 700ms mem: Eden Space: 108032k-108032k->0k[max:191168k,rate:-154331.43kb/s] Tenured Gen: 162418k+0k->162418k[max:477888k,rate:0.00kb/s] Survivor Space: 1k+288k->290k[max:23872k,rate:412.00kb/s]] [GC: Copy#1811 time: 5ms interval: 311ms mem: Eden Space: 108032k-108032k->0k[max:191168k,rate:-347369.77kb/s] Tenured Gen: 162418k+0k->162418k[max:477888k,rate:0.00kb/s] Survivor Space: 290k-155k->135k[max:23872k,rate:-498.52kb/s]] [GC: Copy#1812 time: 3ms interval: 340ms mem: Eden Space: 108032k-108032k->0k[max:191168k,rate:-317741.18kb/s] Tenured Gen: 162418k+0k->162418k[max:477888k,rate:0.00kb/s] Survivor Space: 135k-2k->132k[max:23872k,rate:-6.14kb/s]] [GC: Copy#1813 time: 6ms interval: 325ms mem: Eden Space: 108032k-108032k->0k[max:191168k,rate:-332406.15kb/s] Tenured Gen: 162418k+0k->162418k[max:477888k,rate:0.00kb/s] Survivor Space: 132k+0k->133k[max:23872k,rate:0.65kb/s]] Total Copy[ collections: 28 | avg: 0.0065 secs | total: 0.2 secs ] MarkSweepCompact[ collections: 0 | avg: NaN secs | total: 0.0 secs ] https://github.com/aragozin/jvm-tools/blob/master/sjk-core/COMMANDS.md#gc-command
- 7. MBeans: diagnostic commands com.sun.management:type=DiagnosticCommand com.sun.management:type=HotSpotDiagnostic • Forcing GC / GC log rotation • Head dump • Flight recorder • Changing --XX options • etc Java 8
- 8. JVM Attach Protocol • List JVM processes • Attach to JVM by PID • Send control commands heap dump / histogram stack dump • Inspect system properties and VM options • Launch instrumentation agents https://github.com/gridkit/jvm-attach
- 9. SJK: hh --dead Dead object histogram Similar to jmap –histo Invoke jmap –histo two time all heap objects live heap object calculates difference Can show top N rows https://github.com/aragozin/jvm-tools/blob/master/sjk-core/COMMANDS.md#hh-command
- 10. SJK: hh --dead 1: 19117456 2038375696 [C 2: 9543865 441272568 [Ljava.lang.Object; 3: 13519356 432619392 java.util.HashMap$Entry 4: 12558262 301398288 java.lang.String 5: 7193066 287722640 org.hibernate.engine.spi.CollectionKey 6: 619253 160678888 [I 7: 4710497 113051928 org.jboss.seam.international.Messages$1$1 8: 571327 100876880 [Ljava.util.HashMap$Entry; 9: 1436183 57447320 org.hibernate.event.spi.FlushEntityEvent 10: 1661932 53181824 java.util.Stack 11: 209899 52047904 [B 12: 1624200 51974400 org.hibernate.engine.internal.Cascade 13: 929354 44608992 java.util.HashMap 14: 1812762 43506288 org.hibernate.i.u.c.IdentityMap$IdentityMapEntry 15: 850157 34006280 java.util.TreeMap$Entry 16: 1044636 25071264 java.util.ArrayList 17: 1340986 23423328 [Ljava.lang.Class; 18: 710973 22751136 java.io.ObjectStreamClass$WeakClassKey 19: 885164 21243936 org.hibernate.event.internal.WrapVisitor 20: 885126 21243024 org.hibernate.event.internal.FlushVisitor ... Total 95197823 4793878008 https://github.com/aragozin/jvm-tools/blob/master/sjk-core/COMMANDS.md#hh-command
- 11. SJK: jps JDK’s jps on steroid Uses attach API Lists VMs Filtering by JVM system properties Prints property values Prints effective –XX options https://github.com/aragozin/jvm-tools/blob/master/sjk-core/COMMANDS.md#jps-command
- 12. SJK: jps My favorite command > sjk jps -pd PID MAIN duser.dir XMaxHeapSize 90543 sjk-0.3.1-SNAPSHOT.jar /var/vas_sdk_test_server -XX:MaxHeapSize=32126271488 5315 WrapperSimpleApp /var/vas_sdk_test_server/vas-sdk-test-13030 -XX:MaxHeapSize=4294967296 11094 WrapperSimpleApp /var/vas_sdk_test_server/vas-sdk-test-13020 -XX:MaxHeapSize=4294967296 993 Main /var/gedoms-uat/private/rtdb_1 -XX:MaxHeapSize=12884901888 56603 AxiomApplication /var/gedoms-uat/private/gedoms_1 -XX:MaxHeapSize=2147483648 24046 WrapperSimpleApp /var/sonar/sonar-3.6.2/bin/linux-x86-64 -XX:MaxHeapSize=536870912 https://github.com/aragozin/jvm-tools/blob/master/sjk-core/COMMANDS.md#jps-command
- 13. Perf counters Based on shared memory safe for target JVM Flat data model misc JVM counters safepoint statistics GC tennuring stats you can add own counter programmatically jcmd PID PerfCounter.print
- 14. Stack Trace Sampling Capture • Dump stack traces via local connection • Store in highly compressed dump 10-30 bytes per trace Analysis • Frame frequency • Conditional frame frequency • Traces classification histogram https://github.com/aragozin/jvm-tools/blob/master/sjk-core/COMMANDS.md#stcap-command
- 16. Tracking down CPU hogs Command sjk ssa -f tracedump.std --categorize -tf **.CoyoteAdapter.service -nc JDBC=**.jdbc Hibernate=org.hibernate "Facelets compile=com.sun.faces.facelets.compiler.Compiler.compile" "Seam bijection=org.jboss.seam.**.aroundInvoke/!**.proceed" JSF.execute=com.sun.faces.lifecycle.LifecycleImpl.execute JSF.render=com.sun.faces.lifecycle.LifecycleImpl.render Other=** Report Total samples 2732050 100.00% JDBC 405439 14.84% Hibernate 802932 29.39% Facelets compile 395784 14.49% Seam bijection 385491 14.11% JSF.execute 290355 10.63% JSF.render 297868 10.90% Other 154181 5.64% 0.00% 20.00% 40.00% 60.00% 80.00% 100.00% Time Other JSF.render JSF.execute Seam bijection Facelets compile Hibernate JDBC Excel
- 17. Tracking down CPU hogs Stack frame frequency histogram Command sjk ssa -f tracedump --histo -tf **!**.jdbc -tt ogr.hibernate Report Trc (%)FrmNTerm (%)Frame 69950687%699506 0 0%org.hibernate.internal.SessionImpl.autoFlushIfRequired(SessionImpl.java:1204) 68937085%689370 10 0%org.hibernate.internal.QueryImpl.list(QueryImpl.java:101) 67652484%676524 0 0%org.hibernate.event.internal.DefaultAutoFlushEventListener.onAutoFlush(DefaultAutoFlushEventListener.java:58) 67513684%675136 0 0%org.hibernate.internal.SessionImpl.list(SessionImpl.java:1261) 57383671%573836 4 0%org.hibernate.ejb.QueryImpl.getResultList(QueryImpl.java:264) 55096868%550968 1 0%org.hibernate.event.internal.AbstractFlushingEventListener.flushEverythingToExecutions(AbstractFlushingEventListener.java:99) 53389266%533892 132 0%org.hibernate.event.internal.AbstractFlushingEventListener.flushEntities(AbstractFlushingEventListener.java:227) 38151447%381514 882 0%org.hibernate.event.internal.AbstractVisitor.processEntityPropertyValues(AbstractVisitor.java:76) 27101833%271018 0 0%org.hibernate.event.internal.DefaultFlushEntityEventListener.onFlushEntity(DefaultFlushEntityEventListener.java:161) http://blog.ragozin.info/2016/01/flame-graphs-vs-cold-numbers.html
- 18. Working with heap dumps Java API to traverse heap dump object graph Available at https://github.com/aragozin/jvm-tools/tree/master/hprof-heap Based on NetBeans profiler library No temporary files used Fixed generic method signatures Improved performance Useful for In-place processing of large heap dumps 150 GiB is my personal record Write domain specific heap usage reports
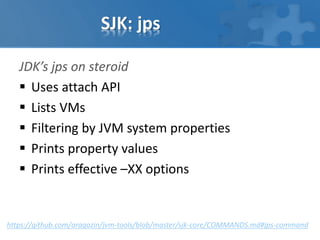
- 19. Working with heap dumps HeapPath Convenient way to extract value from dump Error proof Handles String, primitives/boxed and arrays myfield1.myfield2.myfield3 myarrayfield[0].myfield myarrayfield[*].myfield myarrayfield[*][*] myfield1.*.myfield3 [*].value(MyClass) myhashmap?entrySet[key=description].value
- 20. Working with heap dumps See also https://github.com/vlsi/mat-calcite-plugin Heap dump meets SQL
- 21. SJK Summary Visit https://github.com/aragozin/jvm-tools Single executable JAR Command line interface Exploits JMX/JVMAttachProtocol/PerfCounters Sampling profiler included Extensible commands Write commands for your own application
- 22. Btrace: CLI profiler BTrace • Instrumenting profiler • Used via CLI or API • Scriptable with Java BTrace script @Property Profiler prof = Profiling.newProfiler(); @OnMethod(clazz = "org.jboss.seam.Component", method = "/(inject|disinject|outject)/") void entryByMethod2(@ProbeClassName String className, @ProbeMethodName String methodName, @Self Object component) { if (component != null) { Field nameField = field(classOf(component), "name", true); if (nameField != null) { String name = (String)get(nameField, component); Profiling.recordEntry(prof, concat("org.jboss.seam.Component.", concat(methodName, concat(":", name)))); } } } @OnMethod(clazz = "org.jboss.seam.Component", method = "/(inject|disinject|outject)/", location = @Location(value = Kind.RETURN)) void exitByMthd2(@ProbeClassName String className, @ProbeMethodName String methodName, @Self Object component, @Duration long duration) { if (component != null) { Field nameField = field(classOf(component), "name", true); if (nameField != null) { String name = (String)get(nameField, component); Profiling.recordExit(prof, concat("org.jboss.seam.Component.", concat(methodName, concat(":", name))), duration); } } } https://github.com/jbachorik/btrace2
- 23. Sigar System Information Gatherer And Reporter https://github.com/hyperic/sigar • Cross platform • Common system metrics CPU, Context switches, IO, etc • Java bindings Self extracting JAR: org.gridkit.lab:sigar-lib:1.6.4
- 24. Flight Recorder + Accessible via JMX + Targeting JVM internals + Low overhead ‐ Non-compact file format ‐ Biased profiling ‐ Weak support for thread sampling
- 26. Serviceability agent Ultimate JVM debugging tool • Use binding to platform debugger (windbg, gdbg) can work with core dumps • Use RTTI information from JVM binaries OpenJDK requires debug symbols to be installed for SA to work • Introspect JVM internals by inspecting process memory • Used by jstack -F and other JVM tools accepting core dumps • Very buggy! • Very slow! • Abandoned?
- 27. Mixed Stack Sampling Sampling via SA • Sample all Java, JVM and native • Slow (~10 times application slow down)
- 28. Serviceability Agent Summary Hybrid stack trace sampling • Slow and intrusive • Stack parsing issues (-XX:+PreserveFramePointer should help) • There are alternatives: Honest Profiler - https://github.com/RichardWarburton/honest-profiler Perf Map Agent - https://github.com/jrudolph/perf-map-agent Heap walking with SA • May be faster for large heaps No need heap to disk serialization! • Inspecting portion of heap (e.g. Eden only) • Some code in jdi-sa.jar should be optimized to fix performance
- 29. Thank you Alexey Ragozin [email protected] http://blog.ragozin.info - my technical blog http://github.com/aragozin http://github.com/gridkit - my open source projects