SlideShare a Scribd company logo
And other Tips & Tricks to make you a “Performance Expert”
More on http://blog.dynatrace.com
Andreas Grabner - @grabnerandi
Java One 2015 – Deep Dive
Top Performance Mistakes
Safe Harbor 
AND MANY MORE
0.02ms
0.01ms
JavaOne 2015: Top Performance Patterns Deep Dive
15 Years: That’s why I ended up talking about performance
Where do your
Stories come
from?
#1: Real Life & Real User Stories
#2: http://bit.ly/onlineperfclinic
#3: http://bit.ly/sharepurepath
JavaOne 2015: Top Performance Patterns Deep Dive
20%
80%
JavaOne 2015: Top Performance Patterns Deep Dive
Frontend Performance
We are getting FATer!
JavaOne 2015: Top Performance Patterns Deep Dive
Example of a “Bad” Web Deployment 282! Objects
on that page9.68MB Page Size
8.8s Page Load
Time
Most objects are images
delivered from your main
domain
Very long Connect time
(1.8s) to your CDN
Mobile landing page of Super Bowl ad
434 Resources in total on that page:
230 JPEGs, 75 PNGs, 50 GIFs, …
Total size of ~
20MB
Fifa.com during Worldcup
Source: http://apmblog.compuware.com/2014/05/21/is-the-fifa-world-cup-website-ready-for-the-tournament/
8MB of background image for STPCon (Word Press)
Make F12 or Browser Agent your friend!
Compare yourself Online!
Key Metrics
# of Resources
Size of Resources
Total Size of Content
• Browser Built-In Developer Tools
• Extensions such as YSlow, PageSpeed
• Online Tools
• WebPageTest
• Google PageSpeed Insights
• Dynatrace Performance Center
• ...
• Automate!! With Selenium, WebDriver, Cucumber, ...
Tooling
Frontend Availability
Back to Basics Please!
JavaOne 2015: Top Performance Patterns Deep Dive
Online Services for you: Is it down right now?
Online Services for you: Outage Analyzer
Tip for handling Spike Load: GO LEAN!!
1h before
SuperBowl KickOff
1h after
Game ended
Key Metrics
HTTP 3xx, 4xx, 5xx
# of Domains
• Dynatrace Synthetic
• Ruxit Synthetic
• NewRelic Synthetic
• AppDynamics
• PingDom
• ... Just Google for „Synthetic Monitoring“
Online Services
Backend Performance
The Usual Suspects
• Symptoms
• HTML takes between 60 and 120s to render
• High GC Time
• Developer Assumptions
• Bad GC Tuning
• Probably bad Database Performance as rendering was simple
• Result: 2 Years of Finger pointing between Dev and DBA
Project: Online Room Reservation System
Developers built own monitoring
void roomreservationReport(int officeId)
{
long startTime = System.currentTimeMillis();
Object data = loadDataForOffice(officeId);
long dataLoadTime = System.currentTimeMillis() - startTime;
generateReport(data, officeId);
}
Result:
Avg. Data Load Time: 45s!
DB Tool says:
Avg. SQL Query: <1ms!
#1: Loading too much data
24889! Calls to the Database
API!
High CPU and High Memory Usage
to keep all data in Memory
#2: On individual connections 12444!
individual
connections
Classical N+1 Query
Problem
Individual SQL
really <1ms
#3: Putting all data in temp Hashtable
Lots of time spent in
Hashtable.get
Called from their Entity
Objects
• … you know what code is doing you inherited!!
• … you are not making mistakes like this 
• Explore the Right Tools
• Built-In Database Analysis Tools
• “Logging” options of Frameworks such as Hibernate, …
• JMX, Perf Counters, … of your Application Servers
• Performance Tracing Tools: Dynatrace, Ruxit, NewRelic,
AppDynamics, Your Profiler of Choice …
Lessons Learned – Don’t Assume …
Key Metrics
# of SQL Calls
# of same SQL Execs (1+N)
# of Connections
Rows/Data Transferred
Backend Performance
Architectural Mistakes with
„Migrating“ to (Micro)Services
26.7s Execution
Time
33! Calls to the same
Web Service
171! SQL Queries through LINQ
by this Web Service – request
similar data for each call
Architecture Violation: Direct access to DB instead
from frontend logic
21671! Calls to Oracle
3136! Calls to H2
mostly executed on
async background
threads
33! Different
connections used
DB Exceptions on both
Databases
DB Exceptions on both
Databases
40! internal Web
Service Calls that
do all these DB
Updates
Key Metrics
# of Service Calls
Payload of Service Calls
# of Involved Threads
1+N Service Call Pattern!
• Dynatrace
• Ruxit
• NewRelic
• AppDynamics
• Any Profiler that can trace across tiers
• Google for Tracing or APM (Application Performance
Management)
Tooling
Logging
WE CAN LOG THIS!!
LOG
Log Hotspots in Frameworks!
callAppenders clear CPU and I/O Hotspot
Excessive logging through Spring Framework
Debug Log and outdated log4j library
#1: Top Problem: log4j.callAppenders
-> 71% Sync Time
#2: Most of logging done from
fillDetail method
#3: Doing “DEBUG” log
output: Is this necessary?
Key Metrics
# of Log Entries
Size of Logs per Use Case
Response Time is not the only
Performance Indicator
Look at Resources as well
Is this a successful new Build?
Look at Resource Usage: CPU, Memory, …
Memory? Look at Heap Generations
Root Cause: Dependency Injection
Prevent: Monitor Memory Metrics for every Build
#3: Growing
“Old Gen” is a
good indicator
for a Mem Leak
#4: Heavy GC
kicks in when
Old
Generation is
full!
#5: Throughput
of Application
goes to 0 due to
no memory
available
#1: Eden Space stays constant.
Objects being propagated to
Survivor Space
#2: GC Activity in Young
Generation ultimately
moves objects into Old
Generation
Key Metrics
# of Objects per Generation
# of GC Runs
Total Impact of GC
Tips & Tricks
And more Metrics of course 
Tip: Layer Breakdown over Time
With increasing load: Which LAYER
doesn’t SCALE?
Tip: Exceptions and Log Messages
How are # of EXCEPTIONS
evolving over time?
How many SEVERE LOG
messages to we write in
relation to Exceptions?
Tip: Failed Transactions
Are more TRANSACTIONS
FAILING (HTTP 5xx, 4xx, …)
under heavier load?
Tip: Database Activity
Do we see increased in AVG #
of SQL Executions over Time?
Do TOTAL # of SQL Executions
increase with load? Shouldn’t
it flatten due to CACHES?
Tip: Database History Dashboard
How many SQL Statements are
PREPARED?
What’s the overall Execution
Time of different SQL Types
(SELECT, INSERT, DELETE, …)
Tip: DB Connection Pool Utilization
Do we have enough DB
CONNECTIONS per pool?
For more Key Metrics
http://blog.dynatrace.com
http://blog.ruxit.com
We want to get from here …
To here!
Use these application metrics as additional
Quality Gates
71
What you currently measure
What you should measure
Quality Metrics
in your CI
# Test Failures
Overall Duration
Execution Time per test
# calls to API
# executed SQL statements
# Web Service Calls
# JMS Messages
# Objects Allocated
# Exceptions
# Log Messages
# HTTP 4xx/5xx
Request/Response Size
Page Load/Rendering Time
…
Connecting your Tests with Quality
12 0 120ms
3 1 68ms
Build 20 testPurchase OK
testSearch OK
Build 17 testPurchase OK
testSearch OK
Build 18 testPurchase FAILED
testSearch OK
Build 19 testPurchase OK
testSearch OK
Build # Test Case Status # SQL # Excep CPU
12 0 120ms
3 1 68ms
12 5 60ms
3 1 68ms
75 0 230ms
3 1 68ms
Test Framework Results Architectural Data
We identified a regresesion
Problem solved
Exceptions probably reason for
failed tests
Problem fixed but now we have an
architectural regression
Problem fixed but now we have an
architectural regressionNow we have the functional and
architectural confidence
Let’s look behind the
scenes
#1: Analyzing each Test
#2: Metrics for each Test
#3: Detecting Regression
based on Measure
Quality-Metrics based
Build Status
Pull data into Jenkins, Bamboo ...
Making Quality a first-class citizen
„Too hard“
„we‘ll get round to this later“
„not cool enough“
Questions and/or Demo
Slides: slideshare.net/grabnerandi
Get Tools: bit.ly/dttrial
YouTube Tutorials: bit.ly/dttutorials
Contact Me: agrabner@dynatrace.com
Follow Me: @grabnerandi
Read More: blog.dynatrace.com
Andreas Grabner
Dynatrace Developer Advocate
@grabnerandi
http://blog.dynatrace.com
Ad

Recommended

From Zero to Performance Hero in Minutes - Agile Testing Days 2014 Potsdam
Andreas Grabner
 
Deploy Faster Without Failing Faster - Metrics-Driven - Dynatrace User Groups...
Andreas Grabner
 
Sydney Continuous Delivery Meetup May 2014
Andreas Grabner
 
Web and App Performance: Top Problems to avoid to keep you out of the News
Andreas Grabner
 
Four Practices to Fix Your Top .NET Performance Problems
Andreas Grabner
 
HSPS 2015 - SharePoint Performance Santiy Checks
Andreas Grabner
 
Top Java Performance Problems and Metrics To Check in Your Pipeline
Andreas Grabner
 
Docker/DevOps Meetup: Metrics-Driven Continuous Performance and Scalabilty
Andreas Grabner
 
Hugs instead of Bugs: Dreaming of Quality Tools for Devs and Testers
Andreas Grabner
 
Java Performance Mistakes
Andreas Grabner
 
London WebPerf Meetup: End-To-End Performance Problems
Andreas Grabner
 
BTD2015 - Your Place In DevTOps is Finding Solutions - Not Just Bugs!
Andreas Grabner
 
OOP 2016 - Building Software That Eats The World
Andreas Grabner
 
Mobile User Experience: Auto Drive through Performance Metrics
Andreas Grabner
 
Application Quality Gates in Continuous Delivery: Deliver Better Software Fas...
Andreas Grabner
 
Top .NET, Java & Web Performance Mistakes - Meetup Jan 2015
Andreas Grabner
 
(R)evolutionize APM
(R)evolutionize APM
Andreas Grabner
 
How to explain DevOps to your mom
Andreas Grabner
 
How to keep you out of the News: Web and End-to-End Performance Tips
Andreas Grabner
 
Dyna trace
Dyna trace
Yasmine Gaber
 
Performance Metrics for your Build Pipeline - presented at Vienna WebPerf Oct...
Andreas Grabner
 
Metrics Driven DevOps - Automate Scalability and Performance Into your Pipeline
Andreas Grabner
 
DevOps Days Toronto: From 6 Months Waterfall to 1 hour Code Deploys
Andreas Grabner
 
Continuous Deployment: The Dirty Details
Mike Brittain
 
Nginx performance monitoring with Dynatrace
Harald Zeitlhofer
 
JavaOne - Performance Focused DevOps to Improve Cont Delivery
Andreas Grabner
 
StarWest 2013 Performance is not an afterthought – make it a part of your Agi...
Andreas Grabner
 
Boston DevOps Days 2016: Implementing Metrics Driven DevOps - Why and How
Andreas Grabner
 
DevOps Pipelines and Metrics Driven Feedback Loops
Andreas Grabner
 
Practices of Good Software Architects
Eberhard Wolff
 

More Related Content

What's hot (19)

Hugs instead of Bugs: Dreaming of Quality Tools for Devs and Testers
Andreas Grabner
 
Java Performance Mistakes
Andreas Grabner
 
London WebPerf Meetup: End-To-End Performance Problems
Andreas Grabner
 
BTD2015 - Your Place In DevTOps is Finding Solutions - Not Just Bugs!
Andreas Grabner
 
OOP 2016 - Building Software That Eats The World
Andreas Grabner
 
Mobile User Experience: Auto Drive through Performance Metrics
Andreas Grabner
 
Application Quality Gates in Continuous Delivery: Deliver Better Software Fas...
Andreas Grabner
 
Top .NET, Java & Web Performance Mistakes - Meetup Jan 2015
Andreas Grabner
 
(R)evolutionize APM
(R)evolutionize APM
Andreas Grabner
 
How to explain DevOps to your mom
Andreas Grabner
 
How to keep you out of the News: Web and End-to-End Performance Tips
Andreas Grabner
 
Dyna trace
Dyna trace
Yasmine Gaber
 
Performance Metrics for your Build Pipeline - presented at Vienna WebPerf Oct...
Andreas Grabner
 
Metrics Driven DevOps - Automate Scalability and Performance Into your Pipeline
Andreas Grabner
 
DevOps Days Toronto: From 6 Months Waterfall to 1 hour Code Deploys
Andreas Grabner
 
Continuous Deployment: The Dirty Details
Mike Brittain
 
Nginx performance monitoring with Dynatrace
Harald Zeitlhofer
 
JavaOne - Performance Focused DevOps to Improve Cont Delivery
Andreas Grabner
 
StarWest 2013 Performance is not an afterthought – make it a part of your Agi...
Andreas Grabner
 
Hugs instead of Bugs: Dreaming of Quality Tools for Devs and Testers
Andreas Grabner
 
Java Performance Mistakes
Andreas Grabner
 
London WebPerf Meetup: End-To-End Performance Problems
Andreas Grabner
 
BTD2015 - Your Place In DevTOps is Finding Solutions - Not Just Bugs!
Andreas Grabner
 
OOP 2016 - Building Software That Eats The World
Andreas Grabner
 
Mobile User Experience: Auto Drive through Performance Metrics
Andreas Grabner
 
Application Quality Gates in Continuous Delivery: Deliver Better Software Fas...
Andreas Grabner
 
Top .NET, Java & Web Performance Mistakes - Meetup Jan 2015
Andreas Grabner
 
How to explain DevOps to your mom
Andreas Grabner
 
How to keep you out of the News: Web and End-to-End Performance Tips
Andreas Grabner
 
Performance Metrics for your Build Pipeline - presented at Vienna WebPerf Oct...
Andreas Grabner
 
Metrics Driven DevOps - Automate Scalability and Performance Into your Pipeline
Andreas Grabner
 
DevOps Days Toronto: From 6 Months Waterfall to 1 hour Code Deploys
Andreas Grabner
 
Continuous Deployment: The Dirty Details
Mike Brittain
 
Nginx performance monitoring with Dynatrace
Harald Zeitlhofer
 
JavaOne - Performance Focused DevOps to Improve Cont Delivery
Andreas Grabner
 
StarWest 2013 Performance is not an afterthought – make it a part of your Agi...
Andreas Grabner
 

Viewers also liked (20)

Boston DevOps Days 2016: Implementing Metrics Driven DevOps - Why and How
Andreas Grabner
 
DevOps Pipelines and Metrics Driven Feedback Loops
Andreas Grabner
 
Practices of Good Software Architects
Eberhard Wolff
 
Nait
Nait
Joselle Balasa
 
Направи си сам суперкомпютър
OpenFest team
 
Loopbaanbeleid
Loopbaanbeleid
Augustus consultancy
 
API Design and Enterprise Mobile Apps
Qubop Inc.
 
Alcol e psoriasi ita
CreAgri Europe
 
"Green Urbanism" & "Contextualism"
Jerrie Kee
 
華語教學必用的雙拼快注音Instant bopomo chinese phonetic symbols
frankjia
 
Exploring Cloud Credentials for Institutional Use
Jeremy Rosenberg
 
Arh2050 sp2015 syllabus
ProfWillAdams
 
Beyond profit sig carbon finance
Elaine Chow
 
Hum2220 fa2015 research project packet
ProfWillAdams
 
Problemas de aprendizaje
Rogelio Hernández
 
상상지니릴레이
상상지니릴레이
HaNee Seo
 
SchaalX Korte Presentatie
WendaKeijzer
 
Obesità e stress ossidativo: una relazione pericolosa.
CreAgri Europe
 
Architecture | Thinking Distributed to Improve Agility | Jamie Allsop
JAX London
 
Boston DevOps Days 2016: Implementing Metrics Driven DevOps - Why and How
Andreas Grabner
 
DevOps Pipelines and Metrics Driven Feedback Loops
Andreas Grabner
 
Practices of Good Software Architects
Eberhard Wolff
 
Направи си сам суперкомпютър
OpenFest team
 
API Design and Enterprise Mobile Apps
Qubop Inc.
 
"Green Urbanism" & "Contextualism"
Jerrie Kee
 
華語教學必用的雙拼快注音Instant bopomo chinese phonetic symbols
frankjia
 
Exploring Cloud Credentials for Institutional Use
Jeremy Rosenberg
 
Arh2050 sp2015 syllabus
ProfWillAdams
 
Beyond profit sig carbon finance
Elaine Chow
 
Hum2220 fa2015 research project packet
ProfWillAdams
 
상상지니릴레이
상상지니릴레이
HaNee Seo
 
SchaalX Korte Presentatie
WendaKeijzer
 
Obesità e stress ossidativo: una relazione pericolosa.
CreAgri Europe
 
Architecture | Thinking Distributed to Improve Agility | Jamie Allsop
JAX London
 
Ad

Similar to JavaOne 2015: Top Performance Patterns Deep Dive (20)

JUG Poznan - 2017.01.31
Omnilogy
 
Become a Performance Diagnostics Hero
TechWell
 
Industry Keynote at Large Scale Testing Workshop 2015
Wolfgang Gottesheim
 
Application Performance Troubleshooting 1x1 - Part 2 - Noch mehr Schweine und...
rschuppe
 
Ship code like a keptn
Rob Jahn
 
Performance eng prakash.sahu
Dr. Prakash Sahu
 
Five Ways to Fix Your SQL Server Dev-Test Problems
Catalogic Software
 
SharePoint 2013 Performance Analysis - Robi Vončina
SPC Adriatics
 
STP 2014 - Lets Learn from the Top Performance Mistakes in 2013
Andreas Grabner
 
Performance Testing
Performance Testing
Anu Shaji
 
Why And When Should We Consider Stream Processing In Our Solutions Teqnation ...
Soroosh Khodami
 
DevOps: Find Solutions, Not More Defects
TechWell
 
Apex triggers i
Apex triggers i
Obidjon Komiljonov
 
Monitoring and Scaling Redis at DataDog - Ilan Rabinovitch, DataDog
Redis Labs
 
Profiling and Tuning a Web Application - The Dirty Details
Achievers Tech
 
Correlate Log Data with Business Metrics Like a Jedi
Trevor Parsons
 
Monitoring microservice applications: An SRE’s perspective
DevOpsProdigy
 
London web perfug_performancefocused_devops_feb2014
Andreas Grabner
 
ATAGTR2017 Unified APM: The new age performance monitoring for production sys...
Agile Testing Alliance
 
AIR - Framework ( Cairngorm and Parsley )
senthil0809
 
JUG Poznan - 2017.01.31
Omnilogy
 
Become a Performance Diagnostics Hero
TechWell
 
Industry Keynote at Large Scale Testing Workshop 2015
Wolfgang Gottesheim
 
Application Performance Troubleshooting 1x1 - Part 2 - Noch mehr Schweine und...
rschuppe
 
Ship code like a keptn
Rob Jahn
 
Performance eng prakash.sahu
Dr. Prakash Sahu
 
Five Ways to Fix Your SQL Server Dev-Test Problems
Catalogic Software
 
SharePoint 2013 Performance Analysis - Robi Vončina
SPC Adriatics
 
STP 2014 - Lets Learn from the Top Performance Mistakes in 2013
Andreas Grabner
 
Performance Testing
Performance Testing
Anu Shaji
 
Why And When Should We Consider Stream Processing In Our Solutions Teqnation ...
Soroosh Khodami
 
DevOps: Find Solutions, Not More Defects
TechWell
 
Monitoring and Scaling Redis at DataDog - Ilan Rabinovitch, DataDog
Redis Labs
 
Profiling and Tuning a Web Application - The Dirty Details
Achievers Tech
 
Correlate Log Data with Business Metrics Like a Jedi
Trevor Parsons
 
Monitoring microservice applications: An SRE’s perspective
DevOpsProdigy
 
London web perfug_performancefocused_devops_feb2014
Andreas Grabner
 
ATAGTR2017 Unified APM: The new age performance monitoring for production sys...
Agile Testing Alliance
 
AIR - Framework ( Cairngorm and Parsley )
senthil0809
 
Ad

More from Andreas Grabner (16)

KCD Munich - Cloud Native Platform Dilemma - Turning it into an Opportunity
Andreas Grabner
 
OpenTelemetry For GitOps: Tracing Deployments from Git Commit to Production
Andreas Grabner
 
Don't Deploy Into the Dark: DORA Metrics for your K8s GitOps Deployments
Andreas Grabner
 
Observability and Orchestration of your GitOps Deployments with Keptn
Andreas Grabner
 
Release Readiness Validation with Keptn for Austrian Online Banking Software
Andreas Grabner
 
Adding Security to your SLO-based Release Validation with Keptn
Andreas Grabner
 
A Guide to Event-Driven SRE-inspired DevOps
Andreas Grabner
 
Jenkins Online Meetup - Automated SLI based Build Validation with Keptn
Andreas Grabner
 
Continuous Delivery and Automated Operations on k8s with keptn
Andreas Grabner
 
Keptn - Automated Operations & Continuous Delivery for k8s
Andreas Grabner
 
Shipping Code like a keptn: Continuous Delivery & Automated Operations on k8s
Andreas Grabner
 
Top Performance Problems in Distributed Architectures
Andreas Grabner
 
Applying AI to Performance Engineering: Shift-Left, Shift-Right, Self-Healing
Andreas Grabner
 
Monitoring as a Self-Service in Atlassian DevOps Toolchain
Andreas Grabner
 
AWS Summit - Trends in Advanced Monitoring for AWS environments
Andreas Grabner
 
DevOps Transformation at Dynatrace and with Dynatrace
Andreas Grabner
 

Recently uploaded (20)

Best MLM Compensation Plans for Network Marketing Success in 2025
LETSCMS Pvt. Ltd.
 
Humans vs AI Call Agents - Qcall.ai's Special Report
Udit Goenka
 
Introduction to Agile Frameworks for Product Managers.pdf
Ali Vahed
 
NEW-IDM Crack with Internet Download Manager 6.42 Build 27 VERSION
grete1122g
 
Enable Your Cloud Journey With Microsoft Trusted Partner | IFI Tech
IFI Techsolutions
 
Top Time Tracking Solutions for Accountants
oliviareed320
 
Automated Testing and Safety Analysis of Deep Neural Networks
Lionel Briand
 
Advance Doctor Appointment Booking App With Online Payment
AxisTechnolabs
 
IDM Crack with Internet Download Manager 6.42 Build 41 [Latest 2025]
pcprocore
 
Why Edge Computing Matters in Mobile Application Tech.pdf
IMG Global Infotech
 
Streamlining CI/CD with FME Flow: A Practical Guide
Safe Software
 
AI for PV: Development and Governance for a Regulated Industry
Biologit
 
HYBRIDIZATION OF ALKANES AND ALKENES ...
karishmaduhijod1
 
Folding Cheat Sheet # 9 - List Unfolding 𝑢𝑛𝑓𝑜𝑙𝑑 as the Computational Dual of ...
Philip Schwarz
 
Heat Treatment Process Automation in India
Reckers Mechatronics
 
ERP Systems in the UAE: Driving Business Transformation with Smart Solutions
dheeodoo
 
declaration of Variables and constants.pptx
meemee7378
 
Microsoft-365-Administrator-s-Guide1.pdf
mazharatknl
 
Simplify Task, Team, and Project Management with Orangescrum Work
Orangescrum
 
Building Geospatial Data Warehouse for GIS by GIS with FME
Safe Software
 

JavaOne 2015: Top Performance Patterns Deep Dive

  • 1. And other Tips & Tricks to make you a “Performance Expert” More on http://blog.dynatrace.com Andreas Grabner - @grabnerandi Java One 2015 – Deep Dive Top Performance Mistakes
  • 7. 15 Years: That’s why I ended up talking about performance
  • 9. #1: Real Life & Real User Stories
  • 15. Frontend Performance We are getting FATer!
  • 18. Example of a “Bad” Web Deployment 282! Objects on that page9.68MB Page Size 8.8s Page Load Time Most objects are images delivered from your main domain Very long Connect time (1.8s) to your CDN
  • 19. Mobile landing page of Super Bowl ad 434 Resources in total on that page: 230 JPEGs, 75 PNGs, 50 GIFs, … Total size of ~ 20MB
  • 20. Fifa.com during Worldcup Source: http://apmblog.compuware.com/2014/05/21/is-the-fifa-world-cup-website-ready-for-the-tournament/
  • 21. 8MB of background image for STPCon (Word Press)
  • 22. Make F12 or Browser Agent your friend!
  • 24. Key Metrics # of Resources Size of Resources Total Size of Content
  • 25. • Browser Built-In Developer Tools • Extensions such as YSlow, PageSpeed • Online Tools • WebPageTest • Google PageSpeed Insights • Dynatrace Performance Center • ... • Automate!! With Selenium, WebDriver, Cucumber, ... Tooling
  • 30. Online Services for you: Is it down right now?
  • 31. Online Services for you: Outage Analyzer
  • 32. Tip for handling Spike Load: GO LEAN!! 1h before SuperBowl KickOff 1h after Game ended
  • 33. Key Metrics HTTP 3xx, 4xx, 5xx # of Domains
  • 34. • Dynatrace Synthetic • Ruxit Synthetic • NewRelic Synthetic • AppDynamics • PingDom • ... Just Google for „Synthetic Monitoring“ Online Services
  • 36. • Symptoms • HTML takes between 60 and 120s to render • High GC Time • Developer Assumptions • Bad GC Tuning • Probably bad Database Performance as rendering was simple • Result: 2 Years of Finger pointing between Dev and DBA Project: Online Room Reservation System
  • 37. Developers built own monitoring void roomreservationReport(int officeId) { long startTime = System.currentTimeMillis(); Object data = loadDataForOffice(officeId); long dataLoadTime = System.currentTimeMillis() - startTime; generateReport(data, officeId); } Result: Avg. Data Load Time: 45s! DB Tool says: Avg. SQL Query: <1ms!
  • 38. #1: Loading too much data 24889! Calls to the Database API! High CPU and High Memory Usage to keep all data in Memory
  • 39. #2: On individual connections 12444! individual connections Classical N+1 Query Problem Individual SQL really <1ms
  • 40. #3: Putting all data in temp Hashtable Lots of time spent in Hashtable.get Called from their Entity Objects
  • 41. • … you know what code is doing you inherited!! • … you are not making mistakes like this  • Explore the Right Tools • Built-In Database Analysis Tools • “Logging” options of Frameworks such as Hibernate, … • JMX, Perf Counters, … of your Application Servers • Performance Tracing Tools: Dynatrace, Ruxit, NewRelic, AppDynamics, Your Profiler of Choice … Lessons Learned – Don’t Assume …
  • 42. Key Metrics # of SQL Calls # of same SQL Execs (1+N) # of Connections Rows/Data Transferred
  • 43. Backend Performance Architectural Mistakes with „Migrating“ to (Micro)Services
  • 44. 26.7s Execution Time 33! Calls to the same Web Service 171! SQL Queries through LINQ by this Web Service – request similar data for each call Architecture Violation: Direct access to DB instead from frontend logic
  • 45. 21671! Calls to Oracle 3136! Calls to H2 mostly executed on async background threads 33! Different connections used DB Exceptions on both Databases DB Exceptions on both Databases 40! internal Web Service Calls that do all these DB Updates
  • 46. Key Metrics # of Service Calls Payload of Service Calls # of Involved Threads 1+N Service Call Pattern!
  • 47. • Dynatrace • Ruxit • NewRelic • AppDynamics • Any Profiler that can trace across tiers • Google for Tracing or APM (Application Performance Management) Tooling
  • 48. Logging WE CAN LOG THIS!! LOG
  • 49. Log Hotspots in Frameworks! callAppenders clear CPU and I/O Hotspot Excessive logging through Spring Framework
  • 50. Debug Log and outdated log4j library #1: Top Problem: log4j.callAppenders -> 71% Sync Time #2: Most of logging done from fillDetail method #3: Doing “DEBUG” log output: Is this necessary?
  • 51. Key Metrics # of Log Entries Size of Logs per Use Case
  • 52. Response Time is not the only Performance Indicator Look at Resources as well
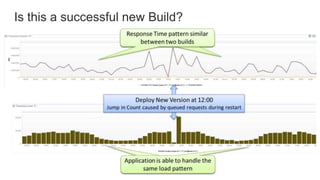
  • 53. Is this a successful new Build?
  • 54. Look at Resource Usage: CPU, Memory, …
  • 55. Memory? Look at Heap Generations
  • 57. Prevent: Monitor Memory Metrics for every Build
  • 58. #3: Growing “Old Gen” is a good indicator for a Mem Leak #4: Heavy GC kicks in when Old Generation is full! #5: Throughput of Application goes to 0 due to no memory available #1: Eden Space stays constant. Objects being propagated to Survivor Space #2: GC Activity in Young Generation ultimately moves objects into Old Generation
  • 59. Key Metrics # of Objects per Generation # of GC Runs Total Impact of GC
  • 60. Tips & Tricks And more Metrics of course 
  • 61. Tip: Layer Breakdown over Time With increasing load: Which LAYER doesn’t SCALE?
  • 62. Tip: Exceptions and Log Messages How are # of EXCEPTIONS evolving over time? How many SEVERE LOG messages to we write in relation to Exceptions?
  • 63. Tip: Failed Transactions Are more TRANSACTIONS FAILING (HTTP 5xx, 4xx, …) under heavier load?
  • 64. Tip: Database Activity Do we see increased in AVG # of SQL Executions over Time? Do TOTAL # of SQL Executions increase with load? Shouldn’t it flatten due to CACHES?
  • 65. Tip: Database History Dashboard How many SQL Statements are PREPARED? What’s the overall Execution Time of different SQL Types (SELECT, INSERT, DELETE, …)
  • 66. Tip: DB Connection Pool Utilization Do we have enough DB CONNECTIONS per pool?
  • 67. For more Key Metrics http://blog.dynatrace.com http://blog.ruxit.com
  • 68. We want to get from here …
  • 70. Use these application metrics as additional Quality Gates
  • 71. 71 What you currently measure What you should measure Quality Metrics in your CI # Test Failures Overall Duration Execution Time per test # calls to API # executed SQL statements # Web Service Calls # JMS Messages # Objects Allocated # Exceptions # Log Messages # HTTP 4xx/5xx Request/Response Size Page Load/Rendering Time …
  • 72. Connecting your Tests with Quality 12 0 120ms 3 1 68ms Build 20 testPurchase OK testSearch OK Build 17 testPurchase OK testSearch OK Build 18 testPurchase FAILED testSearch OK Build 19 testPurchase OK testSearch OK Build # Test Case Status # SQL # Excep CPU 12 0 120ms 3 1 68ms 12 5 60ms 3 1 68ms 75 0 230ms 3 1 68ms Test Framework Results Architectural Data We identified a regresesion Problem solved Exceptions probably reason for failed tests Problem fixed but now we have an architectural regression Problem fixed but now we have an architectural regressionNow we have the functional and architectural confidence Let’s look behind the scenes
  • 73. #1: Analyzing each Test #2: Metrics for each Test #3: Detecting Regression based on Measure
  • 75. Pull data into Jenkins, Bamboo ...
  • 76. Making Quality a first-class citizen „Too hard“ „we‘ll get round to this later“ „not cool enough“
  • 77. Questions and/or Demo Slides: slideshare.net/grabnerandi Get Tools: bit.ly/dttrial YouTube Tutorials: bit.ly/dttutorials Contact Me: [email protected] Follow Me: @grabnerandi Read More: blog.dynatrace.com
  • 78. Andreas Grabner Dynatrace Developer Advocate @grabnerandi http://blog.dynatrace.com

Editor's Notes

  • #2: More detailed stories can also be found on our blog: http://blog.dynatrace.com All examples have been found using Dynatrace Free Trial – http://bit.ly/dttrial
  • #3: Everyone has a SafeHarbor Statement – thats mine 
  • #4: Yes – I am working for a tool vendor – BUT – you can try this with most of the tools in the APM, Tracing, Diagnostics space out there.
  • #5: Your chance to leave now in case you think this session is about optimzing your java code by 0.01ms
  • #6: Its about looking at common performance metrics and trying to figure out why your application really doesnt scale or perform
  • #7: We will start at the frontend but spend most time on the backend. Its important though to look at both sides
  • #8: And that’s my professional background – and the reason why I think I have something to say about performance
  • #12: People send me data and I analyze it for them
  • #13: This is a sample of what I send people back -> thats the input to many stories I have to tell
  • #14: Based on my experience 80% of the problems are only caused by 20% problem patterns. And focusing on 20% of potential problems that take away 80% of the pain is a very good starting point
  • #15: Most of the problems can easily be identified by just looking at the right metrics. Most performance problems can also be found by looking at metrics while your app is not even under load -> a simple click through / functional / unit or integration test will do
  • #16: Lets start with the Frontend for all Web Developers
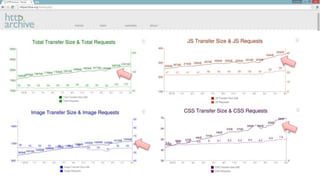
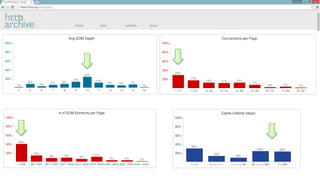
  • #17: http://httarchive.org – provides a good reference on how the top million websites in the world are constructed and whether they adhere to well known web performance best practices
  • #18: Especially interesting some of the advanced metrics like DOM Depth, Connections per Page or # of DOM Elements
  • #19: Here is an example I recently worked on – an online casino that had a very bad deployment coming up. Two metrics from WPO (Web Performance Optimization) that should have been seen in dev & test before releasing this to prod
  • #20: My all time favorite is the mobile landing page for a softdrink company during SuperBowl 2014 – 400+ individual images of selfie uploads aligned in a 20x20 grid. Pushed to my iPhone 4 in very high resolution causing 20MB data download and my phone to shrink each picture to be shown in a 20x20 grid on my small display
  • #21: Another common problem are individual very large images – or in this case a very large favicon which should normally only be a couple of bytes
  • #22: Or people forgetting to shrink their high resolultion images before putting it on public websites
  • #23: In case you didnt know – Hit F12 in your browser and you get all these metrics. Even better – you can automate that while running your browser driven tests
  • #27: Make sure deployments are done right – this is another example of pepsi having a certificate issue for some of their pages on the austrian website
  • #28: What everybody should have at least as a minimum is availability monitoring -> lots of free or cheap offerings out there to do that!!
  • #29: Use tools like Yslow to do the basic deployment checks
  • #30: You want to also avoid problems with your 3rd party or CDN providers – like in this case most images from Pepsi are not delivered by Amazons CDN
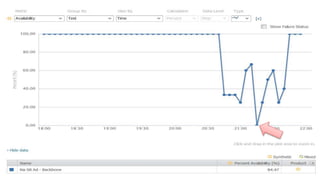
  • #31: If you depend on 3rd parties it is worth checking out whether these 3rd parties are always available -> helps you make the right decision when choosing between different providers -> look at their track record
  • #32: Lots of online outage services available
  • #33: If you have a peak period coming up – consider switching to an optimized landing page for that period – just as GoDaddy did during the SuperBowl.
  • #36: Now to the backend
  • #37: This story is from Joe – a DB guy from a very large telco arguing with his developers over performance problems of an online room reservation system which has evolved from a small project implemented by an intern to an application that is now used in their entire organization
  • #38: Devs buillt custom monitoring to proof their point! Contradicting what Joe‘s DB Tools had to say
  • #39: Reading this Transaction Flow showed what the real problem was: Loading Too Much Data from the Database causing High Memory Usage and therefore high CPU to cleanup the garbage
  • #40: Every SQL was executed on its on Connection
  • #41: The intern back then implemented its own OR Mapper by loading the full database content into a HashTable using individual queries
  • #44: Everybody seems to migrate to MicroServices -> but be aware of the common mistakes
  • #45: This is a monolithic app that was „migrated“ to microservices. The key use case is searching for sports clubs in a certain geographic area. A search that produces 33 search results used to take about 1s before „The Migration To MicroServices“. Now it takes 26.7s. AS you can see in the transaction flow there are many Issues: Architectural Violation, 1+N Query Problem but now between service calls as well as requesting too much static data redundantely from the database
  • #46: Another example with an even more dramatic impact on the infrastructure
  • #49: Thanks toi Splunk, Elastic Search and others we are able to analyze every log message we put out – but – does this really make sense?
  • #50: When logging becomes your performance issue -> misconfiguration of frameworks lead to CPU and I/O issues -> be aware of that!
  • #51: Wrong Log level and outdated log libraries can lead to serious performance impacts
  • #53: Now – response time should not be the only performance indicator
  • #54: Is this a successful deployment? If you look at Response Time and Throughput it is!
  • #55: But if CPU and Memory increases that dramatically it is NOT a good deployment -> this means a lot of extra costs!!
  • #56: Look at Heap Generations and Time spent in GC
  • #57: In this case it was a configuration mistake in their Dependency Injection Configuration. Objects got bloated causing more objects and larger objects on the heap
  • #58: If you dont monitor memory for every build you may need to go back in time – rerun all your tests for every build – to figure out what the change in configuratoin caused this problem
  • #59: Another classical Memory Leak and how easy it is to observe it! – In this case it was a memory leak in Tibco‘s Messaging Platform
  • #62: I love looking at Layers / APIs / Services -> if you have the chance to run a load test with slightly increasing load just monitor which of your APIs/Services/Methods behaviors „out of the norm“ -> thats your breaking point
  • #63: I always look at Exceptions vs Log Messages. Especially with frameworks such as Hibernate/Spring you can end up with a lot of „internal exceptions“ that impact performance but there is no „visible“ entry in any log file. Thats why I chart them and assume they correlate. If not – you know that something is wrong
  • #64: Same is true for Failed Requests vs. Load -> at which point does your app break and return HTTP 4xx, 5xx?
  • #65: Looking at Avg number of SQL Queries -> Do we have a data driven problem? Looking at Total # of SQL -> should show a flatten curve as we assume we can cache some of the data
  • #66: Are we preparing SQLs – how many INSERTS, UPDATES, DELETES -> do we have certain periods during the day when heavy REPORTS or clean up jobs run?
  • #67: Keep an eye on your pools. Not only Datbase but also Thread and network connectoin pools
  • #71: If you are automating your build pipeline you shoudl also automate your performance checks – find all these problems I just told you about
  • #72: Its about time to look at more than functionality – also look at whats „underneath the cover“
  • #73: If you do this you can simply let tools such as Dynatrace, NewRelic, AppDynamics, ... Analyze the code execution of your unit, integration or API tests and find any architectural regressions introduced by a code change
  • #74: This is how this can look like in a real life example. Analyzing Key Performance, Scalability and Architectural Metrics for every single test
  • #75: Viewing data number of bad quality tests per build
  • #76: And of course – bring it into Jenkins
  • #77: Help us make the world a better quality place so that you are not the one behind news like this 