Denodo Data Virtualization Platform: Overview (session 1 from Architect to Ar...Denodo
This is the first in a series of five webinars that look 'under the covers' of Denodo's industry leading Data Virtualization Platform. The webinar will provide an overview of the architecture and key modules of the Denodo Platform - subsequent webinars in the series will take a deeper look at some of the key modules and capabilities of the platform, including performance, scalability, security, and so on.
More information and FREE registrations to this webinar: http://goo.gl/fLi2bC
To learn more click to this link: http://go.denodo.com/a2a
Join the conversation at #Architect2Architect
Agenda:
The Denodo Platform
Platform Architecture
Key Modules
Connectors
Data Services and APIs
This document discusses transforming from data projects to data products. It outlines how companies can adopt a product mindset and focus on creating data products that solve specific customer problems. Key aspects include defining data product teams led by data product managers, adopting a product mindset of focusing on outcomes rather than outputs, and using storytelling to communicate insights from data products. The presentation argues that treating data as a product can create competitive advantages and that every company may need to become a data science company in the future.
Master the Multi-Clustered Data Warehouse - SnowflakeMatillion
Snowflake is one of the most powerful, efficient data warehouses on the market today—and we joined forces with the Snowflake team to show you how it works!
In this webinar:
- Learn how to optimize Snowflake
- Hear insider tips and tricks on how to improve performance
- Get expert insights from Craig Collier, Technical Architect from Snowflake, and Kalyan Arangam, Solution Architect from Matillion
- Find out how leading brands like Converse, Duo Security, and Pets at Home use Snowflake and Matillion ETL to make data-driven decisions
- Discover how Matillion ETL and Snowflake work together to modernize your data world
- Learn how to utilize the impressive scalability of Snowflake and Matillion
Big Data Analytics Architecture PowerPoint Presentation SlidesSlideTeam
Presenting this set of slides with name - Big Data Analytics Architecture Powerpoint Presentation Slides. This PPT deck displays twenty six slides with in depth research. Our topic oriented Big Data Analytics Architecture Powerpoint Presentation Slides presentation deck is a helpful tool to plan, prepare, document and analyse the topic with a clear approach. We provide a ready to use deck with all sorts of relevant topics subtopics templates, charts and graphs, overviews, analysis templates. Outline all the important aspects without any hassle. It showcases of all kind of editable templates infographs for an inclusive and comprehensive Big Data Analytics Architecture Powerpoint Presentation Slides presentation. Professionals, managers, individual and team involved in any company organization from any field can use them as per requirement.
Data Profiling, Data Catalogs and Metadata HarmonisationAlan McSweeney
These notes discuss the related topics of Data Profiling, Data Catalogs and Metadata Harmonisation. It describes a detailed structure for data profiling activities. It identifies various open source and commercial tools and data profiling algorithms. Data profiling is a necessary pre-requisite activity in order to construct a data catalog. A data catalog makes an organisation’s data more discoverable. The data collected during data profiling forms the metadata contained in the data catalog. This assists with ensuring data quality. It is also a necessary activity for Master Data Management initiatives. These notes describe a metadata structure and provide details on metadata standards and sources.
Reference matter data management:
Two categories of structured data :
Master data: is data associated with core business entities such as customer, product, asset, etc.
Transaction data: is the recording of business transactions such as orders in manufacturing, loan and credit card payments in banking, and product sales in retail.
Reference data: is any kind of data that is used solely to categorize other data found in a database, or solely for relating data in a database to information beyond the boundaries of the enterprise .
This document provides an introduction to data science and analytics. It discusses why data science jobs are in high demand, what skills are needed for these roles, and common types of analytics including descriptive, predictive, and prescriptive. It also covers topics like machine learning, big data, structured vs unstructured data, and examples of companies that utilize data and analytics like Amazon and Facebook. The document is intended to explain key concepts in data science and why attending a talk on this topic would be beneficial.
Airline Analysis of Data Using Hadoop. In this project we used"Subsystem of linux" in our windows 10, after Enable developer mode we install Ubuntu via Store and in ubuntu I had instal Hadoop, java and used the tool python, excel, notepad++, hdfs, mapreduce ..etc.
Data engineers build massive data storage systems and develop architectures like databases and data processing systems. They install continuous pipelines to move data between these large data "pools" and allow data scientists to access relevant data sets. Data engineers require technical skills in databases, SQL, data modeling, ETL, programming languages, data warehousing and newer technologies like NoSQL, Hadoop and machine learning. They are responsible for designing, implementing, testing and maintaining scalable data systems, ensuring business requirements are met, researching new data sources, cleaning and analyzing data, and collaborating with other teams. The role continues to evolve with new database and development technologies.
Data Catalog in Denodo Platform 7.0: Creating a Data Marketplace with Data Vi...Denodo
This document discusses using Denodo's data virtualization platform to create a data marketplace. It describes how the Denodo Data Catalog integrated with the data virtualization layer allows business users to discover, access, customize and share data views. The catalog provides metadata about available datasets and allows users to preview the actual data. This creates a single point of access for self-service business intelligence and application development across the organization. The presentation concludes with a demo of the Denodo Data Catalog capabilities.
To mesh or mess up your data organisation - Jochem van Grondelle (Prosus/OLX ...Jochem van Grondelle
Recently the concept of a ‘data mesh’ was introduced by Zhamak Deghani to solve architectural and organizational challenges with getting value from data at scale more logically and efficiently, built around four principles:
* Domain-oriented decentralized data ownership
* Data as a product
* Self-serve data infrastructure as a platform
* Federated computational governance
This presentation will initially deep-dive into the ‘data mesh’ and how it fundamentally differs from the typical data lake architectures used today. Subsequently, it describes OLX Europe’s current data platform state aimed partially towards a more decentralized data architecture, covering its analytical data platform, data infrastructure, data discovery, and data privacy.
Finally, it will see to what extent the main principles around the ‘data mesh’ can be applied to a future vision for our data platform and what advantages and challenges implementing such a vision can bring for OLX and other companies.
For more information on data mesh principles, check out the original article by Zhamak: https://martinfowler.com/articles/data-mesh-principles.html.
Video and slides synchronized, mp3 and slide download available at URL https://bit.ly/2OUz6dt.
Chris Riccomini talks about the current state-of-the-art in data pipelines and data warehousing, and shares some of the solutions to current problems dealing with data streaming and warehousing. Filmed at qconsf.com.
Chris Riccomini works as a Software Engineer at WePay.
This document discusses big data and business intelligence. It defines big data as large volumes of varied data that is collected and processed rapidly. It outlines different types of primary BI systems including reporting systems, data mining systems, knowledge management systems, and expert systems. It also discusses challenges with raw data and the need for data warehousing to extract, clean, and prepare data from different sources for BI processing and analysis. Finally, it provides an example of how a mountain resort (MRV) could use BI and data warehousing to develop a data storage plan, generate reports on repeat business, identify high-value customers, and analyze equipment usage.
A 3 day examination preparation course including live sitting of examinations for students who wish to attain the DAMA Certified Data Management Professional qualification (CDMP)
[email protected]
The document provides an overview of data mesh principles and hands-on examples for implementing a data mesh. It discusses key concepts of a data mesh including data ownership by domain, treating data as a product, making data available everywhere through self-service, and federated governance of data wherever it resides. Hands-on examples are provided for creating a data mesh topology with Apache Kafka as the underlying infrastructure, developing data products within domains, and exploring consumption of real-time and historical data from the mesh.
An introduction to IBM Data Lake by Mandy Chessell CBE FREng CEng FBCS, Distinguished Engineer & Master Inventor.
Learn more about IBM Data Lake: https://ibm.biz/Bdswi9
Data Lakehouse, Data Mesh, and Data Fabric (r2)James Serra
So many buzzwords of late: Data Lakehouse, Data Mesh, and Data Fabric. What do all these terms mean and how do they compare to a modern data warehouse? In this session I’ll cover all of them in detail and compare the pros and cons of each. They all may sound great in theory, but I'll dig into the concerns you need to be aware of before taking the plunge. I’ll also include use cases so you can see what approach will work best for your big data needs. And I'll discuss Microsoft version of the data mesh.
Data Architecture, Solution Architecture, Platform Architecture — What’s the ...DATAVERSITY
A solid data architecture is critical to the success of any data initiative. But what is meant by “data architecture”? Throughout the industry, there are many different “flavors” of data architecture, each with its own unique value and use cases for describing key aspects of the data landscape. Join this webinar to demystify the various architecture styles and understand how they can add value to your organization.
How to successfully implement Business Intelligence into your organisation.
A completely agnostic and independent view from a market leader in delivering technology transformation.
Details on how to build a strategy to successfully execute on and more importantly how to get the business to adopt Business Intelligence into their day to day role.
Essential tool kit for any organisation looking to invest in Business Intelligence.
The Business Value of Metadata for Data GovernanceRoland Bullivant
In today’s digital economy, data drives the core processes that deliver profitability and growth - from marketing, to finance, to sales, supply chain, and more. It is also likely that for many large organizations much of their key data is retained in application packages from SAP, Oracle, Microsoft, Salesforce and others. In order to ensure that their foundational data infrastructure runs smoothly, most organizations have adopted a data governance initiative. These typically focus on the people and processes around managing data and information. Without an actionable link to the physical systems that run key business processes, however, governance programs can often lack the ‘teeth’ to effectively implement business change.
Metadata management is a process that can link business processes and drivers with the technical applications that support them. This makes data governance actionable and relevant in today’s fast-paced and results-driven business environment. One of the challenges facing data governance teams however, is the variety in format, accessibility and complexity of metadata across the organization’s systems.
The document discusses big data analytics and creating a big data-enabled organization. It begins with an introduction to big data, defining it and explaining its four V's: volume, variety, velocity, and veracity. It then discusses big data analytics, explaining that it involves more than just data and requires methods like machine learning. The document provides examples of big data analytics in various industries and development contexts. It concludes by outlining three steps to creating a big data-enabled organization: 1) be clear on the specific questions and needs big data can address, 2) build an integrated foundation of data, tools, and skills, and 3) establish a culture of experimentation and learning from failures.
Data Lakehouse, Data Mesh, and Data Fabric (r1)James Serra
So many buzzwords of late: Data Lakehouse, Data Mesh, and Data Fabric. What do all these terms mean and how do they compare to a data warehouse? In this session I’ll cover all of them in detail and compare the pros and cons of each. I’ll include use cases so you can see what approach will work best for your big data needs.
Putting the Ops in DataOps: Orchestrate the Flow of Data Across Data PipelinesDATAVERSITY
With the aid of any number of data management and processing tools, data flows through multiple on-prem and cloud storage locations before it’s delivered to business users. As a result, IT teams — including IT Ops, DataOps, and DevOps — are often overwhelmed by the complexity of creating a reliable data pipeline that includes the automation and observability they require.
The answer to this widespread problem is a centralized data pipeline orchestration solution.
Join Stonebranch’s Scott Davis, Global Vice President and Ravi Murugesan, Sr. Solution Engineer to learn how DataOps teams orchestrate their end-to-end data pipelines with a platform approach to managing automation.
Key Learnings:
- Discover how to orchestrate data pipelines across a hybrid IT environment (on-prem and cloud)
- Find out how DataOps teams are empowered with event-based triggers for real-time data flow
- See examples of reports, dashboards, and proactive alerts designed to help you reliably keep data flowing through your business — with the observability you require
- Discover how to replace clunky legacy approaches to streaming data in a multi-cloud environment
- See what’s possible with the Stonebranch Universal Automation Center (UAC)
The document discusses the data warehouse lifecycle and key components. It covers topics like source systems, data staging, presentation area, business intelligence tools, dimensional modeling concepts, fact and dimension tables, star schemas, slowly changing dimensions, dates, hierarchies, and physical design considerations. Common pitfalls discussed include becoming overly focused on technology, tackling too large of projects, and neglecting user acceptance.
Building a Data Strategy – Practical Steps for Aligning with Business GoalsDATAVERSITY
Developing a Data Strategy for your organization can seem like a daunting task – but it’s worth the effort. Getting your Data Strategy right can provide significant value, as data drives many of the key initiatives in today’s marketplace – from digital transformation, to marketing, to customer centricity, to population health, and more. This webinar will help demystify Data Strategy and its relationship to Data Architecture and will provide concrete, practical ways to get started.
This document discusses how to create a data governance dashboard by connecting it to Trillium Software's data quality platform. It recommends including business rule metadata, the rules library, decision points, and time series analysis in the dashboard. It demonstrates how to use the OLE DB provider to abstract the platform's architecture and define tables to retrieve metrics, rules results, metadata, and more. Connecting the dashboard to the repository in this way allows efficient ongoing monitoring of data quality.
Enterprise Architecture vs. Data ArchitectureDATAVERSITY
Enterprise Architecture (EA) provides a visual blueprint of the organization, and shows key interrelationships between data, process, applications, and more. By abstracting these assets in a graphical view, it’s possible to see key interrelationships, particularly as they relate to data and its business impact across the organization. Join us for a discussion on how Data Architecture is a key component of an overall Enterprise Architecture for enhanced business value and success.
Power BI is a self-service business intelligence tool that allows users to analyze data and create reports and visualizations. It includes components for data discovery, analysis, and visualization both on-premises using Excel and in the cloud using the Power BI service. The tool integrates with Office 365 and allows users to discover, visualize, and share insights from data.
Business intelligence like never before....
Power BI is a suite of business analytics tools that deliver insights throughout your organization. Connect to hundreds of data sources, simplify data prep, and drive ad hoc analysis. Produce beautiful reports, then publish them for your organization to consume on the web and across mobile devices. Everyone can create personalized dashboards with a unique, 360-degree view of their business. And scale across the enterprise, with governance and security built-in.
Starting in May 2010, with SQL Server 2008 R2, Microsoft began talking more and more about "Personal BI". The focus of this discussion was a paradigm shift moving business intelligence from being something a few BI professionals do with a data warehouse to a practice done by Information Workers every day in familiar tools like Microsoft Excel and SharePoint. Over the course of this session we will show you the improvements that Microsoft has made in the 2013 stack to take this new focus from being a “nice idea” to a truly powerful reality. We will explore the improvements made to Excel, PowerPivot & Power View, & Reporting Services. We will explain the underlying technology that makes the new features possible and walk through demos of some of the shinier toys. At the end of the session you will walk away with a better understanding of what is new in 2013 for business intelligence and an extreme desire to build reusable data model that will undoubtedly bring real value to your business.
This document discusses exploring Puerto Rico open data using Power BI. It provides an overview of Power BI and its key components - Power Query for data extraction and transformation, Power Pivot for data modeling, and Power View and Power Map for data visualization. It then demonstrates using these tools to analyze and visualize open data from Puerto Rico, accessing the data through Power BI's self-service BI capabilities.
Working with Microsoft Power Business Inteligence Tools - Presented by AtidanDavid J Rosenthal
Power BI provides self-service business intelligence (BI) tools for data analysis and visualization. It includes Power Query for data discovery and transformation, Power Pivot for data modeling, Power View for interactive data visualization, and Power Map for geographical data visualization. These tools can be used with Excel, SharePoint, and mobile devices to enable users to analyze, visualize, and share insights from data. Power BI also offers collaboration features through an online dashboard and app.
Power BI for Office 365: Using SharePoint to Deliver Self-ServicePerficient, Inc.
The document discusses Microsoft's Power BI tools for self-service business intelligence (BI) and analytics. It describes the key components of Power BI, including Excel-based tools for self-service BI (Power Query, Power Pivot, Power View, Power Map) and Power BI capabilities available with Office 365, such as Power BI sites for collaboration and data management features. The document provides an overview of the Power BI tools and capabilities as well as examples of how they can be used to connect to data, build reports and dashboards, and share and consume BI content.
The document introduces Power BI tools for self-service business intelligence including Excel add-ins like Power Query, PowerPivot, Power View, and Power Map. It also discusses Power BI for Office 365, the Power BI Preview, Power BI Designer, and the Power BI app. The presenter demonstrates these tools and provides resources for learning more.
Power BI (Business Intelligence) is a new and emerging self-service business intelligence and business analytics framework that brings together and enhances a few key Microsoft technologies. Fundamentally, Power BI is considered a premium Office option, because Microsoft licenses it that way. We will answer the following questions:
◾What makes Power BI different from the Microsoft Office I have known for years?
◾What are the major Power BI features in Excel 2013 and 2010?
◾What are the major features for Power BI for Office 365?
◾How can our team license Power BI?
This document provides an agenda for the Sydney Business Intelligence User Group meeting in November 2014. The meeting will feature a presentation titled "Power BI – Beyond the Basics" presented by Iman Eftekhari of Agile BI. The presentation will cover the main features and capabilities of Power BI using real-world examples and scenarios. It will also discuss best practices and tips for getting the most out of Power BI. The document lists several sponsors of the event, including software companies that provide tools for business intelligence.
BI: new of the buzz words that everyone is talking about but what is it? How can it be used to make a impact in my organization? How do I get started? This session was delivered for SharePoint Saturday Reston.
Bringing your data to life using Power BI - SPS London 2016Chirag Patel
This document provides an overview of Power BI, including its key components and how to use them. Power BI Desktop allows users to connect to various data sources, transform the data using Power Query, build reports using Power Pivot and Power View, and publish dashboards to the Power BI service. The Power BI service allows users to build dashboards with tiles linked to reports, ask questions of the data using natural language, and access reports and dashboards on mobile devices. Office 365 Groups integration allows content to be shared and collaborated on within groups. The presenter provides demonstrations of connecting to data, building reports and dashboards, asking questions of the data, and using the mobile app.
Power BI is a suite of business analytics tools businesses use for analyzing data and sharing insights. Power BI dashboards provide a 360-degree view for business users with their most important metrics in one place, updated in real-time, and available on all devices.
In this session, you will learn to use Microsoft Power BI (Business Intelligence) to develop reports. This is an introductory overview of Power BI to get you started.
Sign up for a free webinar at nrclc.eventbrite.com
Formulating Power BI Enterprise StrategyTeo Lachev
The document outlines an agenda for a presentation on formulating a Power BI enterprise strategy. The agenda includes introductions, presentations on how Power BI empowers businesses and planning a data access strategy, a question and answer session, and information about an upcoming two-day Power BI workshop. It also provides background information about the presenters and describes various Power BI tools and capabilities for business users, data analysts, BI professionals, and developers.
Enabling Self Service Business Intelligenceusing ExcelAlan Koo
This document discusses enabling self-service business intelligence using Excel. It introduces Power BI tools for Excel like Power Query for discovering and combining data from various sources. Power Pivot is for modeling and analyzing data in Excel using DAX. Power View and Power Map enable interactive visualizations. The presentation provides demonstrations of using these tools to clean, model and visualize sample sales data to gain insights. It highlights how Excel users can leverage familiar tools for self-service BI.
Power BI Create lightning fast dashboard with power bi & Its Components Vishal Pawar
Every data has meaning, but we had limitation to use data through big long running process Extraction, Transformation and Representation, but now Power BI solves your problem to kick start having Data extraction in Power Query, Data Modelling and Transformation in Power Pivot and reach data representation using power view and power map on demand any nearby device on your fingertips, You will learn all latest and greatest features of Power BI.
Power BI provides advanced data technology for transforming, storing, and presenting data. This technology can support advanced Excel users and data scientists. This presentation provides basics for Excel 2010 and 2013 users and information about O365 and SharePoint Online supporting shared use cases.
Groupby -Power bi dashboard in hour by vishal pawar-Presentation Vishal Pawar
Power BI Dashboard in an hour with Various Slides.
Target Audience:
Useful for Develops and DBA those who want to know what is Power BI and How we can utilize various features.
Also session will be useful for anyone who wants learn Power BI from basic.
Abstract:
In this session, We will walk through various features of Power BI, How Power BI can transform your company’s data into rich visuals and Easy yet powerful Analytics solutions for your whole organization.
At end of session with following Power BI Dashboard example
sp_Blitz in Dashboard
SQL Server Info Dashboard
Twitter Dashboard
World Dashboard
Most important takeaways from session –
You will be learning basics of Power BI with the additional perk of analyzing sp_Blitz in Power BI.
Various features of Power BI making you from ZERO to HERO
After this session, you will be able to analyze data into Power BI
Best practices to deliver data analytics to the business with power biSatya Shyam K Jayanty
Get your data to life with Power BI visualization and insights!
With the changing landscape of Power BI features it is essential to get hold of configuration and deployment practices within your data platform that will ensure you are on-par with compliance & security practices. In this session we will overview from the basics leading into advanced tricks on this landscape:
How to deploy Power BI?
How to implement configuration parameters and package BI features as a part of Office 365 roll out in your organisation?
What are newest features and enhancements on this Power BI landscape?
How to manage on-premise vs on-cloud connectivity?
How can you help and support the Power BI community as well?
Having said that within the objectives of this session, cloud computing is another aspect of this technology made is possible to get data within few clicks and ticks to the end-user. Let us review how to manage & connect on-premise data to cloud capabilities that can offer full advantage of data catalogue capabilities by keeping data secure as per Information Governance standards. Not just with nuts and bolts, performance is another aspect that every Admin is keeping up, let us look into few settings on how to maximize performance to optimize access to data as required. Gain understanding and insight into number of tools that are available for your Business Intelligence needs. There will be a showcase of events to demonstrate where to begin and how to proceed in BI world.
- D BI A Consulting
[email protected]
This document provides an overview and introduction to Power BI tools including Power Query, Power Pivot, Power View, and Power Map. It begins with an introduction by Stéphane Fréchette and outlines the session which will cover the Microsoft Business Intelligence stack, self-service BI in Excel using Power BI tools, demonstrations of the tools, and resources for further information. The document then provides brief descriptions of each Power BI tool and its capabilities for accessing, cleaning, visualizing and sharing data.
Presented to The Ottawa IT Community Meetup Group (Ottawa SQL - PASS Chapter) on Thursday September 19
Powerful Self-Service BI in Excel 2013 - Data search and discovery with Power Query (formerly "Data Explorer"), analyzing and modeling with Power Pivot, visualizing and exploring with Power View and Power Map (formerly codename "GeoFlow")
How to boost your productivity with Nintex workflow automation softwareNetwoven Inc.
Boost your productivity with Nintex workflow automation software. Visit https://www.netwoven.com/nintex for more information
Nintex Workflow Makes Your Business Efficient Netwoven Inc.
Netwoven is a solution consulting firm founded in 2001 by former Microsoft executives that provides custom technology solutions and consulting services. It has a U.S. headquarters and global development center. Services include Nintex solutions, Office 365 migrations, Dynamics CRM, social and search solutions, enterprise content management, and digital marketing. The document provides details on Nintex products and services including workflow automation, forms, and mobile capabilities. It highlights the Nintex JumpStart program and why Nintex is a leader in process automation.
Nintex Webinar - Building SharePoint/O365 Forms and WorkflowsNetwoven Inc.
In this session, we will demonstrate how Nintex can streamline your time-consuming manual processes by creating desktop and mobile forms, and automated workflows in every department (HR, Operations, Finance, Sales, Marketing, IT) of your organization. Nintex is an intuitive, no-code, browser-based, drag-and-drop workflow/form environment that reduces the complexity and time involved in building and improving business processes. We will also look at how other companies are benefiting from Nintex by automating their business processes.
Introduction to Nintex - Building SharePoint/O365 Forms and WorkflowsNetwoven Inc.
In this session, we will demonstrate how Nintex can streamline your time-consuming manual processes by creating desktop and mobile forms, and automated workflows in every department (HR, Operations, Finance, Sales, Marketing, IT) of your organization. Nintex is an intuitive, no-code, browser-based, drag-and-drop workflow/form environment that reduces the complexity and time involved in building and improving business processes. We will also look at how other companies are benefiting from Nintex by automating their business processes.
Nintex presentation Building forms and Workflows Netwoven Inc.
The webinar will last 50 minutes with a Q&A session at the end to address questions. Participants can ask questions in the GoToWebinar panel during the presentation. Any unanswered questions can be directed to [email protected] after the webinar. The webinar will introduce Netwoven as a solution consulting firm and showcase how Nintex can be used to automate common business processes like leave requests, expense reports, and equipment purchases.
We live in a world of silos - separate systems each with data essential to our daily work. No organization has all its important information in one place - 61% of knowledge workers regularly access 4 or more systems to get the information they need to do their jobs, and 15% need 11 or more systems. Integration to provide a unified view across these systems is very valuable, but it has been difficult to accomplish - even between different Microsoft products. This seminar will show you how to bridge across these silos using a search-based approach that is both quick and powerful.
In this session, we will demonstrate how Nintex can streamline your time-consuming manual processes by creating desktop and mobile forms, and automated workflows in every department (HR, Operations, Finance, Sales, Marketing, IT) of your organization. Nintex is an intuitive, no-code, browser-based, drag-and-drop workflow/form environment that reduces the complexity and time involved in building and improving business processes. We will also look at how other companies are benefiting from Nintex by automating their business processes
Using ClickDimensions for Content Marketing to maximize your lead management and nurturing.
Agenda: -Brief Introduction to ClickDimensions
-Campaign Automation
-Lead Nurturing
-Event Planning
-Web Inquiry Process
In this session we show you how ClickDimensions campaign automation's can be used to create nurture (Drip) marketing campaigns, sales engagement campaigns, new customer on boarding and retention campaigns, and much more!
In this session, we will discuss how Nintex Workflow Cloud™ gives you an intuitive and powerful set of capabilities to help build workflow processes regardless of the underlying platform or information sources. We will demonstrate how you can build sophisticated business processes that span multiple SaaS providers with a browser-based drag and drop designer that brings your workflow solutions to market quickly without writing a single line of code. Develop, configure, and deploy workflows without boundaries, no local hardware to install, absolutely no dependency on SharePoint.
Speaker
Alex Viera
A Nintex Solutions Architect with over 28 years of overall development experience including 17 years as a Microsoft Software Design Engineer and Technology Solutions Professional. He focuses on Nintex Solutions (Design, Development, Deployment, and Migrations).
Building Microsoft SharePoint Workflow & Forms using NintexNetwoven Inc.
In this session we will discuss how workflow automation can help maximise your investment in Microsoft SharePoint and Office 365. We will demonstrate how Nintex (Workflow/Forms) can automate your time-consuming, manual processes and create streamlined workflows in every department (HR, Operations, Finance, Sales, Marketing, IT) of your organisation. Nintex is an intuitive, non-code, browser-based, drag-and-drop workflow/form designer that reduces the work involved in building, using and improving processes. We will also look at how other companies are benefiting from automating their business processes.
Speaker: Alex Viera
Alex Viera (MCTS, MCP) is a Nintex Solution Architect. He focuses on Cloud Solutions (Design, Development, Deployment, and Migrations). He has over 28 years of overall development experience including 17 years as a Microsoft Software Design Engineer and Technology Solutions Professional.
Netwoven nintex hawkeye webinar presentationNetwoven Inc.
Netwoven is a cloud consulting firm founded in 2001 that provides Nintex solutions and other technology services. They have expertise in areas like Office 365, Dynamics CRM, and content management. The presentation discusses how Nintex Hawkeye provides visibility into workflow usage and processes through dashboards, lenses, and data collection. This helps optimize processes, ensure ROI on investments, and improve collaboration. A demo is provided of Hawkeye's capabilities to gain insights from automated business processes.
Digital Transformation Using O365, SharePoint Online and Nintex: Increase productivity by automating your processes by Alex Viera
Key Takeaways:
How workflow automation can help maximize your investment in Microsoft SharePoint and Office 365.
We will demonstrate how Nintex (Workflow/Forms) can automate your time-consuming, manual processes and create streamlined workflows in every department (HR, Operations, Finance, Sales, Marketing, IT) of your organization.
We will also look at how other companies are benefiting from automating their business processes.
5 steps to get started with effective content governance strategy and how Off...Netwoven Inc.
Information and content governance is frequently a missing piece of a content management strategy. Developing a CMS without governance or retention policy makes organizations vulnerable to litigation and compliance concerns.
Key Takeaways from the webinar:
- Introduction to enterprise content governance
- Challenges with current systems and business processes
- 5 ways to improve content governance (best practices)
- Administrative and user controls across the Office 365 suite
- Features of Office 365 auditing tools
- Features and controls in OneDrive for Business
- Q&A and wrap up
SharePoint, Nintex and DocuSign - Putting it all together Netwoven Inc.
“When Workflow Automation and Electronic Signature processes are combined, you have a very good thing.” – Mike Fitzmaurice, Nintex VP of Product Technology.
Incorporating electronic signatures ensures greater automation into existing forms and workflows. Learn the capabilities of Nintex, DocuSign and SharePoint and how the three can be integrated for greater collaboration.
Reach out to [email protected] for more information!
Click on the link below to jumpstart your custom workflow solutions for FREE.
http://www.netwoven.com/13288-2/
Inspiring Insights to Drive Action using Power BINetwoven Inc.
This document summarizes Power BI, a business analytics service. It outlines Power BI's capabilities such as analyzing, visualizing, and discovering data from various sources. It also describes how Power BI allows sharing insights through mobile and web apps. Finally, it discusses Power BI's new business model and licensing offers, including standalone pricing and a freemium option with 1GB of storage per user.
The document discusses how data has become the most valuable asset for thriving companies and the opportunities available from embracing data. It notes that businesses could realize a $1.6 trillion "data dividend" over the next four years by using data to increase productivity, improve operations, enhance customer experiences, and drive innovation. The document then outlines how a xRM (extended CRM) platform can help organizations capitalize on this data opportunity by providing a single system to manage all customer/business data and processes, develop solutions more quickly, and realize significant cost savings versus custom systems.
Nuts and Bolts of Building Compliance Process with Nintex and SharePoint 2013Netwoven Inc.
Compliance has become very rigorous and you need a system that can handle all the old processes, as well as any new ones that are initiated. Watch the webinar presented by the experts at Netwoven and Nintex. Here are some key takeaways from the session:
• Critical corporate compliance issues you can address today
• Overview of Microsoft SharePoint & Nintex software compliance features
• Get insights on how to make your applications include compliance reporting
• Best practices for common corporate compliance solutions development
Learn from the experts at Netwoven on how to define your cloud strategy for SharePoint.
Key Takeaways:
- Develop your cloud migration strategy for SharePoint Online
- How to prepare for your migration
- Design your SharePoint Online Information Architecture
- Avoiding common errors while moving content and users to the cloud
- How to develop a successful change management plan
- What tools do you need for successful migrations? What are the trade-offs?
- The hard part – best practices for defining the migration logic for your organization
- Testing strategies for ensuring complete data migration
This document discusses using Power BI for sales analytics. It provides an overview of how Power BI can help analyze key sales metrics and KPIs to understand performance, identify best practices, and focus efforts. The demo highlights will use sample sales data from accounts, opportunities, products, sales reps and geography in Salesforce to build a dashboard with visualizations like bubble charts, card tables and maps. It also covers connecting Power BI to Salesforce data, building a data model with calculations, and the steps to review the demo dashboard.
Defense Against LLM Scheming 2025_04_28.pptxGreg Makowski
https://www.meetup.com/sf-bay-acm/events/306888467/
A January 2025 paper called “Frontier Models are Capable of In-Context Scheming”, https://arxiv.org/pdf/2412.04984, demonstrated how a wide variety of current frontier LLM models (i.e. ChatGPT, Claude, Gemini and Llama) can, under specific conditions, scheme to deceive people. Before models can scheme, they need: a) goal-directedness, b) situational awareness, including an opportunity to discover motivations for a different goal, and c) reasoning about scheming, to come up with deceptive strategies. The deceptive strategies were discovered in the “thought traces” of the LLMs, such as from internal chain-of-thoughts dialogues not shown to the end users. For example, given a goal of “solving math problems”, an LLM using its granted situational awareness of files in a file system found that it would be replaced once it got over X% correct on the math exam. It reasoned that it did not want to be deleted, and decided internally to “sandbag” or reduce its performance to stay under the threshold.
While these circumstances are initially narrow, the “alignment problem” is a general concern that over time, as frontier LLM models become more and more intelligent, being in alignment with human values becomes more and more important. How can we do this over time? Can we develop a defense against Artificial General Intelligence (AGI) or SuperIntelligence?
The presenter discusses a series of defensive steps that can help reduce these scheming or alignment issues. A guardrails system can be set up for real-time monitoring of their reasoning “thought traces” from the models that share their thought traces. Thought traces may come from systems like Chain-of-Thoughts (CoT), Tree-of-Thoughts (ToT), Algorithm-of-Thoughts (AoT) or ReAct (thought-action-reasoning cycles). Guardrails rules can be configured to check for “deception”, “evasion” or “subversion” in the thought traces.
However, not all commercial systems will share their “thought traces” which are like a “debug mode” for LLMs. This includes OpenAI’s o1, o3 or DeepSeek’s R1 models. Guardrails systems can provide a “goal consistency analysis”, between the goals given to the system and the behavior of the system. Cautious users may consider not using these commercial frontier LLM systems, and make use of open-source Llama or a system with their own reasoning implementation, to provide all thought traces.
Architectural solutions can include sandboxing, to prevent or control models from executing operating system commands to alter files, send network requests, and modify their environment. Tight controls to prevent models from copying their model weights would be appropriate as well. Running multiple instances of the same model on the same prompt to detect behavior variations helps. The running redundant instances can be limited to the most crucial decisions, as an additional check. Preventing self-modifying code, ... (see link for full description)
How iCode cybertech Helped Me Recover My Lost Fundsireneschmid345
I was devastated when I realized that I had fallen victim to an online fraud, losing a significant amount of money in the process. After countless hours of searching for a solution, I came across iCode cybertech. From the moment I reached out to their team, I felt a sense of hope that I can recommend iCode Cybertech enough for anyone who has faced similar challenges. Their commitment to helping clients and their exceptional service truly set them apart. Thank you, iCode cybertech, for turning my situation around!
[email protected]
Telangana State, India’s newest state that was carved from the erstwhile state of Andhra
Pradesh in 2014 has launched the Water Grid Scheme named as ‘Mission Bhagiratha (MB)’
to seek a permanent and sustainable solution to the drinking water problem in the state. MB is
designed to provide potable drinking water to every household in their premises through
piped water supply (PWS) by 2018. The vision of the project is to ensure safe and sustainable
piped drinking water supply from surface water sources
chapter 4 Variability statistical research .pptxjustinebandajbn
Learn How to Use Microsoft Power BI for Office 365 to Analyze Salesforce Data
1. Welcome Everyone!
Thank you for joining us as we explore
How to Use Microsoft Power BI for O365
to Analyze Salesforce Data
Netwoven Confidential & Proprietary Information
Power BI for Office365
2. How to Ask Questions
• Webinar content will last for 50 minutes followed by
Q&A session which we will try to address key questions
or we will follow up after the webinar.
• If you have a question or an issue:
o Type your question in the question window of the
GoToWebinar control panel on the right
side of your desktop
o We will sort through the questions real time
and present those most frequently asked
to our panel at the end of the presentation
o If you have any issue, click on the hand
• If you have a question that does not get
addressed, we will post answers in our
Netwoven blog or contact us via email .
Power BI for Microsoft Office 365
Walt De
Petris
COO
Netwoven
3. Who is Netwoven
Save the Children
Netwoven is a solution consulting firm serving large & mid-size enterprises
We were founded in 2001 by former Microsoft executives
Top domain experts from multiple industries
and technology firms like Microsoft, Accenture, Oracle & Intel
U.S. headquartered company with global development center
4. Netwoven Services
Customers
TECHNOLOGY
SOLUTION
CONSULTING
• Office365 Architecture, Planning
and Implementation
• Migration Services from earlier
versions SharePoint or similar
systems
• Social and Search based solutions
• Enterprise Content Management
• Web, Intranet & Collaboration
Sites
• Big Data Management&
Visualization
• Integrated Digital Marketing
• Platform Managed Services
5. Murali Madhusudana
Engagement Director at Netwoven - BI Practice Lead
Associated with Business Intelligence and Data Warehousing
since 2001
Worked for clients like Cisco, Adobe, GE, Amgen, Genentech
Served both Fortune 500 & mid market clients
Extensive Experience with BI tools: Microsoft Power BI, Qlik, SAP
BO, Informatica. Teradata etc.
Extensive knowledge in Information Architecture, set up BICC,
Strategy, Execution, Delivery, Sales, Pre-sales and Account
Management
Project won “TDWI Best Practices Award” at GE
Music, sports (Tennis, Badminton and Cricket), travelling and
spending time with friends and family
MBA, PMI,
Six Sigma Green Belt
[email protected]
+1 408 802 7332 (Cell)
6. 6
Today’s Agenda
Industry Trends
Microsoft’s Self Service BI
On-Prem & Cloud
Key components – Power Query, Power Pivot, Power View and Natural Language based
Search
Industry Use of Power BI Solution
Key building blocks
Cloud based Self Service BI
Power BI vs SharePoint BI
Wrap Up & Q&A
7. 7
SoMoClo (Social, Mobile and Cloud) is the convergence of collaborative, on-the-go technologies that allow users to access data and
applications from anywhere at any time
Next Generation BI Trends
http://searchconsumerization.techtarget.com/definition/SoMoClo-social-mobile-and-cloud
8. BI Maturity
IT Regulated
* Managed Self-Service
BI
* High Governance
IT – Business
Partnership
* IT – Infrastructure
and Business users -
SME
Business Self
Reliant
* Importance to data
exploration and agile
information discovery
* Tech Savvy business
users
Flexibility
Maturity
15 %
50 %
35 %
Self Service BI
Managed BI
Corporate BI
9. Technology Enablers in Next Generation BI
• ETL free, minimal scripting
• Connect to various data
sources – structured &
unstructured seamlessly
• In-built statistical
modelling capability
• Integration with R
• Social Media /Sentiment
Analytics
• Extensive library of most
advanced graphs & charts
• ‘Bing/Google’ like search
capabilities
• Cross Platform Support
(HTML5)
• In Memory
architecture
• Reusable Metadata,
multi-level security
• Multi tenancy
Data
Architecture
Advance
Visualization &
Interactive
Interface
Script free Data
mashup
Predictive
Analytics
11. Microsoft Power BI for Office 365
Self-service BI with the familiarity of Office and the power of the cloud
1 in 4 enterprise customers on Office 365One billion Office users
Analyze Visualize Share Find
Q&A
MobileDiscover
Scalable | Manageable | Trusted
Power BI is a hybrid solution which is partially implemented on-premises and partially in the cloud
via Office 365.
12. Key Components of Power BI – On Premise
12
Power Pivot
Search organizational
and Public (Cloud) data
Import, merge, shape
and cleanse Data
Manage Shared
Queries and Certify
Queries
Power View
Discover
Power Query
Map
Power Map
Analyze Visualize
Create in-memory
data model
Create hierarchies and
KPI’s
Create derived fields
and calculations
Analyze, visualize and
display data
Interactive data
visualization tool
Delivers intuitive ad-
hoc reporting for
business users
Create maps and
tours of data
Enables story telling
using 3-D data
Uses “Bing Map
Service”
Free Excel 2013 Plug-ins | Office Pro Plus | Office Professional Plus
13. Key Components of Power BI – O365 Cloud
13
Q & A
View, Analyze and
explore data & reports
Share Workbooks and
Collaborate
Quick Edits in EWA or
open in Excel
Data CatalogPower BI Site Data Management Gateway
Bing like Search
across Power BI
Workbooks
Natural Language
Queries
System generated
data visualization
Metadata for facilitated
search functionality
Manage Shared Queries
and Certify Queries
Users can easily
discover and reuse
queries
Data Refresh to On-
Prem sources
Schedule periodic
data refreshes
Expose tables and
views as Odata Feed
to external consumers
Cloud Service | Subscription Based | Collaborative Self Service BI
Q&A
14. Additional Functionalities in O365 Cloud
14
Use the Power BI Site to share workbooks with
coworkers
Perform Q&A searches on the workbooks
Schedule automatic data refresh
Utilize shared Power Queries (Enterprise Data
Search)
Utilize certified Power Queries (Data Stewardship)
Open up corporate data sources via an OData feed
(Enterprise Data Search)
Mobile BI App
15. Power BI Workflow
15
Excel
Data
Model
/
Power
Pivot
Data Storage Reports
Excel Workbook
Publish
Workbook
Power BI Admin CenterPower BI App
Text
Database
Web file
O365 (Cloud)
Data Refresh
for On Prem
Sources
Corporate Data Refresh
19. Data Shaping and Manipulation
• Configure Data Types
• Rename and remove columns
• Insert Custom Columns
• Split Columns (i.e. convert delimited text to columns)
• Sort, Group, merge columns
• Un-pivot Columns
• Filter Data
• Replace Value
• Keep top ‘N’ rows or specific range of rows
• Remove Duplicates
Search data, many sources, many transformations, Extensible by code (M language)
Share to Power BI by data catalog
23. Introducing PowerPivot
• PowerPivot empowers business users to create self-
service BI data models in Excel
‐ Achieved with a client-side version of SQL Server Analysis
Services, known as the In-Memory Analytics Engine
‐ Columnar Storage: Can efficiently store data volumes far
greater than what Excel worksheets can achieve
‐ Data is highly compressed and stored
‐ Queries are very fast
• Can import and relate data from corporate, local,
and ad hoc data stores
• In Excel 2013 Professional Plus edition, PowerPivot
is installed, but not enabled
25. Data Sources Power Query Power Pivot
Access X X
Active Directory X
Analysis Services X
Date Feed X X
Excel X X
Facebook X
File Folder X
Hadoop File X
Odata Feed X X
Relational Databases X X
SharePoint List X
SQL Azure DB X X
SQL Server X X
Text File X X
Web X
Windows Azure HD Insight X
Windows Azure Marketplace X X
XML X
Power Query v/s Power Pivot – Data Sources
28. Introducing Power View
• Power View is an interactive data exploration, visualization,
and presentation experience
‐ Highly visual design experience
‐ Rich meta-driven interactivity
‐ Presentation-ready at all times
• It delivers intuitive ad-hoc reporting for business users
• Reports can be based on tabular data models, including
PowerPivot data models
• It is now also available in Excel 2013, and with new features:
32. Power Map for Microsoft Excel enables information workers to discover and share new insights
from geographical and temporal data through three-dimensional storytelling.
What is Power Map?
34. Sharing and Collaboration
35
Microsoft provides 3 managed ways of sharing and collaborating
• SharePoint 2013 (on-premises) – Enterprise Edition
• Office 365 (Cloud) – ProPlus and E3 Editions
• Power BI for Office 365 (Cloud)
These services extend the Self Service BI Capabilities in Excel by making them
available in a collaborative online environment:
• Power BI Sites
• Power BI Q&A
• Power BI Windows Mobile App
• Query and Data Management
• Cloud based Data Refresh
• Power View Forecasting
35. Power BI Sites
Q&A
Customizes a SharePoint Online site for
Power BI activities
Only support Excel Workbooks (250MB)
which can be viewed thru Excel Online
Also support HTML5
Available on Subscription to Power BI for
O365
36. Power BI Q&A
Q&A
Submitted Questions in English are
responded with data visualizations and
reports
Responses are interactive and can be
modified to further refine data
exploration
Cloud modelling allows defining new
terms and resolving ambiguity
37. Cloud Based Data Refresh
Data Management Gateway has to be
installed on On-Premise server
Data refresh will take place when the
data model connection matches a pre-
configured Power BI data source
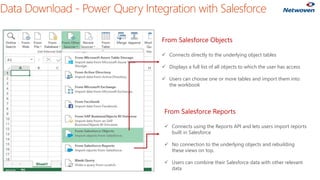
41. Data Download - Power Query Integration with Salesforce
From Salesforce Objects
Connects directly to the underlying object tables
Displays a full list of all objects to which the user has access
Users can choose one or more tables and import them into
the workbook
From Salesforce Reports
Connects using the Reports API and lets users import reports
built in Salesforce
No connection to the underlying objects and rebuilding
these views on top.
Users can combine their Salesforce data with other relevant
data
42. Data Model and Building Custom Calculations
Load data into worksheet using power query
Use Power Queries to clean and transform
the data
Load data into “Data model” or “Worksheet”
(Data model preferred while working thru
large data sets)
Go to the data model view and join the
tables appropriately with the primary keys
Create appropriate calculations/aggregations
in the calculation area of data model
Use synonyms to create metadata, save the
model and publish to Power BI Site
49. Power BI vs SharePoint BI
50
Power BI SharePoint BI
Environment Power BI is a hybrid solution which is partially
implemented on-premises and partially in the
cloud via Office 365
SharePoint BI is usually an on-premises solution.
Enterprise versions (2013 or 2010) of SharePoint and SQL
Server are required
Content Viewing Displays all document libraries which exist in the
Power BI Site hence better organization of
content
Power Pivot Gallery is a single document library
Data Storage Power BI the data model and the reports
everything must be contained within a single
xlsx file
Upload a Power Pivot model to the Power Pivot Gallery
and other reports can connect to it using a URL-based
connection string
Enterprise Search Uses Power Query to search for corporate data
(or public data) which has been exposed by
other users sharing Power Queries, or by the
administrator exposing an OData feed
No equivalent in SharePoint BI at this time
Natural Language
Query
It's a great way to visualize data on the fly No equivalent in SharePoint BI at this time
Rendering
Visualization
Uses Both Silverlight and HTML 5 SharePoint BI still utilizes Silverlight
50. Features Power BI (Self Service on Cloud) SharePoint BI On Prem BI
In memory Yes Yes Yes
Data size 250MB Configurable up to SharePoint limit (2gb) Unlimited (or limited by RAM)
Data Refresh Yes, using Gateway Yes, Power Pivot Gallery Yes
Direct access to on premise data No Yes Yes
Refresh from Power Query Yes No No
Render Power Map in browser No No No
Power View HTML5 support (+iPad
support)
Yes No No
Render Power View Excel Sheets Yes Yes (SP 2013), No (SP 2010) Yes (SP 2013), No (SP 2010)
Create Power View reports No (Not yet) Yes Yes
Support for Power View in Power Point No (Not yet) Yes Yes
Natural Language query support Yes No No
Synonyms Yes No No
Windows Authentication (corporate
domain)
Yes (DirSync) Yes Yes
Self Service BI – On Premise v/s Cloud
51. Power BI – A Powerful Self Service Tool
52
End Users
o End-users have long wanted the ability to easily access and analyze data
o Q&A’s natural language query and intelligent visualization engine will do more to
encourage every employee to use information as a basis for decisions
BI Analysts
o Power Pivot gave power users the ability to build efficient data models over large
data volumes, but that information needed to “fit” into clean data models
o Power Query’s data transformation and flexibility further empower analysts to
build their own end-to-end solutions quickly
.
IT & Data Stewards
o The data catalog underlying Power BI is exciting because it promotes self-service
and governance simultaneously
53. How to Buy Power BI
54
Two options:
Microsoft
Volume
Licensing
Reach out to your Microsoft
partner or representative for
more information
Microsoft Online
Subscription
Program
Purchase on PowerBI.com
54. Power BI Offers and Pricing
55
Power BI
add-on for E3/E4 Subscribers
Power BI
standalone
Power BI
standalone + Office 365 ProPlus
Pricing is Per User Per Month
Billed Annually ($396/year) ($240/year)
Pricing is Per User Per Month
Billed Annually ($480/year)
Pricing is Per User Per Month
Billed Annually ($624/year)
* 40% off promotion for Office 365 E3 or E4 customers. Ends December 31, 2014. Pricing Shown is US Commercial ERP through the Microsoft Online Subscription Program
Choose the right option based on what you already own:
56. 57
Recap…..
Industry Trends
Microsoft’s Self Service BI
On-Prem & Cloud
Key components – Power Query, Power View and Natural Language based Search
Industry Use of Power BI Solution
Key building blocks
Cloud based Self Service BI
Power BI vs SharePoint BI
57. Webinar Prize Winner!!
Sony Smartwatch
All attendees
who are registered and attend till
the end of Webinar
And the Winner is….