SlideShare a Scribd company logo
Measurement Scale:Measurement Scale:
Dr. Akhlas AhmedDr. Akhlas Ahmed
Greenwich UniversityGreenwich University
Lecture # 03, July 11Lecture # 03, July 11thth
20142014
(Makeup Class)(Makeup Class)
Data Collection:Data Collection:
 Data Collection is an important
aspect of any type of research study.
 Inaccurate data collection can
impact the results of a study and
ultimately lead to invalid results.
DATA COLLECTION…
 Plural from datum.
 Data are individual piece of information. It is
a set of values of qualitative or quantitative
variables.
 Data are typically the results of
measurements and can be visualized using
graph or images.
 Data as an abstract concept can be viewed as
the lowest level of abstraction, from which
information and then knowledge are derived.
DATA…
 The term research data refers to data
in any format or medium that relate to
or support research, scholarship, or
artistic activity.
RESEARCH DATA…
 Raw or primary data is called unprocessed
data which refers to a collection of numbers,
characters.
 Data processing commonly occurs by stages,
and the "processed data" from one stage may
be considered the "raw data" of the next.
 Examples: Information when recorded as
notes, images, video footage, paper surveys,
computer files, etc., pertaining to a specific
research project.
RAW OR PRIMARY DATA….
 Analyses, descriptions, and conclusions
prepared as reports or papers are called
processed data.
 Data in computing (or data processing)
are represented in a structure that is often
tabular (represented by rows and
columns), a tree (a set of nodes with
parent-children relationship), or a graph (a
set of connected nodes).
PROCESSED DATA…
 Information distributed to people
beyond those involved in data
acquisition and administration.
PUBLISHED DATA…
 Field data refers to raw data that is
collected in an uncontrolled in situ
environment.
FIELD DATA….
 Experimental data refers to data that
is generated within the context of a
scientific investigation by observation
and recording.
EXPERIMENTAL DATA…
 Experimental data refers to data that
is generated within the context of a
scientific investigation by observation
and recording.
INFORMATION…
 Data, information and knowledge are
closely related terms, but each has its own
role in relation to the other.
 Data are collected and analyzed to create
information suitable for making decisions,
 while knowledge is derived from
extensive amounts of experience dealing
with information on a subject.
KNOWLEDGE….
 Data collected by the investigator
conducting the research.
 Example:
PRIMARY DATA…
Data collected by someone other than the user like census,
organizational records etc.
 Data collected through quantitative research as census,
housing, social security as well as electoral statistics and other
related databases. Data collected through quantitative research
as semi-structured and structured interviews, focus groups,
transcripts, field notes, observation records and other personal,
research-related documents.
 Importance of secondary data could saves time, difficult to
collect new data, unfeasible for any individual researcher to
collect at their own, difficult to conduct a new survey.
 Benefit of using secondary data as litrature reviews, case
studies.
SECONDARY DATA…
MEASUREMENT SCALE…
MEASUREMENT….MEASUREMENT….
Assignment of numbers toAssignment of numbers to
characteristics of objects, persons,characteristics of objects, persons,
states or events, according to rules.states or events, according to rules.
Keys to MeasurementKeys to Measurement
You do not measure the object, person,You do not measure the object, person,
state or event,state or event, butbut characteristics of thecharacteristics of the
object.object.
Numbers are used to represent theNumbers are used to represent the
observable/unobservable characteristicsobservable/unobservable characteristics
Rules specify how the numbers are to beRules specify how the numbers are to be
assigned to the characteristics.assigned to the characteristics.
Types of Measurement ScalesTypes of Measurement Scales
Nominal ScaleNominal Scale
–LabelLabel
–CategoricalCategorical
–MixedMixed
Ordinal ScaleOrdinal Scale
Interval ScaleInterval Scale
Ratio ScaleRatio Scale
Types of Measurement ScalesTypes of Measurement Scales
Nominal – Categorical Scale exampleNominal – Categorical Scale example
What is your gender?What is your gender?
___ Male___ Male ___Female___Female
How many hours have you completed towardHow many hours have you completed toward
your degree?your degree?
___under 30 hours___under 30 hours ___30-59 hours___30-59 hours
___60-89 hours___60-89 hours ___90 or more hours___90 or more hours
Types of Measurement ScalesTypes of Measurement Scales
Ordinal Scale Example –Ordinal Scale Example –
Please rank order the following as to how oftenPlease rank order the following as to how often
you recycle each item where 1=item you mostyou recycle each item where 1=item you most
often recycle, 7=item you recycle the least.often recycle, 7=item you recycle the least.
___Cardboard___Cardboard ___Glass___Glass
___Newspaper___Newspaper ___Plastic___Plastic
___Other Paper Products___Other Paper Products ___Aluminum___Aluminum
___Other, please specify___________________Other, please specify________________
Common Types of Interval ScalesCommon Types of Interval Scales
LikertLikert
Semantic DifferentialSemantic Differential
RatingRating
–Non-comparativeNon-comparative
–ComparativeComparative
»ItemizedItemized
LikertLikert
Strongly
Agree Agree
Neither
Agree or
Disagree Disagree
Strongly
Disagree
1 2 3 4 5 6 7
Circle the number that best represents your
agreement or disagreement with this statement
I always recycle paper, plastic, glass items.
Semantic DifferentialSemantic Differential
Boring
My responsibility
Necessary for the
preservation of earth
Does little to help
the environment
Exciting
Not my
responsibility
Not necessary for
the preservation of
earth
Does a great deal
to help the
environment
Recycling is ...
Please check the blank that best describes the phrase below. The closerPlease check the blank that best describes the phrase below. The closer
you believe the word or word phrase relates, the you would place youryou believe the word or word phrase relates, the you would place your
check nearer to the word/word phrase.check nearer to the word/word phrase.
Noncomparative Rating ScalesNoncomparative Rating Scales
Overall, how would you rate your level ofOverall, how would you rate your level of
recycling? Please check the appropriaterecycling? Please check the appropriate
response.response.
Exceptionally ExceptionallyExceptionally Exceptionally
Poor GoodPoor Good
Noncomparative Rating ScalesNoncomparative Rating Scales
Overall, how would your level of recycling.Overall, how would your level of recycling.
Please place a check mark along the line thatPlease place a check mark along the line that
best represents your rating.best represents your rating.
Exceptionally ExceptionallyExceptionally Exceptionally
Poor GoodPoor Good
Non Comparative Rating ScalesNon Comparative Rating Scales
Overall, how would you rate your level ofOverall, how would you rate your level of
recycling? Please circle the appropriaterecycling? Please circle the appropriate
response.response.
Exceptionally ExceptionallyExceptionally Exceptionally
Poor GoodPoor Good
1 2 3 4 5 6 71 2 3 4 5 6 7
Comparative Rating ScalesComparative Rating Scales
Overall, how would you rate your level ofOverall, how would you rate your level of
recycling compared to other college students?recycling compared to other college students?
Please circle the appropriate response.Please circle the appropriate response.
Exceptionally ExceptionallyExceptionally Exceptionally
Poor GoodPoor Good
1 2 3 4 5 6 71 2 3 4 5 6 7
Types of Measurement ScalesTypes of Measurement Scales
Ratio ScaleRatio Scale
Over the past week, how many plastic bottlesOver the past week, how many plastic bottles
have you placed into a recycling bin?have you placed into a recycling bin?
__________
Over the past week, what percentage ofOver the past week, what percentage of
plastic bottles that you used, did you placedplastic bottles that you used, did you placed
into a recycling bin?into a recycling bin?
_____%_____%
Issues Concerning Rating ScalesIssues Concerning Rating Scales
Nature & Degree of VerbalNature & Degree of Verbal
DescriptorDescriptor
Number of CategoriesNumber of Categories
Balanced vs UnbalancedBalanced vs Unbalanced
Odd vs Even No. of CategoriesOdd vs Even No. of Categories
Forced vs Nonforced ChoiceForced vs Nonforced Choice
ThanksThanks

More Related Content

What's hot (19)

PDF
Statistics: Chapter One
Saed Jama
 
PPT
Introduction To Statistics
albertlaporte
 
PPT
Chapter 10-DATA ANALYSIS & PRESENTATION
Ludy Mae Nalzaro,BSM,BSN,MN
 
PPTX
Quantitative analysis
Pachica, Gerry B.
 
PPTX
Types of data
Kiran Rawat
 
PPT
Data analysis
Shameem Ali
 
PPTX
Statistics 1
Saed Jama
 
PPT
Quantitative data analysis - John Richardson
OUmethods
 
PPTX
Data
Ashutosh Mittal
 
PPTX
Sampling
Mithun Ray
 
PPTX
Measurement and scaling techniques
Ujjwal 'Shanu'
 
PPT
Sampling and instrumentation
shree.vivek
 
PPT
Chap4 part 1
Neelam Soni
 
PPT
data interpretation
Naatchammai Ramanathan
 
ODP
Review of "Survey Research Methods & Design in Psychology"
James Neill
 
PPTX
Chapter 3 research methodology
Neilson Silva
 
PPTX
Introduction to Research Methodology
Josephin Remitha M
 
PPTX
Basics stat ppt-types of data
Farhana Shaheen
 
PPTX
Quantitative and qualitative data, questionnaires, interviews
leannacatherina
 
Statistics: Chapter One
Saed Jama
 
Introduction To Statistics
albertlaporte
 
Chapter 10-DATA ANALYSIS & PRESENTATION
Ludy Mae Nalzaro,BSM,BSN,MN
 
Quantitative analysis
Pachica, Gerry B.
 
Types of data
Kiran Rawat
 
Data analysis
Shameem Ali
 
Statistics 1
Saed Jama
 
Quantitative data analysis - John Richardson
OUmethods
 
Sampling
Mithun Ray
 
Measurement and scaling techniques
Ujjwal 'Shanu'
 
Sampling and instrumentation
shree.vivek
 
Chap4 part 1
Neelam Soni
 
data interpretation
Naatchammai Ramanathan
 
Review of "Survey Research Methods & Design in Psychology"
James Neill
 
Chapter 3 research methodology
Neilson Silva
 
Introduction to Research Methodology
Josephin Remitha M
 
Basics stat ppt-types of data
Farhana Shaheen
 
Quantitative and qualitative data, questionnaires, interviews
leannacatherina
 

Viewers also liked (12)

PPT
03 data transmission
chameli devi group of institutions
 
PPTX
fUML-Driven Performance Analysis through the MOSES Model Library
Luca Berardinelli
 
PPT
Introduction to HDF5 Data Model, Programming Model and Library APIs
The HDF-EOS Tools and Information Center
 
PPT
Data warehouse
Samir Sabry
 
PPTX
organizational structure of a library
Mubassira Mahmuda Supty
 
PPTX
Packet capture in network security
Chippy Thomas
 
PDF
Machine Learning and Data Mining: 03 Data Representation
Pier Luca Lanzi
 
PPT
Dewey Decimal Classification Explained
tullynp
 
PDF
Video Steganography
James Ridgway
 
PPT
A study on biometric authentication techniques
Subhash Basistha
 
PPTX
Introduction to C Programming
Amr Ali (ISTQB CTAL Full, CSM, ITIL Foundation)
 
PPT
Operating System 2
tech2click
 
fUML-Driven Performance Analysis through the MOSES Model Library
Luca Berardinelli
 
Introduction to HDF5 Data Model, Programming Model and Library APIs
The HDF-EOS Tools and Information Center
 
Data warehouse
Samir Sabry
 
organizational structure of a library
Mubassira Mahmuda Supty
 
Packet capture in network security
Chippy Thomas
 
Machine Learning and Data Mining: 03 Data Representation
Pier Luca Lanzi
 
Dewey Decimal Classification Explained
tullynp
 
Video Steganography
James Ridgway
 
A study on biometric authentication techniques
Subhash Basistha
 
Operating System 2
tech2click
 
Ad

Similar to Lecture # 03 data collection (20)

PPTX
5.Measurement and scaling technique.pptx
HimaniPandya13
 
PPT
Business research
Ujjwal 'Shanu'
 
PPTX
Business research(Rubrics)
DrAmitPurushottam
 
PPTX
Data Analysis
Marcelo Augusto A. Cosgayon
 
PPTX
Scales of Measurements.pptx
rajalakshmi5921
 
PPTX
Levels of measurement
debmahuya
 
PPTX
Scaling in research
ankitsengar
 
PPTX
SCALE , CLASSIFICATION OF SCALE AND IMPORTANCE OF SCALING TECHNIQUES.pptx
AnshutChitransh
 
PPTX
B.ed KU Measurement and evalution,nature and scope,scales of measuremts asses...
ShahidNajar1
 
PPTX
ch 13.pptx
ArfanAhmed22
 
DOCX
Measurement & Scaling
HareerahShoaib
 
PDF
Research Method for Business chapter 7
Mazhar Poohlah
 
PPTX
Statistics (All About Data)
Glenn Rivera
 
PPTX
Measurement and scaling techniques
Kritika Jain
 
PDF
Survey Scales A Guide to Development Analysis and Reporting 1st Edition Rober...
hodnyborus1t
 
PDF
Unit 3 Qualitative Data
Sherry Bailey
 
PPTX
Scaling (1).pptxuiyiuyuyuuyiuytihhigjijiuy7
HumaKashafKhan
 
5.Measurement and scaling technique.pptx
HimaniPandya13
 
Business research
Ujjwal 'Shanu'
 
Business research(Rubrics)
DrAmitPurushottam
 
Scales of Measurements.pptx
rajalakshmi5921
 
Levels of measurement
debmahuya
 
Scaling in research
ankitsengar
 
SCALE , CLASSIFICATION OF SCALE AND IMPORTANCE OF SCALING TECHNIQUES.pptx
AnshutChitransh
 
B.ed KU Measurement and evalution,nature and scope,scales of measuremts asses...
ShahidNajar1
 
ch 13.pptx
ArfanAhmed22
 
Measurement & Scaling
HareerahShoaib
 
Research Method for Business chapter 7
Mazhar Poohlah
 
Statistics (All About Data)
Glenn Rivera
 
Measurement and scaling techniques
Kritika Jain
 
Survey Scales A Guide to Development Analysis and Reporting 1st Edition Rober...
hodnyborus1t
 
Unit 3 Qualitative Data
Sherry Bailey
 
Scaling (1).pptxuiyiuyuyuuyiuytihhigjijiuy7
HumaKashafKhan
 
Ad

More from Dynamic Research Centre & institute (20)

PPTX
Talks1 @ NILAT(05.10.2023) Orientation to Research.pptx
Dynamic Research Centre & institute
 
PDF
CV Synopsis Prof. Dr. Akhlas Ahmed
Dynamic Research Centre & institute
 
DOCX
Profile Dr. Akhlas Ahmed (March 6th 2021)
Dynamic Research Centre & institute
 
PPTX
Workplace Communication in Organization
Dynamic Research Centre & institute
 
DOCX
Course Outlines for Strategic Marketing Fall-2018-19
Dynamic Research Centre & institute
 
PPT
Lecture # 5 nilat (jan 2nd 2018)
Dynamic Research Centre & institute
 
PPT
Lecture # 3 nilat (dec 6th 2017)
Dynamic Research Centre & institute
 
PPT
Lecture # 2 nilat (nov 22nd 2017)
Dynamic Research Centre & institute
 
PPT
Lecture # 1 nilat (nov 15th 2017)
Dynamic Research Centre & institute
 
PPT
5th Lecture Market Analysis of Strategic Marketing
Dynamic Research Centre & institute
 
PPT
1st lecture strategic marketing
Dynamic Research Centre & institute
 
Talks1 @ NILAT(05.10.2023) Orientation to Research.pptx
Dynamic Research Centre & institute
 
CV Synopsis Prof. Dr. Akhlas Ahmed
Dynamic Research Centre & institute
 
Profile Dr. Akhlas Ahmed (March 6th 2021)
Dynamic Research Centre & institute
 
Workplace Communication in Organization
Dynamic Research Centre & institute
 
Course Outlines for Strategic Marketing Fall-2018-19
Dynamic Research Centre & institute
 
Lecture # 5 nilat (jan 2nd 2018)
Dynamic Research Centre & institute
 
Lecture # 3 nilat (dec 6th 2017)
Dynamic Research Centre & institute
 
Lecture # 2 nilat (nov 22nd 2017)
Dynamic Research Centre & institute
 
Lecture # 1 nilat (nov 15th 2017)
Dynamic Research Centre & institute
 
5th Lecture Market Analysis of Strategic Marketing
Dynamic Research Centre & institute
 
1st lecture strategic marketing
Dynamic Research Centre & institute
 

Recently uploaded (20)

PPTX
Practice Gardens and Polytechnic Education: Utilizing Nature in 1950s’ Hu...
Lajos Somogyvári
 
PPTX
ESP 10 Edukasyon sa Pagpapakatao PowerPoint Lessons Quarter 1.pptx
Sir J.
 
PPTX
The Gift of the Magi by O Henry-A Story of True Love, Sacrifice, and Selfless...
Beena E S
 
PPTX
Iván Bornacelly - Presentation of the report - Empowering the workforce in th...
EduSkills OECD
 
DOCX
Lesson 1 - Nature and Inquiry of Research
marvinnbustamante1
 
PPTX
Matatag Curriculum English 8-Week 1 Day 1-5.pptx
KirbieJaneGasta1
 
PPTX
Connecting Linear and Angular Quantities in Human Movement.pptx
AngeliqueTolentinoDe
 
PPTX
How to Manage Wins & Losses in Odoo 18 CRM
Celine George
 
PDF
Rapid Mathematics Assessment Score sheet for all Grade levels
DessaCletSantos
 
PPTX
Parsing HTML read and write operations and OS Module.pptx
Ramakrishna Reddy Bijjam
 
PDF
Wikinomics How Mass Collaboration Changes Everything Don Tapscott
wcsqyzf5909
 
PDF
CAD25 Gbadago and Fafa Presentation Revised-Aston Business School, UK.pdf
Kweku Zurek
 
PPTX
Urban Hierarchy and Service Provisions.pptx
Islamic University of Bangladesh
 
PDF
DIGESTION OF CARBOHYDRATES ,PROTEINS AND LIPIDS
raviralanaresh2
 
PPTX
How to Create & Manage Stages in Odoo 18 Helpdesk
Celine George
 
PDF
Andreas Schleicher_Teaching Compass_Education 2040.pdf
EduSkills OECD
 
PDF
Supply Chain Security A Comprehensive Approach 1st Edition Arthur G. Arway
rxgnika452
 
PPTX
How to Configure Taxes in Company Currency in Odoo 18 Accounting
Celine George
 
PDF
Cooperative wireless communications 1st Edition Yan Zhang
jsphyftmkb123
 
PDF
Free eBook ~100 Common English Proverbs (ebook) pdf.pdf
OH TEIK BIN
 
Practice Gardens and Polytechnic Education: Utilizing Nature in 1950s’ Hu...
Lajos Somogyvári
 
ESP 10 Edukasyon sa Pagpapakatao PowerPoint Lessons Quarter 1.pptx
Sir J.
 
The Gift of the Magi by O Henry-A Story of True Love, Sacrifice, and Selfless...
Beena E S
 
Iván Bornacelly - Presentation of the report - Empowering the workforce in th...
EduSkills OECD
 
Lesson 1 - Nature and Inquiry of Research
marvinnbustamante1
 
Matatag Curriculum English 8-Week 1 Day 1-5.pptx
KirbieJaneGasta1
 
Connecting Linear and Angular Quantities in Human Movement.pptx
AngeliqueTolentinoDe
 
How to Manage Wins & Losses in Odoo 18 CRM
Celine George
 
Rapid Mathematics Assessment Score sheet for all Grade levels
DessaCletSantos
 
Parsing HTML read and write operations and OS Module.pptx
Ramakrishna Reddy Bijjam
 
Wikinomics How Mass Collaboration Changes Everything Don Tapscott
wcsqyzf5909
 
CAD25 Gbadago and Fafa Presentation Revised-Aston Business School, UK.pdf
Kweku Zurek
 
Urban Hierarchy and Service Provisions.pptx
Islamic University of Bangladesh
 
DIGESTION OF CARBOHYDRATES ,PROTEINS AND LIPIDS
raviralanaresh2
 
How to Create & Manage Stages in Odoo 18 Helpdesk
Celine George
 
Andreas Schleicher_Teaching Compass_Education 2040.pdf
EduSkills OECD
 
Supply Chain Security A Comprehensive Approach 1st Edition Arthur G. Arway
rxgnika452
 
How to Configure Taxes in Company Currency in Odoo 18 Accounting
Celine George
 
Cooperative wireless communications 1st Edition Yan Zhang
jsphyftmkb123
 
Free eBook ~100 Common English Proverbs (ebook) pdf.pdf
OH TEIK BIN
 

Lecture # 03 data collection

  • 1. Measurement Scale:Measurement Scale: Dr. Akhlas AhmedDr. Akhlas Ahmed Greenwich UniversityGreenwich University Lecture # 03, July 11Lecture # 03, July 11thth 20142014 (Makeup Class)(Makeup Class) Data Collection:Data Collection:
  • 2.  Data Collection is an important aspect of any type of research study.  Inaccurate data collection can impact the results of a study and ultimately lead to invalid results. DATA COLLECTION…
  • 3.  Plural from datum.  Data are individual piece of information. It is a set of values of qualitative or quantitative variables.  Data are typically the results of measurements and can be visualized using graph or images.  Data as an abstract concept can be viewed as the lowest level of abstraction, from which information and then knowledge are derived. DATA…
  • 4.  The term research data refers to data in any format or medium that relate to or support research, scholarship, or artistic activity. RESEARCH DATA…
  • 5.  Raw or primary data is called unprocessed data which refers to a collection of numbers, characters.  Data processing commonly occurs by stages, and the "processed data" from one stage may be considered the "raw data" of the next.  Examples: Information when recorded as notes, images, video footage, paper surveys, computer files, etc., pertaining to a specific research project. RAW OR PRIMARY DATA….
  • 6.  Analyses, descriptions, and conclusions prepared as reports or papers are called processed data.  Data in computing (or data processing) are represented in a structure that is often tabular (represented by rows and columns), a tree (a set of nodes with parent-children relationship), or a graph (a set of connected nodes). PROCESSED DATA…
  • 7.  Information distributed to people beyond those involved in data acquisition and administration. PUBLISHED DATA…
  • 8.  Field data refers to raw data that is collected in an uncontrolled in situ environment. FIELD DATA….
  • 9.  Experimental data refers to data that is generated within the context of a scientific investigation by observation and recording. EXPERIMENTAL DATA…
  • 10.  Experimental data refers to data that is generated within the context of a scientific investigation by observation and recording. INFORMATION…
  • 11.  Data, information and knowledge are closely related terms, but each has its own role in relation to the other.  Data are collected and analyzed to create information suitable for making decisions,  while knowledge is derived from extensive amounts of experience dealing with information on a subject. KNOWLEDGE….
  • 12.  Data collected by the investigator conducting the research.  Example: PRIMARY DATA…
  • 13. Data collected by someone other than the user like census, organizational records etc.  Data collected through quantitative research as census, housing, social security as well as electoral statistics and other related databases. Data collected through quantitative research as semi-structured and structured interviews, focus groups, transcripts, field notes, observation records and other personal, research-related documents.  Importance of secondary data could saves time, difficult to collect new data, unfeasible for any individual researcher to collect at their own, difficult to conduct a new survey.  Benefit of using secondary data as litrature reviews, case studies. SECONDARY DATA…
  • 15. MEASUREMENT….MEASUREMENT…. Assignment of numbers toAssignment of numbers to characteristics of objects, persons,characteristics of objects, persons, states or events, according to rules.states or events, according to rules.
  • 16. Keys to MeasurementKeys to Measurement You do not measure the object, person,You do not measure the object, person, state or event,state or event, butbut characteristics of thecharacteristics of the object.object. Numbers are used to represent theNumbers are used to represent the observable/unobservable characteristicsobservable/unobservable characteristics Rules specify how the numbers are to beRules specify how the numbers are to be assigned to the characteristics.assigned to the characteristics.
  • 17. Types of Measurement ScalesTypes of Measurement Scales Nominal ScaleNominal Scale –LabelLabel –CategoricalCategorical –MixedMixed Ordinal ScaleOrdinal Scale Interval ScaleInterval Scale Ratio ScaleRatio Scale
  • 18. Types of Measurement ScalesTypes of Measurement Scales Nominal – Categorical Scale exampleNominal – Categorical Scale example What is your gender?What is your gender? ___ Male___ Male ___Female___Female How many hours have you completed towardHow many hours have you completed toward your degree?your degree? ___under 30 hours___under 30 hours ___30-59 hours___30-59 hours ___60-89 hours___60-89 hours ___90 or more hours___90 or more hours
  • 19. Types of Measurement ScalesTypes of Measurement Scales Ordinal Scale Example –Ordinal Scale Example – Please rank order the following as to how oftenPlease rank order the following as to how often you recycle each item where 1=item you mostyou recycle each item where 1=item you most often recycle, 7=item you recycle the least.often recycle, 7=item you recycle the least. ___Cardboard___Cardboard ___Glass___Glass ___Newspaper___Newspaper ___Plastic___Plastic ___Other Paper Products___Other Paper Products ___Aluminum___Aluminum ___Other, please specify___________________Other, please specify________________
  • 20. Common Types of Interval ScalesCommon Types of Interval Scales LikertLikert Semantic DifferentialSemantic Differential RatingRating –Non-comparativeNon-comparative –ComparativeComparative »ItemizedItemized
  • 21. LikertLikert Strongly Agree Agree Neither Agree or Disagree Disagree Strongly Disagree 1 2 3 4 5 6 7 Circle the number that best represents your agreement or disagreement with this statement I always recycle paper, plastic, glass items.
  • 22. Semantic DifferentialSemantic Differential Boring My responsibility Necessary for the preservation of earth Does little to help the environment Exciting Not my responsibility Not necessary for the preservation of earth Does a great deal to help the environment Recycling is ... Please check the blank that best describes the phrase below. The closerPlease check the blank that best describes the phrase below. The closer you believe the word or word phrase relates, the you would place youryou believe the word or word phrase relates, the you would place your check nearer to the word/word phrase.check nearer to the word/word phrase.
  • 23. Noncomparative Rating ScalesNoncomparative Rating Scales Overall, how would you rate your level ofOverall, how would you rate your level of recycling? Please check the appropriaterecycling? Please check the appropriate response.response. Exceptionally ExceptionallyExceptionally Exceptionally Poor GoodPoor Good
  • 24. Noncomparative Rating ScalesNoncomparative Rating Scales Overall, how would your level of recycling.Overall, how would your level of recycling. Please place a check mark along the line thatPlease place a check mark along the line that best represents your rating.best represents your rating. Exceptionally ExceptionallyExceptionally Exceptionally Poor GoodPoor Good
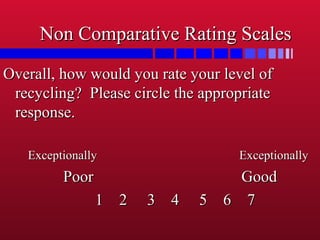
  • 25. Non Comparative Rating ScalesNon Comparative Rating Scales Overall, how would you rate your level ofOverall, how would you rate your level of recycling? Please circle the appropriaterecycling? Please circle the appropriate response.response. Exceptionally ExceptionallyExceptionally Exceptionally Poor GoodPoor Good 1 2 3 4 5 6 71 2 3 4 5 6 7
  • 26. Comparative Rating ScalesComparative Rating Scales Overall, how would you rate your level ofOverall, how would you rate your level of recycling compared to other college students?recycling compared to other college students? Please circle the appropriate response.Please circle the appropriate response. Exceptionally ExceptionallyExceptionally Exceptionally Poor GoodPoor Good 1 2 3 4 5 6 71 2 3 4 5 6 7
  • 27. Types of Measurement ScalesTypes of Measurement Scales Ratio ScaleRatio Scale Over the past week, how many plastic bottlesOver the past week, how many plastic bottles have you placed into a recycling bin?have you placed into a recycling bin? __________ Over the past week, what percentage ofOver the past week, what percentage of plastic bottles that you used, did you placedplastic bottles that you used, did you placed into a recycling bin?into a recycling bin? _____%_____%
  • 28. Issues Concerning Rating ScalesIssues Concerning Rating Scales Nature & Degree of VerbalNature & Degree of Verbal DescriptorDescriptor Number of CategoriesNumber of Categories Balanced vs UnbalancedBalanced vs Unbalanced Odd vs Even No. of CategoriesOdd vs Even No. of Categories Forced vs Nonforced ChoiceForced vs Nonforced Choice