


Ad
More Related Content
What's hot (20)
Similar to Lecture 10: introduction to computer (20)


Ad
More from Sultan Omar Shige (8)


Ad
Recently uploaded (20)


Lecture 10: introduction to computer
- 1. Lecture:Barkhad mohamed omar{suldaan} Book:-Introduction to Computer. Faculty: ________________________ Lecture hours:2hrs Before lecture quiz 10 minutes .
- 2. Changing height of the row. Perform following steps to alter the height of the row, so that bigger font characters could be accommodated in it. 1. Select row or group of rows for which the height has to changed. 2. Select “format” option from the bar menu when you do so, format submenu as shown in figure 7.16(a) will appear on the screen. 3. Select “row “ option from submenu. When you do so, another submenu as shown in figure 7.16(b)will appear on the screen.
- 3. 4. Select “height “ option from this submenu when you do so, , a dialog box as shown in figure 7.16©will appear on the screen. 5. Now enter the desired height in “row height” text box of this dialog box . 6. At last click the mouse “ok” button. When you do so, the height of selected rows will change.
- 4. Changing the width of the column The procedure for changing the width of the column is same as that of changing the height of the row (mentioned above) except that you need to select “column” option from the format submenu (figure 7.16(a) and “width” option from the submenu that appears there after. Inserting blank row or column . Perform following steps to insert blank row or column in the worksheet. 1. Place the cell pointer on the row (or column) above (or left) which the blank row (or column ) is to be inserted. 2. Click the mouse on” insert” option present in the bar menu when you do so, a submenu as shown in figure 7.17 will appear on the screen .
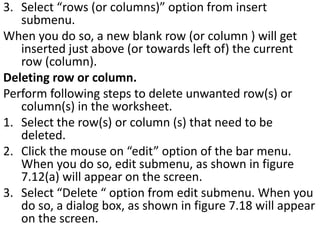
- 5. 3. Select “rows (or columns)” option from insert submenu. When you do so, a new blank row (or column ) will get inserted just above (or towards left of) the current row (column). Deleting row or column. Perform following steps to delete unwanted row(s) or column(s) in the worksheet. 1. Select the row(s) or column (s) that need to be deleted. 2. Click the mouse on “edit” option of the bar menu. When you do so, edit submenu, as shown in figure 7.12(a) will appear on the screen. 3. Select “Delete “ option from edit submenu. When you do so, a dialog box, as shown in figure 7.18 will appear on the screen.
- 6. 4. select “enter row “(or entire column) option from this dialog box. 5. At last click the mouse on “ok” button. When you do so, row (or column) will get removed from the worksheet. Inserting a new blank worksheet. Perform following steps to insert a new blank worksheet in the workbook. 1. Click the mouse on that tab of the worksheet, left to which a new blank worksheet is to be inserted . For example, if a new worksheet is to be inserted in between sheet4 and sheet5, click the mouse on sheet5 tab. 2. Select “insert “ option from the bar menu. When you do so, insert submenu as shown in figure 7.17 will appear on the screen. 3. Select “worksheet” option from insert submenu.
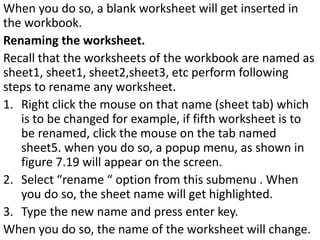
- 7. When you do so, a blank worksheet will get inserted in the workbook. Renaming the worksheet. Recall that the worksheets of the workbook are named as sheet1, sheet1, sheet2,sheet3, etc perform following steps to rename any worksheet. 1. Right click the mouse on that name (sheet tab) which is to be changed for example, if fifth worksheet is to be renamed, click the mouse on the tab named sheet5. when you do so, a popup menu, as shown in figure 7.19 will appear on the screen. 2. Select “rename “ option from this submenu . When you do so, the sheet name will get highlighted. 3. Type the new name and press enter key. When you do so, the name of the worksheet will change.
- 8. Deleting A worksheet. Perform following steps to remove any worksheet from the figure 7.19 workbook: 1. Select the worksheet, which is to be deleted by clicking the mouse on its sheet tab for example if fifth worksheet is to be deleted, click the mouse sheet5 tab. 2. Click the mouse on ”edit” option of the bar menu . When you do so, edit submenu as shown in figure 7.12 (a) will appear on the screen. 3. Select “delete sheet” option from edit submenu . When you do so, an alert box, as shown in figure 7.20 will appear on the screen. 4. Click the mouse on “ok” button. When you do so, current worksheet will get removed from the workbook.
- 9. MS-Excel Chart. Introduction. Representing data in the form of chart is one of the most popular methods, which is used, for the purpose of data analysis, excel provides many tools and facilities , using which you can transform the data into charts, in this chapter we will mainly deal with charting capabilities of MS-Excel . 1. Maximum sale has been made by the company NET, which paid the lowest tax. 2. Highest expenditure has been made by the company sun, which has paid the highest tax. 3. The company TEK has made a loss while the other companies have incurred a profit. What is chart ? Chart is graphical representation of data, data values are represented in terms of bars , lines, columns , pie, slice etc. Chapter 7
- 10. No A B C D E 1 Sales and Expenditure figure. 2 3 TEK SUN NET 4 SALES 1000 15000 20000 5 EXPND 4000 8000 7000 6 TAX 2000 4000 1000
- 11. Introduction To MS-Excel Charts. Excel supports 18 different types of charts to represent the data in different forms different parts of the chart can also be labeled . Which type of chart will suit best , for the given data will depend upon what the data pertains to and what type of analysis is to be done. Before we go into the operational aspects of drawing the chart , let’s first get introduced to different types of charts that can be generated in MS-Excel. Types of charts. 1. Area chart and 3-D- area chart. 2. Bar chart and 3-D –area chart . 3. Column chart and 3-D –columns chart. 4. Line chart and 3-D –line chart. 5. Pie chart and 3-D –pie chart. 6. Doughout chart and 7. Xy scatter chart.
- 13. Making A Chart Using Chart Bar. In order to make a chart , using chart bar, firstly you have to display the chart bar on the screen and then perform the required steps. The procedure to display the chart bar is explained below. Displaying The Chart Bar. Perform following steps to display the chart bar on the screen ,if it is not there. 1. Select “view” option from the bar menu. When you do so, view submenu , as shown in figure 7.5(a)will appear on the screen. 2. Select “toolbar” option from view submenu . When you do so, another submenu, as shown in figure 7.5(b) will appear on the screen . 3. Select “chart “ option from this submenu on doing so, a chart bar, as shown in figure 7.6 will appear on the screen.
- 14. Making A Chart. Perform following steps to prepare the desired chart. 1. Select that portion of the data that has to be transformed into chart. let’s take the example of the data pertaining to three companies viz. Tek, Sun, & Net that is shown in figure 7.7(a) select the range A2:D6. 2. Now select “chart type” button from the chart bar, on selecting this button , Ms-Excel display a chart list as shown in figure 7.8. 3. Select the desired chart type from this list , say you select column chart option from this list. When you do so, MS-Excel will automatically plot the chart and include it as an object in the worksheet . A column chart made for the options chosen above is shown in figure 7.7(b).
- 15. Selecting Item in A Chart. Perform following steps to select an item of the chart. 1. Select the chart by clicking the mouse on the chart. 2. Now click the mouse on the item that you want to select. For example , if you wish to select the legend of the chart , first select the chart by clicking the mouse on it and then click it on the legend . When you click the mouse on the item it gets surrounded with a border with handles , which indicates that this components of the chart has been selected for modification. Cancelling The Selection. To cancel the selection press Esc (escape) key or click the mouse on any blank space of the worksheet. Deleting A Chart. To delete a chart , first select the chart and then press (Del) key of the keyboard .
- 16. Moving The Chart. To move the chart from one location to another , simply select the chart and drag the mouse to the new location. As you drag the mouse , chart will also move along with the mouse pointer , when you release the mouse button the chart will get located at new location . Sizing The Chart. To change the size of the chart (increase/decrease) first select the chart and then place the mouse pointer at any handle. The mouse pointer will change to a double-headed arrow pointer. Now drag the mouse , dragging the mouse will change the size of the chart.
- 17. Changing The Title In The Chart. Perform following steps to make changes in the title. 1. First select the title that needs to be altered. 2. Now select “chart” option from the bar menu . When you do so, submenu , as shown in figure 7.10 will appear on the screen. 3. Now select “chart option” option from this submenu . When you do so , a dialog box , as shown in figure 7.11 will appear on screen. 4. Click the mouse in “chart title “ text box and enter the title , if you wish to change the title of the chart . If you wish to make changes in x axis title or y axis title select corresponding text boxes and enter new title in the desired text box . 5. At last , click the mouse on “ok” button . When you do so, selected chart will get updated automatically.