SlideShare a Scribd company logo
Lecture 3
Introduction to Dimensional Modeling
01/27/2025
Topics to cover
• Understanding key concepts in dimensional
modeling
• Importance of dimensional modeling
• Dimensional modeling vs ER modeling
• Types of dimensional models
• A DWH as a Multidimensional Model
IS 301 2
01/27/2025
Data Warehouse Design
 Designing the data warehouse is a key issue in
the DWH process.
 Although a DWH can be designed by entity
relationship modeling , many DWH experts
including Kimball et al… prefer dimensional
modeling.
IS 301 3
01/27/2025
Dimensional modeling is the process and outcome of designing
logical database schemas created to support OLAP and Data Warehousing
Solutions.
It is especially useful for summarizing and rearranging the data and
presenting views of the data to support data analysis.
Dimension: A category of information, for example, the time dimension.
Attribute: A unique level within a dimension, for example, Month is an
attribute in the Time Dimension.
Hierarchy: The specification of levels that represents relationship between
different attributes within a dimension. For example, one possible hierarchy in
the Time dimension is Year → Quarter → Month → Day.
Dimensional Modeling
IS 301 4
01/27/2025
Issues to note:
1. Dimensions and hierarchies are represented by
dimensional tables.
2. Attributes are the non-key columns in the
dimensional tables.
3. Fact tables connect to one or more dimensional
tables, but fact tables do not have direct relationships
to one another.
Dimensional Modeling
IS 301 5
IS 301
Dimensional Modeling
Time Locations
Year Country
Quarterly District
Monthly Village
Measured Facts: annual sales amounts per village
Attributes
in
their
hierarchy
Dimensions
Lecture 3-6
01/27/2025 IS 301 7
Some examples:
– The analysis of a product sales to a customer during last six
month has three dimensions –: customer, product and time
– The analysis of a product sales to a customer in the a district
during last six month has four dimensions –: customer, product,
region, and time
• By the rule, the time is always one of the
dimensions
Dimensional Modeling
01/27/2025 IS 301 8
Dimensional Modeling
Data Granularity
• The grain defines the level of detail of a single record
in the fact table.
• The more detail there is in the fact table, the higher
its granularity and vice versa.
01/27/2025 IS 301 9
Dimensional Modeling
Data Granularity example
• A fact table contains three metrics (Unit Price, Units Sold and Total Sale
Amount).
– The Time dimension consists of four hierarchical elements (Year,
Quarter, Month and Day).
– The Organization dimension consists of three hierarchical elements
(Region, District and Store).
– The Product dimension consists of two hierarchical elements
(Product Family and SKU(Stock Keeping Unit)).
• The highest granularity that we can store Sales metrics is by
Day/Store/SKU (i.e., the lowest level in each dimensional hierarchy).
• Conversely, the lowest granularity that we can aggregate Sales metrics
to in this data mart is by Year/Region/Product Family (i.e., the highest
level in each dimensional hierarchy).
01/27/2025 IS 301 10
Benefits of using Dimensional Modeling
1. Logical model is easy to understand
• Provides a predictable and standard framework for end user apps. Report
writers, query tools, and user interfaces can all make strong assumptions about the
dimensional model to make the user interfaces more understandable.
• Model can be done (mostly) independent of expected queries since it withstands
unexpected changes in user behavior
• Handle changes easily – such as adding new dimensional attributes since there is
no need to reload data and no need to reprogram query tools
2. Optimized for performance
• High performance “browsing” across the attributes
• Strategy to handling aggregates .i.e. Summary records that are logically redundant
with base data already in the data warehouse, but they are used to enhance query
performance.
• OLAP engines can make processing more efficient
3. Historical tracking of information
– Strategies for handling changing dimensions
– Fact design allows high volume snapshots and transaction Tracking
Dimension Tables
01/27/2025 IS 301 11
Dimensional Model vs ER model
• The key to understanding the relationship
between DM and ER is that a single ER diagram
breaks down into multiple DM diagrams, or ‘stars’.
• Think of a large ER diagram as representing every
possible business process within an application.
The ER diagram may have Sales Calls, Order
Entries, Shipment Invoices, Customer Payments,
and Product Returns, all on the same diagram.
01/27/2025 IS 301 12
Dimensional Model vs ER model
• To create the individual ‘stars’ that exist within an
application:
– Look for many-to-many relationships in the ER model
containing numeric and additive facts and designate
them as fact tables.
– Alternatively, look for ‘events’ or ‘transactions’ – these
may also be facts
– De-normalize all of the remaining tables into flat tables
with single-part keys that connect directly to the fact
tables. These tables become the dimension tables.
01/27/2025 IS 301 13
Dimensional Model vs ER model
Shipments
Returns
Sales Contact
Orders
Payments
01/27/2025 IS 301 14
ERD versus DM
Order
Customer
Order-
line
Product
Product-
type
Region
Order_
fact
Product_
dimension
Customer_
dimension
Time_
dimension
Product-
group
01/27/2025 IS 301 15
Dimensional Model vs ER model
• ER models are not appropriate for Data
Warehouses. ER modeling does not really
model a business; rather, it models the micro
relationships among data elements.
• ER models are wildly variable in structure. As
such, it is extremely difficult to optimize query
performance.
01/27/2025 IS 301
ER Modeling vs Dimensional modeling
Relational DM
Dimensional DM
1. Data is stored in RDBMS
2. Tables are units of storage
3. Data is normalized and used for
OLTP. Optimized for OLTP processing
4. Several tables and chains of
relationships among them
5. Volatile(several updates)
6. User is usually constrained by an
application that understands the
data design. Users are typically
operations staff.
1. Data is stored in RDBMS or
Multidimensional databases
2. Cubes are units of storage
3. Data is denormalized and used in
datawarehouse and data mart.
Optimized for OLAP
4. Few tables and fact tables are
connected to dimensional tables
5. Non volatile
6. The simpler data design makes it easier
for users to analyze data in any way they
choose. Users are typically analysts,
company strategists, or even executives
16
01/27/2025 IS 301
ER Modeling vs Dimensional modeling
Relational DM
Dimensional DM
7. SQL is used to manipulate data
8. Detailed level of transactional data
9. Normal Reports
10. Typical data design used for business
transaction systems
11. Goal – reduce every piece of information
to it’s simplest form –
a debit transaction, a customer record,
an address.
12. Suited for concurrent handling of many
small transactions by many users. Only a
limited amount of data history is
normally kept.
7. MDX is used to manipulate data
8. Summary of bulky transactional
data(Aggregates and Measures) used in
business decisions
9. User friendly, interactive, drag and drop
multidimensional OLAP Reports
10. Data design used for analysis systems
11. Goal – break up information into ‘Facts’ –
things a company measures and
‘Dimensions’ - how we measure them: by
time, region, or customer
12. Suited for reading or analyzing large
amounts of data by a modest numbers of
users. Many years of data history may be
kept. 17
01/27/2025 IS 301 18
What is a Dimensional Model?
• A dimensional model is a star schema that contains
two types of tables, fact tables and dimension tables.
1. Fact table (quantitative) – a fact table is the primary table
in a dimensional model where the numerical performance
measurement of the business are stored. I.e. attributes of
numeric and additive. Example: quantity sold, dollar sales
amount.
2. Dimension table ( descriptive) – tables that contain the
textual descriptors of the business. Example: product and
brand descriptions.
01/27/2025
•A fact table is a table that contains the measures of interest. For example, sales
amount would be such a measure.
•This measure is stored in the fact table with the appropriate granularity. For
example, it can be sales amount by store by day. In this case, the fact table would
contain three columns: A date column, a store column, and a sales amount
column.
•Numeric
• Additive – across dimensions. Hundreds and thousands of records are fetched
from the database, the useful thing to do with so many records is to add them
up.
• Primary keys of dimensions (surrogate keys) become foreign keys in the fact
table.
•Consider rolling summaries
Fact Table
IS 301 19
01/27/2025
Rolling summary
Day 2 Day 5
Week 1 Week 2 Week 3 Week 4
Day 3 Day 4 Day 6 Day 7
Month 1 Month 2 Month 3
Qrt 1 Qrt 2 Qrt 3 Qrt 4
Day 1
Month 12
……….
IS 301 20
01/27/2025
•A dimensional table provides the detailed information about the
attributes. For example, the dimensional table for the Quarter
attribute would include a list of all of the quarters available in the
data warehouse.
•Each row (each quarter) may have several fields, one for the
unique ID that identifies the quarter, and one or more additional
fields that specifies how that particular quarter is represented on a
report (for example, first quarter of 2001 may be represented as
"Q1 2001" or "2001 Q1").
Dimensional Table
IS 301 21
01/27/2025
Three basic types of dimensional models, and they are:
1. Star model
2. Snowflake model
3. Fact constellation model
Types of dimensional models
IS 301 22
01/27/2025
• a single object (the fact table) sits in the middle and is radically
connected to other surrounding objects (dimension tables) like
a star.
• Each dimension is represented as a single table. The primary key
in each dimension table is related to a foreign key in the fact
table.
Star model
IS 301 23
01/27/2025 IS 301 24
Example of Star Schema
01/27/2025
Example of Star Schema
time_key
day
day_of_the_week
month
quarter
year
time
location_key
street
city
province_or_street
country
location
Sales Fact Table
time_key
item_key
branch_key
location_key
units_sold
dollars_sold
avg_sales
Measures
item_key
item_name
brand
type
supplier_type
item
branch_key
branch_name
branch_type
branch
IS 301 25
01/27/2025 IS 301 26
Star Schema with Sample Data
001
002
001
003
002
001
002
001
01/27/2025 IS 301 27
Relationship of a Star Schema model to a
Report
• Question answered what, when, by whom, and to
whom.
– Results got by combining (joining one or more
dimension tables with the fact table)
• Example
– The Marketing Dept wants to know the quantity of
and order amount of PCs sold, relating to
customers who are married obtained by sales
persons in the Makerere region in the month of
March.
01/27/2025 IS 301 28
Relationship of a Star Schema model to a
Report
Order Facts Table
Product Key (FK)
Time Key (FK)
Customer Key (FK)
Sales Person Key (FK)
Order Shillings
Cost Shillins
Margin Shillings
Quanty
Product Dimension Table
PK Product Key
Product Name
Product Code
Product Line
Brand
Sales Person Dimension Table
PK Sales Person Key
Sales Person NAme
Territory Name
Region Name
Customer Dimension Table
PK Customer Key
Customer Name
Customer Code
Marital Status
Address
Town
Time Dimension Table
PK Time Key
Date
Month
Quarter
Year
Product name =
PCs
Month =
March
Marital Status =
Married
Region Name =
Makerere
01/27/2025
1. Easy to understand
2. Easy to define hierarchies
3. Reduces number of physical joins
4. Low maintenance
5. Very simple metadata
Benefits of a Star model
IS 301 29
01/27/2025
A refinement of star schema where some dimensional
hierarchy is normalized into a set of smaller dimension
tables, forming a shape similar to snowflake
Snowflake model
IS 301 30
01/27/2025 IS 301
Example of Snowflake Schema
time_key
day
day_of_the_week
month
quarter
year
time
location_key
street
city_key
location
Sales Fact Table
time_key
item_key
branch_key
location_key
units_sold
dollars_sold
avg_sales
Measures
item_key
item_name
brand
type
supplier_key
item
branch_key
branch_name
branch_type
branch
supplier_key
supplier_type
supplier
city_key
city
province_or_street
country
city
31
01/27/2025 IS 301 32
Example of a snowflake schema- a student
attendance DWH
01/27/2025 IS 301 33
Benefits of snowflaking
1. Used in OLAP multidimensional database modeling tools that use
dimensional data marts as a data source.
2. Appropriate for use where a dimension table occupies a significant
proportion of the database as a result of querying very sparse dimensions or
dimensions with many attributes
3. Easier to use in cases where there is need to add a multidimensional view to
an existing transactional database for decision making.
4. A snowflake schema can sometimes reflect the way in which users think
about data.
5. Useful in conventional multidimensional reporting tools where queries
cannot be represented by simple star schema.
01/27/2025
A fact constellation model is a dimensional model that consists of
multiple fact tables, joined together through dimensions.
Multiple fact tables share dimension tables, viewed as a collection
of stars, therefore called galaxy schema or fact constellation
In this case a dimension table connects to more than one fact table,
we therefore refer to the dimension tables as "conformed" between
the two dimensional models.
Fact Constellation model
IS 301 34
01/27/2025
Example of Fact Constellation
time_key
day
day_of_the_week
month
quarter
year
time
location_key
street
city
province_or_street
country
location
Sales Fact Table
time_key
item_key
branch_key
location_key
units_sold
dollars_sold
avg_sales
Measures
item_key
item_name
brand
type
supplier_type
item
branch_key
branch_name
branch_type
branch
Shipping Fact Table
time_key
item_key
shipper_key
from_location
to_location
dollars_cost
units_shipped
shipper_key
shipper_name
location_key
shipper_type
shipper
IS 301 35
01/27/2025 IS 301 36
Common uses
• These schemas are most commonly found in dimensional DWHs and
data marts where speed of data retrieval is more important than the
efficiency of data manipulations.
• The decision whether to employ a star schema or a snowflake schema or
a fact constellation schema should consider the relative strengths of the
database platform in question and the query tool to be employed.
– Star schema should be favored with query tools that largely expose users to
the underlying table structures, and in environments where most queries
are simpler in nature.
– Snowflake schema are often better with more sophisticated query tools
that isolate users from the raw table structures and for environments
having numerous queries with complex criteria.
01/27/2025 IS 301 37
Schema Keys
• Dimension Business Key
– Column or columns that identify a unique instance of the business
record (not necessarily a unique record in the dimension table)
– Used in the ETL process to tie fact records with dimension members
• Dimension Record Surrogate Keys
– Defines the dimension’s primary key
– Relates to the fact table foreign key field
– Numeric data type, typically integer (2,4,8 byte)
• Foreign Keys
– Each Dimensional Table has a one-to-many relationship with the
central fact table
– The PK of each Dimension Table must be a Foreign Key in the Fact
Table
01/27/2025 IS 301 38
Why use surrogate Keys
• Data tables in various source systems may use different keys for the same entity.
Legacy systems that provide historical data might have used a different numbering
system than a current online transaction processing system. A surrogate key
uniquely identifies each entity in the dimension table regardless of its source key. A
separate field can be used to contain the key used in the source system.
• Systems developed independently in company divisions may not use the same
keys, or they may use keys that conflict with data in the systems of other
divisions. This situation may not cause problems when each division independently
reports summary data, but it cannot be permitted in the data warehouse where
data is consolidated.
• Keys may change or be reused in the source data systems. This situation is usually
less likely than others, but some systems have been known to reuse keys belonging
to obsolete data. However, the key may still be in use in historical data in the data
warehouse, and the same key cannot be used to identify different entities.
01/27/2025 IS 301 39
Why use surrogate Keys
• Changes in organizational structures may move keys in the hierarchy. This can be a
common situation.
– For example, if a salesperson is transferred from one region to another, the company
may prefer to track two things: sales data for the salesperson with the person's original
region for data prior to the transfer date, and sales data for the salesperson in the
person's new region after the transfer date. To represent this organization of data, the
salesperson's record must exist in two places in the sales force dimension table, which is
not possible if the salesperson's company employee identification number is used as
the primary key for the dimension table. A surrogate key allows the same salesperson to
participate in different locations in the dimension hierarchy.
– In this case, the salesperson will be represented twice in the dimension table with two
different surrogate keys. These surrogate keys are used to join the salesperson's records
to the sets of facts appropriate to the various locations in the hierarchy occupied by the
salesperson.
– The employee's identification number should be carried in a separate column in the
table so information about the employee can be reviewed or summarized regardless of
the number of times the employee's record appears in the dimension table.
Dimensions that exhibit this type of change are called slowly changing
dimensions.
01/27/2025 IS 301 40
Multi-dimensional Databases
• A data warehouse is based on a multidimensional
data model
• A multidimensional database (MDDB) reflects
the multi-dimensional characteristics of data
internally
• Stores the data in a giant hypercube
• Makes it easy for computer to locate any item
of interest.
01/27/2025 IS 301 41
Multi-dimensional Data
Product
R
e
g
i
o
n
Month
Hierarchical summarization paths
Dimensions:
Product, Location, Time
Industry Region Year
Category Country Quarter
Product City Month Week
Office Day
Sales volume as a function of product,
month, and region
01/27/2025 IS 301 42
Data Cube/Hypercube
• Hypercubes summarise data into dimensions
• Multidimensional Hypercubes enable managers to analyse
values at the intersection of these dimensions
Total annual sales
of TVs in U.S.A.
Date
P
r
o
d
u
c
t
Country
sum
sum
TV
VC
R
PC
1Qtr 2Qtr 3Qtr 4Qtr
U.S.A
Canada
Mexico
sum
01/27/2025 IS 301 43
What are Data Cubes
• Data Cubes are multidimensional data
resources
• Data Cubes allow you to look at complex data
in a simple format
• Data Cubes allow you to analyze specific data
01/27/2025 IS 301 44
Parts of the Data Cube
Filters: Ability to look at only one
portion of a dimension. Example –
GSFC instead of All Centers.
Measures: Method of
counting. How the
dimension is being counted.
Dimensions: The category that is being counted.
Example – GSFC Employees, Employee Type
etc.
• Data Cubes look like a simple spreadsheet
• Just choose what data you want in your columns and
your rows and the totals self-populate
– In this example, Centers are in the columns and
some dates are in the rows
How to use a Data Cube
Lecture 3-46
IS 301
How to choose your Columns
• To choose a column, simply click on the pull-down
menu and choose your data
• The column pull-down menu is located just to the
right of the column header labels
Lecture 3-47
IS 301
How to choose your Rows
• To choose a row, simply click on the pull-down menu
and choose your data
The row pull-down menu is located
just below the row header labels
Lecture 3-48
IS 301
Filters
• After choosing the columns and rows, you may
choose what segment of the population you want to
view
• Use drop-down boxes to determine what data you
want to focus on
Lecture 3-49
IS 301
01/27/2025 IS 301 50
Measures
• You may also choose how the data is counted
or measured
– The most common measure is headcount
– Other measures include:
• Average Age
• Average Years of Federal Service
• Average Annual Salary
• Aggregate Salary
Measures
• Use the drop-down box to choose a measure
Lecture 3-51
IS 301
View Data As . . .
• You may also choose to view the data as a number
or as a percentage
• Just use the View Data As drop down box
Lecture 3-52
IS 301
Ad

More Related Content

Similar to Lecture 3:Introduction to Dimensional Modelling.pptx (20)

OLAP Cubes in Datawarehousing
OLAP Cubes in DatawarehousingOLAP Cubes in Datawarehousing
OLAP Cubes in Datawarehousing
Prithwis Mukerjee
 
Data warehouse logical design
Data warehouse logical designData warehouse logical design
Data warehouse logical design
Er. Nawaraj Bhandari
 
Business Intelligence and Multidimensional Database
Business Intelligence and Multidimensional DatabaseBusiness Intelligence and Multidimensional Database
Business Intelligence and Multidimensional Database
Russel Chowdhury
 
Date Analysis .pdf
Date Analysis .pdfDate Analysis .pdf
Date Analysis .pdf
ABDEL RAHMAN KARIM
 
LECTURE 7.ppt.pdf
LECTURE 7.ppt.pdfLECTURE 7.ppt.pdf
LECTURE 7.ppt.pdf
cikajen791
 
Become BI Architect with 1KEY Agile BI Suite - OLAP
Become BI Architect with 1KEY Agile BI Suite - OLAPBecome BI Architect with 1KEY Agile BI Suite - OLAP
Become BI Architect with 1KEY Agile BI Suite - OLAP
Dhiren Gala
 
1 introductory slides (1)
1 introductory slides (1)1 introductory slides (1)
1 introductory slides (1)
tafosepsdfasg
 
Unit 2- Data Warehouse Logical Design.pptx
Unit 2- Data Warehouse Logical Design.pptxUnit 2- Data Warehouse Logical Design.pptx
Unit 2- Data Warehouse Logical Design.pptx
Rakesh Bachchan
 
Application Middleware Overview
Application Middleware OverviewApplication Middleware Overview
Application Middleware Overview
Christalin Nelson
 
Schema_______________Types__________.pdf
Schema_______________Types__________.pdfSchema_______________Types__________.pdf
Schema_______________Types__________.pdf
KatonPang
 
An introduction to data warehousing
An introduction to data warehousingAn introduction to data warehousing
An introduction to data warehousing
Shahed Khalili
 
Lesson 3 - The Kimbal Lifecycle.pptx
Lesson 3 - The Kimbal Lifecycle.pptxLesson 3 - The Kimbal Lifecycle.pptx
Lesson 3 - The Kimbal Lifecycle.pptx
calf_ville86
 
Data Warehousing and Data Mining
Data Warehousing and Data MiningData Warehousing and Data Mining
Data Warehousing and Data Mining
idnats
 
Intro to Data warehousing lecture 15
Intro to Data warehousing   lecture 15Intro to Data warehousing   lecture 15
Intro to Data warehousing lecture 15
AnwarrChaudary
 
Chapter 2
Chapter 2Chapter 2
Chapter 2
mekuanint sefi
 
1-Data Warehousing-Multi Dim Data Model.pptx
1-Data Warehousing-Multi Dim Data Model.pptx1-Data Warehousing-Multi Dim Data Model.pptx
1-Data Warehousing-Multi Dim Data Model.pptx
ShobySunny2
 
Dataware house introduction by InformaticaTrainingClasses
Dataware house introduction by InformaticaTrainingClassesDataware house introduction by InformaticaTrainingClasses
Dataware house introduction by InformaticaTrainingClasses
InformaticaTrainingClasses
 
Data Mining: Concepts and Techniques (3rd ed.) — Chapter _04 olap
Data Mining:  Concepts and Techniques (3rd ed.)— Chapter _04 olapData Mining:  Concepts and Techniques (3rd ed.)— Chapter _04 olap
Data Mining: Concepts and Techniques (3rd ed.) — Chapter _04 olap
Salah Amean
 
data mining and data warehousing
data mining and data warehousingdata mining and data warehousing
data mining and data warehousing
MohammedAmeenUlIslam1
 
Big Data Modeling
Big Data ModelingBig Data Modeling
Big Data Modeling
Hans Hultgren
 
OLAP Cubes in Datawarehousing
OLAP Cubes in DatawarehousingOLAP Cubes in Datawarehousing
OLAP Cubes in Datawarehousing
Prithwis Mukerjee
 
Business Intelligence and Multidimensional Database
Business Intelligence and Multidimensional DatabaseBusiness Intelligence and Multidimensional Database
Business Intelligence and Multidimensional Database
Russel Chowdhury
 
LECTURE 7.ppt.pdf
LECTURE 7.ppt.pdfLECTURE 7.ppt.pdf
LECTURE 7.ppt.pdf
cikajen791
 
Become BI Architect with 1KEY Agile BI Suite - OLAP
Become BI Architect with 1KEY Agile BI Suite - OLAPBecome BI Architect with 1KEY Agile BI Suite - OLAP
Become BI Architect with 1KEY Agile BI Suite - OLAP
Dhiren Gala
 
1 introductory slides (1)
1 introductory slides (1)1 introductory slides (1)
1 introductory slides (1)
tafosepsdfasg
 
Unit 2- Data Warehouse Logical Design.pptx
Unit 2- Data Warehouse Logical Design.pptxUnit 2- Data Warehouse Logical Design.pptx
Unit 2- Data Warehouse Logical Design.pptx
Rakesh Bachchan
 
Application Middleware Overview
Application Middleware OverviewApplication Middleware Overview
Application Middleware Overview
Christalin Nelson
 
Schema_______________Types__________.pdf
Schema_______________Types__________.pdfSchema_______________Types__________.pdf
Schema_______________Types__________.pdf
KatonPang
 
An introduction to data warehousing
An introduction to data warehousingAn introduction to data warehousing
An introduction to data warehousing
Shahed Khalili
 
Lesson 3 - The Kimbal Lifecycle.pptx
Lesson 3 - The Kimbal Lifecycle.pptxLesson 3 - The Kimbal Lifecycle.pptx
Lesson 3 - The Kimbal Lifecycle.pptx
calf_ville86
 
Data Warehousing and Data Mining
Data Warehousing and Data MiningData Warehousing and Data Mining
Data Warehousing and Data Mining
idnats
 
Intro to Data warehousing lecture 15
Intro to Data warehousing   lecture 15Intro to Data warehousing   lecture 15
Intro to Data warehousing lecture 15
AnwarrChaudary
 
1-Data Warehousing-Multi Dim Data Model.pptx
1-Data Warehousing-Multi Dim Data Model.pptx1-Data Warehousing-Multi Dim Data Model.pptx
1-Data Warehousing-Multi Dim Data Model.pptx
ShobySunny2
 
Dataware house introduction by InformaticaTrainingClasses
Dataware house introduction by InformaticaTrainingClassesDataware house introduction by InformaticaTrainingClasses
Dataware house introduction by InformaticaTrainingClasses
InformaticaTrainingClasses
 
Data Mining: Concepts and Techniques (3rd ed.) — Chapter _04 olap
Data Mining:  Concepts and Techniques (3rd ed.)— Chapter _04 olapData Mining:  Concepts and Techniques (3rd ed.)— Chapter _04 olap
Data Mining: Concepts and Techniques (3rd ed.) — Chapter _04 olap
Salah Amean
 

Recently uploaded (20)

md-presentHHHHHHHHHHHHHHHHHHHHHHHHHHHHHHation.pptx
md-presentHHHHHHHHHHHHHHHHHHHHHHHHHHHHHHation.pptxmd-presentHHHHHHHHHHHHHHHHHHHHHHHHHHHHHHation.pptx
md-presentHHHHHHHHHHHHHHHHHHHHHHHHHHHHHHation.pptx
fatimalazaar2004
 
Minions Want to eat presentacion muy linda
Minions Want to eat presentacion muy lindaMinions Want to eat presentacion muy linda
Minions Want to eat presentacion muy linda
CarlaAndradesSoler1
 
GenAI for Quant Analytics: survey-analytics.ai
GenAI for Quant Analytics: survey-analytics.aiGenAI for Quant Analytics: survey-analytics.ai
GenAI for Quant Analytics: survey-analytics.ai
Inspirient
 
How iCode cybertech Helped Me Recover My Lost Funds
How iCode cybertech Helped Me Recover My Lost FundsHow iCode cybertech Helped Me Recover My Lost Funds
How iCode cybertech Helped Me Recover My Lost Funds
ireneschmid345
 
Defense Against LLM Scheming 2025_04_28.pptx
Defense Against LLM Scheming 2025_04_28.pptxDefense Against LLM Scheming 2025_04_28.pptx
Defense Against LLM Scheming 2025_04_28.pptx
Greg Makowski
 
03 Daniel 2-notes.ppt seminario escatologia
03 Daniel 2-notes.ppt seminario escatologia03 Daniel 2-notes.ppt seminario escatologia
03 Daniel 2-notes.ppt seminario escatologia
Alexander Romero Arosquipa
 
Ppt. Nikhil.pptxnshwuudgcudisisshvehsjks
Ppt. Nikhil.pptxnshwuudgcudisisshvehsjksPpt. Nikhil.pptxnshwuudgcudisisshvehsjks
Ppt. Nikhil.pptxnshwuudgcudisisshvehsjks
panchariyasahil
 
Thingyan is now a global treasure! See how people around the world are search...
Thingyan is now a global treasure! See how people around the world are search...Thingyan is now a global treasure! See how people around the world are search...
Thingyan is now a global treasure! See how people around the world are search...
Pixellion
 
EDU533 DEMO.pptxccccvbnjjkoo jhgggggbbbb
EDU533 DEMO.pptxccccvbnjjkoo jhgggggbbbbEDU533 DEMO.pptxccccvbnjjkoo jhgggggbbbb
EDU533 DEMO.pptxccccvbnjjkoo jhgggggbbbb
JessaMaeEvangelista2
 
1. Briefing Session_SEED with Hon. Governor Assam - 27.10.pdf
1. Briefing Session_SEED with Hon. Governor Assam - 27.10.pdf1. Briefing Session_SEED with Hon. Governor Assam - 27.10.pdf
1. Briefing Session_SEED with Hon. Governor Assam - 27.10.pdf
Simran112433
 
Ch3MCT24.pptx measure of central tendency
Ch3MCT24.pptx measure of central tendencyCh3MCT24.pptx measure of central tendency
Ch3MCT24.pptx measure of central tendency
ayeleasefa2
 
183409-christina-rossetti.pdfdsfsdasggsag
183409-christina-rossetti.pdfdsfsdasggsag183409-christina-rossetti.pdfdsfsdasggsag
183409-christina-rossetti.pdfdsfsdasggsag
fardin123rahman07
 
Adobe Analytics NOAM Central User Group April 2025 Agent AI: Uncovering the S...
Adobe Analytics NOAM Central User Group April 2025 Agent AI: Uncovering the S...Adobe Analytics NOAM Central User Group April 2025 Agent AI: Uncovering the S...
Adobe Analytics NOAM Central User Group April 2025 Agent AI: Uncovering the S...
gmuir1066
 
04302025_CCC TUG_DataVista: The Design Story
04302025_CCC TUG_DataVista: The Design Story04302025_CCC TUG_DataVista: The Design Story
04302025_CCC TUG_DataVista: The Design Story
ccctableauusergroup
 
computer organization and assembly language.docx
computer organization and assembly language.docxcomputer organization and assembly language.docx
computer organization and assembly language.docx
alisoftwareengineer1
 
Day 1 - Lab 1 Reconnaissance Scanning with NMAP, Vulnerability Assessment wit...
Day 1 - Lab 1 Reconnaissance Scanning with NMAP, Vulnerability Assessment wit...Day 1 - Lab 1 Reconnaissance Scanning with NMAP, Vulnerability Assessment wit...
Day 1 - Lab 1 Reconnaissance Scanning with NMAP, Vulnerability Assessment wit...
Abodahab
 
Geometry maths presentation for begginers
Geometry maths presentation for begginersGeometry maths presentation for begginers
Geometry maths presentation for begginers
zrjacob283
 
Simple_AI_Explanation_English somplr.pptx
Simple_AI_Explanation_English somplr.pptxSimple_AI_Explanation_English somplr.pptx
Simple_AI_Explanation_English somplr.pptx
ssuser2aa19f
 
VKS-Python Basics for Beginners and advance.pptx
VKS-Python Basics for Beginners and advance.pptxVKS-Python Basics for Beginners and advance.pptx
VKS-Python Basics for Beginners and advance.pptx
Vinod Srivastava
 
AI Competitor Analysis: How to Monitor and Outperform Your Competitors
AI Competitor Analysis: How to Monitor and Outperform Your CompetitorsAI Competitor Analysis: How to Monitor and Outperform Your Competitors
AI Competitor Analysis: How to Monitor and Outperform Your Competitors
Contify
 
md-presentHHHHHHHHHHHHHHHHHHHHHHHHHHHHHHation.pptx
md-presentHHHHHHHHHHHHHHHHHHHHHHHHHHHHHHation.pptxmd-presentHHHHHHHHHHHHHHHHHHHHHHHHHHHHHHation.pptx
md-presentHHHHHHHHHHHHHHHHHHHHHHHHHHHHHHation.pptx
fatimalazaar2004
 
Minions Want to eat presentacion muy linda
Minions Want to eat presentacion muy lindaMinions Want to eat presentacion muy linda
Minions Want to eat presentacion muy linda
CarlaAndradesSoler1
 
GenAI for Quant Analytics: survey-analytics.ai
GenAI for Quant Analytics: survey-analytics.aiGenAI for Quant Analytics: survey-analytics.ai
GenAI for Quant Analytics: survey-analytics.ai
Inspirient
 
How iCode cybertech Helped Me Recover My Lost Funds
How iCode cybertech Helped Me Recover My Lost FundsHow iCode cybertech Helped Me Recover My Lost Funds
How iCode cybertech Helped Me Recover My Lost Funds
ireneschmid345
 
Defense Against LLM Scheming 2025_04_28.pptx
Defense Against LLM Scheming 2025_04_28.pptxDefense Against LLM Scheming 2025_04_28.pptx
Defense Against LLM Scheming 2025_04_28.pptx
Greg Makowski
 
Ppt. Nikhil.pptxnshwuudgcudisisshvehsjks
Ppt. Nikhil.pptxnshwuudgcudisisshvehsjksPpt. Nikhil.pptxnshwuudgcudisisshvehsjks
Ppt. Nikhil.pptxnshwuudgcudisisshvehsjks
panchariyasahil
 
Thingyan is now a global treasure! See how people around the world are search...
Thingyan is now a global treasure! See how people around the world are search...Thingyan is now a global treasure! See how people around the world are search...
Thingyan is now a global treasure! See how people around the world are search...
Pixellion
 
EDU533 DEMO.pptxccccvbnjjkoo jhgggggbbbb
EDU533 DEMO.pptxccccvbnjjkoo jhgggggbbbbEDU533 DEMO.pptxccccvbnjjkoo jhgggggbbbb
EDU533 DEMO.pptxccccvbnjjkoo jhgggggbbbb
JessaMaeEvangelista2
 
1. Briefing Session_SEED with Hon. Governor Assam - 27.10.pdf
1. Briefing Session_SEED with Hon. Governor Assam - 27.10.pdf1. Briefing Session_SEED with Hon. Governor Assam - 27.10.pdf
1. Briefing Session_SEED with Hon. Governor Assam - 27.10.pdf
Simran112433
 
Ch3MCT24.pptx measure of central tendency
Ch3MCT24.pptx measure of central tendencyCh3MCT24.pptx measure of central tendency
Ch3MCT24.pptx measure of central tendency
ayeleasefa2
 
183409-christina-rossetti.pdfdsfsdasggsag
183409-christina-rossetti.pdfdsfsdasggsag183409-christina-rossetti.pdfdsfsdasggsag
183409-christina-rossetti.pdfdsfsdasggsag
fardin123rahman07
 
Adobe Analytics NOAM Central User Group April 2025 Agent AI: Uncovering the S...
Adobe Analytics NOAM Central User Group April 2025 Agent AI: Uncovering the S...Adobe Analytics NOAM Central User Group April 2025 Agent AI: Uncovering the S...
Adobe Analytics NOAM Central User Group April 2025 Agent AI: Uncovering the S...
gmuir1066
 
04302025_CCC TUG_DataVista: The Design Story
04302025_CCC TUG_DataVista: The Design Story04302025_CCC TUG_DataVista: The Design Story
04302025_CCC TUG_DataVista: The Design Story
ccctableauusergroup
 
computer organization and assembly language.docx
computer organization and assembly language.docxcomputer organization and assembly language.docx
computer organization and assembly language.docx
alisoftwareengineer1
 
Day 1 - Lab 1 Reconnaissance Scanning with NMAP, Vulnerability Assessment wit...
Day 1 - Lab 1 Reconnaissance Scanning with NMAP, Vulnerability Assessment wit...Day 1 - Lab 1 Reconnaissance Scanning with NMAP, Vulnerability Assessment wit...
Day 1 - Lab 1 Reconnaissance Scanning with NMAP, Vulnerability Assessment wit...
Abodahab
 
Geometry maths presentation for begginers
Geometry maths presentation for begginersGeometry maths presentation for begginers
Geometry maths presentation for begginers
zrjacob283
 
Simple_AI_Explanation_English somplr.pptx
Simple_AI_Explanation_English somplr.pptxSimple_AI_Explanation_English somplr.pptx
Simple_AI_Explanation_English somplr.pptx
ssuser2aa19f
 
VKS-Python Basics for Beginners and advance.pptx
VKS-Python Basics for Beginners and advance.pptxVKS-Python Basics for Beginners and advance.pptx
VKS-Python Basics for Beginners and advance.pptx
Vinod Srivastava
 
AI Competitor Analysis: How to Monitor and Outperform Your Competitors
AI Competitor Analysis: How to Monitor and Outperform Your CompetitorsAI Competitor Analysis: How to Monitor and Outperform Your Competitors
AI Competitor Analysis: How to Monitor and Outperform Your Competitors
Contify
 
Ad

Lecture 3:Introduction to Dimensional Modelling.pptx

  • 1. Lecture 3 Introduction to Dimensional Modeling
  • 2. 01/27/2025 Topics to cover • Understanding key concepts in dimensional modeling • Importance of dimensional modeling • Dimensional modeling vs ER modeling • Types of dimensional models • A DWH as a Multidimensional Model IS 301 2
  • 3. 01/27/2025 Data Warehouse Design  Designing the data warehouse is a key issue in the DWH process.  Although a DWH can be designed by entity relationship modeling , many DWH experts including Kimball et al… prefer dimensional modeling. IS 301 3
  • 4. 01/27/2025 Dimensional modeling is the process and outcome of designing logical database schemas created to support OLAP and Data Warehousing Solutions. It is especially useful for summarizing and rearranging the data and presenting views of the data to support data analysis. Dimension: A category of information, for example, the time dimension. Attribute: A unique level within a dimension, for example, Month is an attribute in the Time Dimension. Hierarchy: The specification of levels that represents relationship between different attributes within a dimension. For example, one possible hierarchy in the Time dimension is Year → Quarter → Month → Day. Dimensional Modeling IS 301 4
  • 5. 01/27/2025 Issues to note: 1. Dimensions and hierarchies are represented by dimensional tables. 2. Attributes are the non-key columns in the dimensional tables. 3. Fact tables connect to one or more dimensional tables, but fact tables do not have direct relationships to one another. Dimensional Modeling IS 301 5
  • 6. IS 301 Dimensional Modeling Time Locations Year Country Quarterly District Monthly Village Measured Facts: annual sales amounts per village Attributes in their hierarchy Dimensions Lecture 3-6
  • 7. 01/27/2025 IS 301 7 Some examples: – The analysis of a product sales to a customer during last six month has three dimensions –: customer, product and time – The analysis of a product sales to a customer in the a district during last six month has four dimensions –: customer, product, region, and time • By the rule, the time is always one of the dimensions Dimensional Modeling
  • 8. 01/27/2025 IS 301 8 Dimensional Modeling Data Granularity • The grain defines the level of detail of a single record in the fact table. • The more detail there is in the fact table, the higher its granularity and vice versa.
  • 9. 01/27/2025 IS 301 9 Dimensional Modeling Data Granularity example • A fact table contains three metrics (Unit Price, Units Sold and Total Sale Amount). – The Time dimension consists of four hierarchical elements (Year, Quarter, Month and Day). – The Organization dimension consists of three hierarchical elements (Region, District and Store). – The Product dimension consists of two hierarchical elements (Product Family and SKU(Stock Keeping Unit)). • The highest granularity that we can store Sales metrics is by Day/Store/SKU (i.e., the lowest level in each dimensional hierarchy). • Conversely, the lowest granularity that we can aggregate Sales metrics to in this data mart is by Year/Region/Product Family (i.e., the highest level in each dimensional hierarchy).
  • 10. 01/27/2025 IS 301 10 Benefits of using Dimensional Modeling 1. Logical model is easy to understand • Provides a predictable and standard framework for end user apps. Report writers, query tools, and user interfaces can all make strong assumptions about the dimensional model to make the user interfaces more understandable. • Model can be done (mostly) independent of expected queries since it withstands unexpected changes in user behavior • Handle changes easily – such as adding new dimensional attributes since there is no need to reload data and no need to reprogram query tools 2. Optimized for performance • High performance “browsing” across the attributes • Strategy to handling aggregates .i.e. Summary records that are logically redundant with base data already in the data warehouse, but they are used to enhance query performance. • OLAP engines can make processing more efficient 3. Historical tracking of information – Strategies for handling changing dimensions – Fact design allows high volume snapshots and transaction Tracking Dimension Tables
  • 11. 01/27/2025 IS 301 11 Dimensional Model vs ER model • The key to understanding the relationship between DM and ER is that a single ER diagram breaks down into multiple DM diagrams, or ‘stars’. • Think of a large ER diagram as representing every possible business process within an application. The ER diagram may have Sales Calls, Order Entries, Shipment Invoices, Customer Payments, and Product Returns, all on the same diagram.
  • 12. 01/27/2025 IS 301 12 Dimensional Model vs ER model • To create the individual ‘stars’ that exist within an application: – Look for many-to-many relationships in the ER model containing numeric and additive facts and designate them as fact tables. – Alternatively, look for ‘events’ or ‘transactions’ – these may also be facts – De-normalize all of the remaining tables into flat tables with single-part keys that connect directly to the fact tables. These tables become the dimension tables.
  • 13. 01/27/2025 IS 301 13 Dimensional Model vs ER model Shipments Returns Sales Contact Orders Payments
  • 14. 01/27/2025 IS 301 14 ERD versus DM Order Customer Order- line Product Product- type Region Order_ fact Product_ dimension Customer_ dimension Time_ dimension Product- group
  • 15. 01/27/2025 IS 301 15 Dimensional Model vs ER model • ER models are not appropriate for Data Warehouses. ER modeling does not really model a business; rather, it models the micro relationships among data elements. • ER models are wildly variable in structure. As such, it is extremely difficult to optimize query performance.
  • 16. 01/27/2025 IS 301 ER Modeling vs Dimensional modeling Relational DM Dimensional DM 1. Data is stored in RDBMS 2. Tables are units of storage 3. Data is normalized and used for OLTP. Optimized for OLTP processing 4. Several tables and chains of relationships among them 5. Volatile(several updates) 6. User is usually constrained by an application that understands the data design. Users are typically operations staff. 1. Data is stored in RDBMS or Multidimensional databases 2. Cubes are units of storage 3. Data is denormalized and used in datawarehouse and data mart. Optimized for OLAP 4. Few tables and fact tables are connected to dimensional tables 5. Non volatile 6. The simpler data design makes it easier for users to analyze data in any way they choose. Users are typically analysts, company strategists, or even executives 16
  • 17. 01/27/2025 IS 301 ER Modeling vs Dimensional modeling Relational DM Dimensional DM 7. SQL is used to manipulate data 8. Detailed level of transactional data 9. Normal Reports 10. Typical data design used for business transaction systems 11. Goal – reduce every piece of information to it’s simplest form – a debit transaction, a customer record, an address. 12. Suited for concurrent handling of many small transactions by many users. Only a limited amount of data history is normally kept. 7. MDX is used to manipulate data 8. Summary of bulky transactional data(Aggregates and Measures) used in business decisions 9. User friendly, interactive, drag and drop multidimensional OLAP Reports 10. Data design used for analysis systems 11. Goal – break up information into ‘Facts’ – things a company measures and ‘Dimensions’ - how we measure them: by time, region, or customer 12. Suited for reading or analyzing large amounts of data by a modest numbers of users. Many years of data history may be kept. 17
  • 18. 01/27/2025 IS 301 18 What is a Dimensional Model? • A dimensional model is a star schema that contains two types of tables, fact tables and dimension tables. 1. Fact table (quantitative) – a fact table is the primary table in a dimensional model where the numerical performance measurement of the business are stored. I.e. attributes of numeric and additive. Example: quantity sold, dollar sales amount. 2. Dimension table ( descriptive) – tables that contain the textual descriptors of the business. Example: product and brand descriptions.
  • 19. 01/27/2025 •A fact table is a table that contains the measures of interest. For example, sales amount would be such a measure. •This measure is stored in the fact table with the appropriate granularity. For example, it can be sales amount by store by day. In this case, the fact table would contain three columns: A date column, a store column, and a sales amount column. •Numeric • Additive – across dimensions. Hundreds and thousands of records are fetched from the database, the useful thing to do with so many records is to add them up. • Primary keys of dimensions (surrogate keys) become foreign keys in the fact table. •Consider rolling summaries Fact Table IS 301 19
  • 20. 01/27/2025 Rolling summary Day 2 Day 5 Week 1 Week 2 Week 3 Week 4 Day 3 Day 4 Day 6 Day 7 Month 1 Month 2 Month 3 Qrt 1 Qrt 2 Qrt 3 Qrt 4 Day 1 Month 12 ………. IS 301 20
  • 21. 01/27/2025 •A dimensional table provides the detailed information about the attributes. For example, the dimensional table for the Quarter attribute would include a list of all of the quarters available in the data warehouse. •Each row (each quarter) may have several fields, one for the unique ID that identifies the quarter, and one or more additional fields that specifies how that particular quarter is represented on a report (for example, first quarter of 2001 may be represented as "Q1 2001" or "2001 Q1"). Dimensional Table IS 301 21
  • 22. 01/27/2025 Three basic types of dimensional models, and they are: 1. Star model 2. Snowflake model 3. Fact constellation model Types of dimensional models IS 301 22
  • 23. 01/27/2025 • a single object (the fact table) sits in the middle and is radically connected to other surrounding objects (dimension tables) like a star. • Each dimension is represented as a single table. The primary key in each dimension table is related to a foreign key in the fact table. Star model IS 301 23
  • 24. 01/27/2025 IS 301 24 Example of Star Schema
  • 25. 01/27/2025 Example of Star Schema time_key day day_of_the_week month quarter year time location_key street city province_or_street country location Sales Fact Table time_key item_key branch_key location_key units_sold dollars_sold avg_sales Measures item_key item_name brand type supplier_type item branch_key branch_name branch_type branch IS 301 25
  • 26. 01/27/2025 IS 301 26 Star Schema with Sample Data 001 002 001 003 002 001 002 001
  • 27. 01/27/2025 IS 301 27 Relationship of a Star Schema model to a Report • Question answered what, when, by whom, and to whom. – Results got by combining (joining one or more dimension tables with the fact table) • Example – The Marketing Dept wants to know the quantity of and order amount of PCs sold, relating to customers who are married obtained by sales persons in the Makerere region in the month of March.
  • 28. 01/27/2025 IS 301 28 Relationship of a Star Schema model to a Report Order Facts Table Product Key (FK) Time Key (FK) Customer Key (FK) Sales Person Key (FK) Order Shillings Cost Shillins Margin Shillings Quanty Product Dimension Table PK Product Key Product Name Product Code Product Line Brand Sales Person Dimension Table PK Sales Person Key Sales Person NAme Territory Name Region Name Customer Dimension Table PK Customer Key Customer Name Customer Code Marital Status Address Town Time Dimension Table PK Time Key Date Month Quarter Year Product name = PCs Month = March Marital Status = Married Region Name = Makerere
  • 29. 01/27/2025 1. Easy to understand 2. Easy to define hierarchies 3. Reduces number of physical joins 4. Low maintenance 5. Very simple metadata Benefits of a Star model IS 301 29
  • 30. 01/27/2025 A refinement of star schema where some dimensional hierarchy is normalized into a set of smaller dimension tables, forming a shape similar to snowflake Snowflake model IS 301 30
  • 31. 01/27/2025 IS 301 Example of Snowflake Schema time_key day day_of_the_week month quarter year time location_key street city_key location Sales Fact Table time_key item_key branch_key location_key units_sold dollars_sold avg_sales Measures item_key item_name brand type supplier_key item branch_key branch_name branch_type branch supplier_key supplier_type supplier city_key city province_or_street country city 31
  • 32. 01/27/2025 IS 301 32 Example of a snowflake schema- a student attendance DWH
  • 33. 01/27/2025 IS 301 33 Benefits of snowflaking 1. Used in OLAP multidimensional database modeling tools that use dimensional data marts as a data source. 2. Appropriate for use where a dimension table occupies a significant proportion of the database as a result of querying very sparse dimensions or dimensions with many attributes 3. Easier to use in cases where there is need to add a multidimensional view to an existing transactional database for decision making. 4. A snowflake schema can sometimes reflect the way in which users think about data. 5. Useful in conventional multidimensional reporting tools where queries cannot be represented by simple star schema.
  • 34. 01/27/2025 A fact constellation model is a dimensional model that consists of multiple fact tables, joined together through dimensions. Multiple fact tables share dimension tables, viewed as a collection of stars, therefore called galaxy schema or fact constellation In this case a dimension table connects to more than one fact table, we therefore refer to the dimension tables as "conformed" between the two dimensional models. Fact Constellation model IS 301 34
  • 35. 01/27/2025 Example of Fact Constellation time_key day day_of_the_week month quarter year time location_key street city province_or_street country location Sales Fact Table time_key item_key branch_key location_key units_sold dollars_sold avg_sales Measures item_key item_name brand type supplier_type item branch_key branch_name branch_type branch Shipping Fact Table time_key item_key shipper_key from_location to_location dollars_cost units_shipped shipper_key shipper_name location_key shipper_type shipper IS 301 35
  • 36. 01/27/2025 IS 301 36 Common uses • These schemas are most commonly found in dimensional DWHs and data marts where speed of data retrieval is more important than the efficiency of data manipulations. • The decision whether to employ a star schema or a snowflake schema or a fact constellation schema should consider the relative strengths of the database platform in question and the query tool to be employed. – Star schema should be favored with query tools that largely expose users to the underlying table structures, and in environments where most queries are simpler in nature. – Snowflake schema are often better with more sophisticated query tools that isolate users from the raw table structures and for environments having numerous queries with complex criteria.
  • 37. 01/27/2025 IS 301 37 Schema Keys • Dimension Business Key – Column or columns that identify a unique instance of the business record (not necessarily a unique record in the dimension table) – Used in the ETL process to tie fact records with dimension members • Dimension Record Surrogate Keys – Defines the dimension’s primary key – Relates to the fact table foreign key field – Numeric data type, typically integer (2,4,8 byte) • Foreign Keys – Each Dimensional Table has a one-to-many relationship with the central fact table – The PK of each Dimension Table must be a Foreign Key in the Fact Table
  • 38. 01/27/2025 IS 301 38 Why use surrogate Keys • Data tables in various source systems may use different keys for the same entity. Legacy systems that provide historical data might have used a different numbering system than a current online transaction processing system. A surrogate key uniquely identifies each entity in the dimension table regardless of its source key. A separate field can be used to contain the key used in the source system. • Systems developed independently in company divisions may not use the same keys, or they may use keys that conflict with data in the systems of other divisions. This situation may not cause problems when each division independently reports summary data, but it cannot be permitted in the data warehouse where data is consolidated. • Keys may change or be reused in the source data systems. This situation is usually less likely than others, but some systems have been known to reuse keys belonging to obsolete data. However, the key may still be in use in historical data in the data warehouse, and the same key cannot be used to identify different entities.
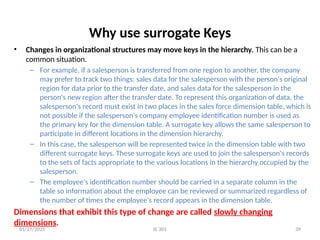
  • 39. 01/27/2025 IS 301 39 Why use surrogate Keys • Changes in organizational structures may move keys in the hierarchy. This can be a common situation. – For example, if a salesperson is transferred from one region to another, the company may prefer to track two things: sales data for the salesperson with the person's original region for data prior to the transfer date, and sales data for the salesperson in the person's new region after the transfer date. To represent this organization of data, the salesperson's record must exist in two places in the sales force dimension table, which is not possible if the salesperson's company employee identification number is used as the primary key for the dimension table. A surrogate key allows the same salesperson to participate in different locations in the dimension hierarchy. – In this case, the salesperson will be represented twice in the dimension table with two different surrogate keys. These surrogate keys are used to join the salesperson's records to the sets of facts appropriate to the various locations in the hierarchy occupied by the salesperson. – The employee's identification number should be carried in a separate column in the table so information about the employee can be reviewed or summarized regardless of the number of times the employee's record appears in the dimension table. Dimensions that exhibit this type of change are called slowly changing dimensions.
  • 40. 01/27/2025 IS 301 40 Multi-dimensional Databases • A data warehouse is based on a multidimensional data model • A multidimensional database (MDDB) reflects the multi-dimensional characteristics of data internally • Stores the data in a giant hypercube • Makes it easy for computer to locate any item of interest.
  • 41. 01/27/2025 IS 301 41 Multi-dimensional Data Product R e g i o n Month Hierarchical summarization paths Dimensions: Product, Location, Time Industry Region Year Category Country Quarter Product City Month Week Office Day Sales volume as a function of product, month, and region
  • 42. 01/27/2025 IS 301 42 Data Cube/Hypercube • Hypercubes summarise data into dimensions • Multidimensional Hypercubes enable managers to analyse values at the intersection of these dimensions Total annual sales of TVs in U.S.A. Date P r o d u c t Country sum sum TV VC R PC 1Qtr 2Qtr 3Qtr 4Qtr U.S.A Canada Mexico sum
  • 43. 01/27/2025 IS 301 43 What are Data Cubes • Data Cubes are multidimensional data resources • Data Cubes allow you to look at complex data in a simple format • Data Cubes allow you to analyze specific data
  • 44. 01/27/2025 IS 301 44 Parts of the Data Cube Filters: Ability to look at only one portion of a dimension. Example – GSFC instead of All Centers. Measures: Method of counting. How the dimension is being counted. Dimensions: The category that is being counted. Example – GSFC Employees, Employee Type etc.
  • 45. • Data Cubes look like a simple spreadsheet • Just choose what data you want in your columns and your rows and the totals self-populate – In this example, Centers are in the columns and some dates are in the rows How to use a Data Cube Lecture 3-46 IS 301
  • 46. How to choose your Columns • To choose a column, simply click on the pull-down menu and choose your data • The column pull-down menu is located just to the right of the column header labels Lecture 3-47 IS 301
  • 47. How to choose your Rows • To choose a row, simply click on the pull-down menu and choose your data The row pull-down menu is located just below the row header labels Lecture 3-48 IS 301
  • 48. Filters • After choosing the columns and rows, you may choose what segment of the population you want to view • Use drop-down boxes to determine what data you want to focus on Lecture 3-49 IS 301
  • 49. 01/27/2025 IS 301 50 Measures • You may also choose how the data is counted or measured – The most common measure is headcount – Other measures include: • Average Age • Average Years of Federal Service • Average Annual Salary • Aggregate Salary
  • 50. Measures • Use the drop-down box to choose a measure Lecture 3-51 IS 301
  • 51. View Data As . . . • You may also choose to view the data as a number or as a percentage • Just use the View Data As drop down box Lecture 3-52 IS 301

Editor's Notes

  • #34: Let's look at an example: Assume our data warehouse keeps store sales data, and the different dimensions are time, store, product, and customer. In this case, the figure on the left repesents our star schema. The lines between two tables indicate that there is a primary key / foreign key relationship between the two tables. Note that different dimensions are not related to one another.