SlideShare a Scribd company logo
Statistics One
Lecture 3
Variables, Distributions, & Scales
1
Three segments
•  Variables
•  Distributions
•  Scales

2
Lecture 3 ~ Segment 1
Types of variables

3
Variables
•  Variables can take on multiple values
•  In contrast, a constant has only one value

4
Apples and gravity

5
Variables
•  The size, shape, weight, and type of apple
are all variables
•  Gravity, or gravitational force, is a constant
on Earth
6
Types of variables
• 
• 
• 
• 

Nominal
Ordinal
Interval
Ratio

7
Stevens (1946)

8
Types of variables
•  Nominal variables
–  Used to assign individual cases to categories
•  For example, Coursera students come from many
different countries
•  Country of Origin is a nominal variable

9
Types of variables
•  Ordinal variables
–  Used to rank order cases
•  For example, countries may be ranked according to
overall population
•  Ranking is an ordinal variable

10
Types of variables
•  Interval variables
–  Used to rank order cases and the distance, or
interval, between each value is equal
•  For example, each country has a longitude and
latitude
•  Longitude and Latitude are interval variables

11
Types of variables

12
Types of variables
•  Ratio variables
–  The same as interval variables but they have a
“true zero”
•  For example, Population (Population = 0 = extinct)
•  For example, Age (Age = 0 literally means NO age)
•  For example, Temperature K° (the Kelvin scale)

13
Stevens (1946)

14
Types of variables
•  Preview of variables in this course
–  Nominal variables
•  Independent variables in experimental research
–  For example, treatment to prevent polio (vaccine, placebo)

•  Quasi-independent variables in correlational research
–  For example, gender (female, male)

15
Types of variables
•  Preview of variables in this course
–  Interval and Ratio variables
•  Dependent variables in experimental research
–  For example, rate of polio in a community

•  Measured variables in correlational research
–  For example, intelligence test scores

16
Types of variables
•  Preview of variables in this course
–  Discrete vs. continuous variables
•  Nominal variables are discrete (categorical)
•  Interval and ratio variables are continuous
•  Ordinal variables are technically discrete but they are
often treated as continuous in statistical analyses
(more on this later)
17
Segment summary
•  Types of variables
–  Nominal
–  Ordinal
–  Interval
–  Ratio

18
END SEGMENT

19
Lecture 3 ~ Segment 2
Distributions: Histograms

20
Histograms
•  A histogram is a type of graph used to
display a distribution

21
Histograms
•  Why start with histograms?
–  To overcome the natural tendency to rely
upon summary information, such as an
average

22
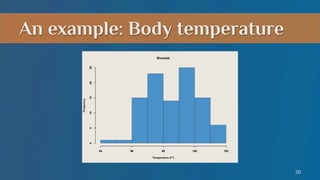
An example: Body temperature

23
An example: Body temperature

24
Histograms
•  Histograms can reveal information not
captured by summary statistics
–  Suppose a few children in a school are sick with
influenza (flu) and have a high temperature
•  The distribution will be positively skewed

25
An example: Body temperature

26
An example: Body temperature

27
Histograms
•  Not all distributions are normal

–  Suppose one group of children had the flu a week
prior to a second sick group of children
–  Assume the first group received antiobiotics,
which temporarily caused their body
temperatures to be slightly below normal, while
the second group was still above normal
28
An example: Body temperature
Normal, below average

Normal, above average

29
An example: Body temperature

30
An example: Body temperature
Normal, below average

Normal, above average

31
An example: Body temperature

32
Histograms
•  Not all distributions are normal
–  Simply viewing a histogram often reveals
whether a distribution is normal or not normal
–  However, sometimes it is hard to determine
•  Summary statistics help in such cases

33
Histograms
•  Not all distributions are normal
–  As you view more and more distributions you will
get a better sense of what is normal and what is
not normal
–  So, let’s look at more distributions

34
Wine tasting!

35
An example: Wine ratings
•  Suppose that 100 wine experts rated the
overall quality of 8 different wines on a scale
of 1 to 100
–  Higher scores indicate higher quality

36
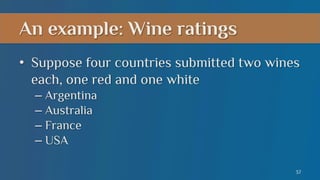
An example: Wine ratings
•  Suppose four countries submitted two wines
each, one red and one white
–  Argentina
–  Australia
–  France
–  USA
37
An example: Wine ratings
Malbec & Chardonnay

Shiraz & Pinot Grigio

38
An example: Wine ratings
Bourdeaux & Sauvignon Blanc

Cabarnet & Reisling

39
An example: Wine ratings
•  Preview
–  The ratings of the red wines are normal
–  The ratings of the whites are not normal

40
An example: Wine ratings
Red, Argentina

Red, Australia

41
Four histograms
Red, France

Red, USA

42
An example: Wine ratings
White, Argentina

White, Australia

43
An example: Wine ratings
White, France

White, USA

44
Segment summary
•  Histograms are used to display distributions
•  Many distributions are normal

45
Segment summary
•  Some distributions are not normal, for
example:
–  Bi-modal
–  Positively skewed
–  Negatively skewed
–  Uniform (platykurtic)
–  Leptokurtic

46
Advanced graphs

47
Advanced graphs

48
Advanced graphs

49
Advanced graphs

50
END SEGMENT

51
Lecture 3 ~ Segment 3
Scales of measurement

52
Scales
•  Scales of measurement
–  For example, in the last segment body
temperature was presented in both Fahrenheit
and in Celsius
•  Different scales but both measure temperature
•  F° can be converted to C° and vice-versa

53
Scales
•  In statistics, there is a standard scale
–  The Z scale

•  Any score from any scale can be converted
–  To Z scores

•  Allows for efficient communication
54
Z scores
•  Z = (X – M) / SD
•  X is a score on an original scale (raw score)
•  M is the mean
•  SD is the standard deviation

55
Z scores
•  Z = (X – M) / SD
•  The mean Z-score is Z = 0
•  Positive Z scores are above average
•  Negative Z scores are below average

56
Body temperature F°

57
Body temperature C°

58
Body temperature Z

59
Z scores
•  For example, assume M = 98.6, SD = .5
•  Suppose an individual, X = 99.6
•  Convert X to Z

60
Z scores
•  Convert X to Z
•  Z = (X – M) / SD
•  Z = (99.6 – 98.6) / .5 = 2
•  Z = 2

61
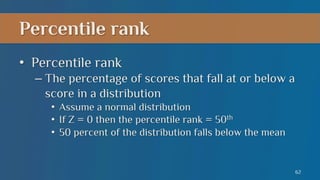
Percentile rank
•  Percentile rank
–  The percentage of scores that fall at or below a
score in a distribution
•  Assume a normal distribution
•  If Z = 0 then the percentile rank = 50th
•  50 percent of the distribution falls below the mean

62
Body temperature Z

63
Segment summary
•  The Z-scale is the standard scale in statistics
•  Raw scores can be converted to Z-scores
•  Z-scores can be used to find percentile rank
•  Raw score ~ Z-score ~ Percentile rank

64
END SEGMENT

65
END LECTURE 3

66

More Related Content

Similar to Lecture slides stats1.13.l03.air (20)

PDF
1Basic biostatistics.pdf
YomifDeksisaHerpa
 
PPTX
Introduction to statistics.pptx
MuddaAbdo1
 
PPT
Stats-Review-Maie-St-John-5-20-2009.ppt
DiptoKumerSarker1
 
PPTX
Applying_basic_health_statstics_2024_final.pptx
gebeyehu5
 
PDF
IV STATISTICS I.pdf
PyaePhyoKoKo2
 
PDF
Biostatistics ppt.pdf
AbdulrezakHusein
 
PPTX
Biostatistics
Dr. Senthilvel Vasudevan
 
PPT
Ebd1 lecture 3 2010
Reko Kemo
 
PPT
Ebd1 lecture 3 2010
Reko Kemo
 
PPT
Ebd1 lecture 3 2010
Reko Kemo
 
PPT
Business statistics (Basics)
AhmedToheed3
 
PPT
businessstatistics-stat10022-200411201812.ppt
tejashreegurav243
 
PPTX
Biostatistics ppt.pptx
GammachuuTarrafaa
 
PPT
Descriptivestatistics
Carla Piper
 
PPT
Week 7 a statistics
wawaaa789
 
PPTX
Understanding statistics in research
Dr. Senthilvel Vasudevan
 
PDF
Introduction.pdf
MuhammadFaizan389
 
PPT
EDUCATIONAL STATISTICS_Unit_I.ppt
Sasi Kumar
 
PPT
Statistics and probability lecture 01
MuhammadTufailKaran
 
PPT
Statistics and probability
Muhammad Mayo
 
1Basic biostatistics.pdf
YomifDeksisaHerpa
 
Introduction to statistics.pptx
MuddaAbdo1
 
Stats-Review-Maie-St-John-5-20-2009.ppt
DiptoKumerSarker1
 
Applying_basic_health_statstics_2024_final.pptx
gebeyehu5
 
IV STATISTICS I.pdf
PyaePhyoKoKo2
 
Biostatistics ppt.pdf
AbdulrezakHusein
 
Ebd1 lecture 3 2010
Reko Kemo
 
Ebd1 lecture 3 2010
Reko Kemo
 
Ebd1 lecture 3 2010
Reko Kemo
 
Business statistics (Basics)
AhmedToheed3
 
businessstatistics-stat10022-200411201812.ppt
tejashreegurav243
 
Biostatistics ppt.pptx
GammachuuTarrafaa
 
Descriptivestatistics
Carla Piper
 
Week 7 a statistics
wawaaa789
 
Understanding statistics in research
Dr. Senthilvel Vasudevan
 
Introduction.pdf
MuhammadFaizan389
 
EDUCATIONAL STATISTICS_Unit_I.ppt
Sasi Kumar
 
Statistics and probability lecture 01
MuhammadTufailKaran
 
Statistics and probability
Muhammad Mayo
 

More from atutor_te (20)

PDF
Lecture slides stats1.13.l24.air
atutor_te
 
PDF
Lecture slides stats1.13.l22.air
atutor_te
 
PDF
Lecture slides stats1.13.l21.air
atutor_te
 
PDF
Lecture slides stats1.13.l20.air
atutor_te
 
PDF
Lecture slides stats1.13.l19.air
atutor_te
 
PDF
Lecture slides stats1.13.l18.air
atutor_te
 
PDF
Lecture slides stats1.13.l17.air
atutor_te
 
PDF
Lecture slides stats1.13.l16.air
atutor_te
 
PDF
Lecture slides stats1.13.l15.air
atutor_te
 
PDF
Lecture slides stats1.13.l14.air
atutor_te
 
PDF
Lecture slides stats1.13.l13.air
atutor_te
 
PDF
Lecture slides stats1.13.l12.air
atutor_te
 
PDF
Lecture slides stats1.13.l11.air
atutor_te
 
PDF
Lecture slides stats1.13.l10.air
atutor_te
 
PDF
Lecture slides stats1.13.l09.air
atutor_te
 
PDF
Lecture slides stats1.13.l08.air
atutor_te
 
PDF
Lecture slides stats1.13.l07.air
atutor_te
 
PDF
Lecture slides stats1.13.l06.air
atutor_te
 
PDF
Lecture slides stats1.13.l05.air
atutor_te
 
PDF
Lecture slides stats1.13.l04.air
atutor_te
 
Lecture slides stats1.13.l24.air
atutor_te
 
Lecture slides stats1.13.l22.air
atutor_te
 
Lecture slides stats1.13.l21.air
atutor_te
 
Lecture slides stats1.13.l20.air
atutor_te
 
Lecture slides stats1.13.l19.air
atutor_te
 
Lecture slides stats1.13.l18.air
atutor_te
 
Lecture slides stats1.13.l17.air
atutor_te
 
Lecture slides stats1.13.l16.air
atutor_te
 
Lecture slides stats1.13.l15.air
atutor_te
 
Lecture slides stats1.13.l14.air
atutor_te
 
Lecture slides stats1.13.l13.air
atutor_te
 
Lecture slides stats1.13.l12.air
atutor_te
 
Lecture slides stats1.13.l11.air
atutor_te
 
Lecture slides stats1.13.l10.air
atutor_te
 
Lecture slides stats1.13.l09.air
atutor_te
 
Lecture slides stats1.13.l08.air
atutor_te
 
Lecture slides stats1.13.l07.air
atutor_te
 
Lecture slides stats1.13.l06.air
atutor_te
 
Lecture slides stats1.13.l05.air
atutor_te
 
Lecture slides stats1.13.l04.air
atutor_te
 
Ad

Recently uploaded (20)

PPTX
Comparing Translational and Rotational Motion.pptx
AngeliqueTolentinoDe
 
PDF
Our Guide to the July 2025 USPS® Rate Change
Postal Advocate Inc.
 
PPTX
How to Create & Manage Stages in Odoo 18 Helpdesk
Celine George
 
PPTX
Elo the Hero is an story about a young boy who became hero.
TeacherEmily1
 
PDF
Public Health For The 21st Century 1st Edition Judy Orme Jane Powell
trjnesjnqg7801
 
PPTX
How to Setup Automatic Reordering Rule in Odoo 18 Inventory
Celine George
 
PPTX
Practice Gardens and Polytechnic Education: Utilizing Nature in 1950s’ Hu...
Lajos Somogyvári
 
PDF
COM and NET Component Services 1st Edition Juval Löwy
kboqcyuw976
 
PPTX
How Physics Enhances Our Quality of Life.pptx
AngeliqueTolentinoDe
 
PPTX
PLANNING FOR EMERGENCY AND DISASTER MANAGEMENT ppt.pptx
PRADEEP ABOTHU
 
PPTX
PLANNING A HOSPITAL AND NURSING UNIT.pptx
PRADEEP ABOTHU
 
PPTX
How to Add a Custom Button in Odoo 18 POS Screen
Celine George
 
PPTX
Connecting Linear and Angular Quantities in Human Movement.pptx
AngeliqueTolentinoDe
 
DOCX
MUSIC AND ARTS 5 DLL MATATAG LESSON EXEMPLAR QUARTER 1_Q1_W1.docx
DianaValiente5
 
PDF
TLE 8 QUARTER 1 MODULE WEEK 1 MATATAG CURRICULUM
denniseraya1997
 
PDF
CAD25 Gbadago and Fafa Presentation Revised-Aston Business School, UK.pdf
Kweku Zurek
 
PDF
Rapid Mathematics Assessment Score sheet for all Grade levels
DessaCletSantos
 
PPTX
SYMPATHOMIMETICS[ADRENERGIC AGONISTS] pptx
saip95568
 
PDF
Learning Styles Inventory for Senior High School Students
Thelma Villaflores
 
PPTX
Natural Language processing using nltk.pptx
Ramakrishna Reddy Bijjam
 
Comparing Translational and Rotational Motion.pptx
AngeliqueTolentinoDe
 
Our Guide to the July 2025 USPS® Rate Change
Postal Advocate Inc.
 
How to Create & Manage Stages in Odoo 18 Helpdesk
Celine George
 
Elo the Hero is an story about a young boy who became hero.
TeacherEmily1
 
Public Health For The 21st Century 1st Edition Judy Orme Jane Powell
trjnesjnqg7801
 
How to Setup Automatic Reordering Rule in Odoo 18 Inventory
Celine George
 
Practice Gardens and Polytechnic Education: Utilizing Nature in 1950s’ Hu...
Lajos Somogyvári
 
COM and NET Component Services 1st Edition Juval Löwy
kboqcyuw976
 
How Physics Enhances Our Quality of Life.pptx
AngeliqueTolentinoDe
 
PLANNING FOR EMERGENCY AND DISASTER MANAGEMENT ppt.pptx
PRADEEP ABOTHU
 
PLANNING A HOSPITAL AND NURSING UNIT.pptx
PRADEEP ABOTHU
 
How to Add a Custom Button in Odoo 18 POS Screen
Celine George
 
Connecting Linear and Angular Quantities in Human Movement.pptx
AngeliqueTolentinoDe
 
MUSIC AND ARTS 5 DLL MATATAG LESSON EXEMPLAR QUARTER 1_Q1_W1.docx
DianaValiente5
 
TLE 8 QUARTER 1 MODULE WEEK 1 MATATAG CURRICULUM
denniseraya1997
 
CAD25 Gbadago and Fafa Presentation Revised-Aston Business School, UK.pdf
Kweku Zurek
 
Rapid Mathematics Assessment Score sheet for all Grade levels
DessaCletSantos
 
SYMPATHOMIMETICS[ADRENERGIC AGONISTS] pptx
saip95568
 
Learning Styles Inventory for Senior High School Students
Thelma Villaflores
 
Natural Language processing using nltk.pptx
Ramakrishna Reddy Bijjam
 
Ad

Lecture slides stats1.13.l03.air