Linux kernel tracing
66 likes17,345 views

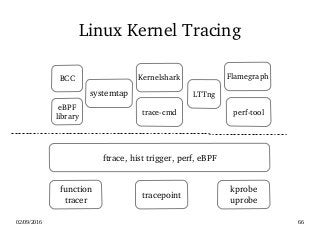
This document discusses tracing in the Linux kernel. It describes various tracing mechanisms like ftrace, tracepoints, kprobes, perf, and eBPF. Ftrace allows tracing functions via compiler instrumentation or dynamically. Tracepoints define custom trace events that can be inserted at specific points. Kprobes and related probes like jprobes allow tracing kernel functions. Perf provides performance monitoring capabilities. eBPF enables custom tracing programs to be run efficiently in the kernel via just-in-time compilation. Tracing tools like perf, systemtap, and LTTng provide user interfaces.


![02/09/2016 9
Issue of printk()
High overhead
“using printk(), especially when writing to the serial
console, may take several milliseconds per write.” ~ [1]](https://image.slidesharecdn.com/linux-kernel-tracing-160821083917/85/Linux-kernel-tracing-9-320.jpg)


![02/09/2016 18
Tracing Data Output
●
trace_printk()
●
/sys/kernel/debug/tracing/
– tracefs (debugfs in the beginning)
“Writing into the ring buffer with trace_printk() only takes around a
tenth of a microsecond or so” ~ [1]](https://image.slidesharecdn.com/linux-kernel-tracing-160821083917/85/Linux-kernel-tracing-18-320.jpg)


![02/09/2016 29
Example hist triggers Logs
# cat /sys/kernel/tracing/events/syscalls/sys_exit_read/hist
[...]
{ common_pid: bash [ 16608] } hitcount: 4 ret: 11722
{ common_pid: bash [ 16616] } hitcount: 4 ret: 12386
{ common_pid: bash [ 16617] } hitcount: 4 ret: 12469
{ common_pid: irqbalance [ 1189] } hitcount: 36 ret: 21702
{ common_pid: snmpd [ 1617] } hitcount: 75 ret: 22078
{ common_pid: sshd [ 32745] } hitcount: 329 ret: 165710
[...]
http://www.brendangregg.com/blog/2016-06-08/linux-hist-triggers.html](https://image.slidesharecdn.com/linux-kernel-tracing-160821083917/85/Linux-kernel-tracing-29-320.jpg)


![02/09/2016 41
Kprobe Overhead [7]
cycles per iteration
AMD Athlon 1.7GH Pentium III 860MHz
kprobe 0.99 us 0.95 us
jprobe 0.82 us 1.61 us](https://image.slidesharecdn.com/linux-kernel-tracing-160821083917/85/Linux-kernel-tracing-41-320.jpg)
![02/09/2016 42
Kprobebased Event Tracing
# echo 'r:myretprobe do_sys_open $retval' >> /sys/kernel/tracing/kprobe_events
# echo 1 > /sys/kernel/tracing/events/kprobes/myretprobe/enable
# cat /sys/kernel/tracing/trace
# tracer: nop
#
# TASKPID CPU# |||| TIMESTAMP FUNCTION
# | | | |||| | |
sh746 [000] d... 40.96: myretprobe: (SyS_open+0x2c/0x30 < do_sys_open) arg1=0x3
sh746 [000] d... 42.19: myretprobe: (SyS_open+0x2c/0x30 < do_sys_open) arg1=0x3
…..](https://image.slidesharecdn.com/linux-kernel-tracing-160821083917/85/Linux-kernel-tracing-42-320.jpg)


![02/09/2016 64
perf + eBPF [8]
●
Linux4.8rc (?) by Wang Nan in Huawei
●
Ongoning staff and future plans
– Load BPF
– Tracing rare outliner
– Integrate LLVM and other frontend](https://image.slidesharecdn.com/linux-kernel-tracing-160821083917/85/Linux-kernel-tracing-64-320.jpg)


![9/2/16 68/70
Reference
[1] Steven Rostedt (Dec. 2009), “Debugging the kernel using Ftrace part 1”, LWN
[2] Steven Rostedt (Feb. 2011), “Using KernelShark to analyze the realtime scheduler”, LWN
[3] 章亦春 , “ 动态追踪技术漫谈”
[4] Brendan Gregg, (Feb. 2016), "Linux 4.x Performance Using BPF Superpowers",
presented at Performance@ scale 2016
[5] Gary Lin (Mar. 2016), “eBPF: Trace from Kernel to Userspace ”, presented at OpenSUSE
Technology Sharing Day 2016
[6] Kernel documentation, “Using the Linux Kernel Tracepoints”
[7] William Cohen (Feb. 2005), “cost of kprobe and jprobe operations”, systemtap mailing list
[8] Wang Nan (Aug. 2016), “Performance Monitoring and AnalysisUsing perf+BPF” ,
LinuxCon North America 2016](https://image.slidesharecdn.com/linux-kernel-tracing-160821083917/85/Linux-kernel-tracing-68-320.jpg)


Ad
More Related Content
What's hot (20)
More from Viller Hsiao (9)


Ad
Recently uploaded (20)


Ad
Linux kernel tracing
- 1. COSCUP 2016 – Linux Kernel Tracing Viller Hsiao <[email protected]> Aug. 21, 2016
- 14. 02/09/2016 14 ftrace ● Linux2.6.27 ● Linux kernel internal tracer framework – Function tracer – Tracing data output – Tracepoint – hist triggers
- 29. 02/09/2016 29 Example hist triggers Logs # cat /sys/kernel/tracing/events/syscalls/sys_exit_read/hist [...] { common_pid: bash [ 16608] } hitcount: 4 ret: 11722 { common_pid: bash [ 16616] } hitcount: 4 ret: 12386 { common_pid: bash [ 16617] } hitcount: 4 ret: 12469 { common_pid: irqbalance [ 1189] } hitcount: 36 ret: 21702 { common_pid: snmpd [ 1617] } hitcount: 75 ret: 22078 { common_pid: sshd [ 32745] } hitcount: 329 ret: 165710 [...] http://www.brendangregg.com/blog/2016-06-08/linux-hist-triggers.html
- 43. 02/09/2016 43 Utilities for Kprobe ● tracefs files – perf probe ● systemtap – debuted in 2005 in Red Hat Enterprise Linux 4 – Probe by DSL script based on kprobe
- 55. 02/09/2016 55 Disadvantage of Previous Kernel Tracing ● Components are isolated ● Complex filters and scripts can be expensive ● Need more comprehensive tools. Some solutions – systemtap – LTTng – Dtrace – ktap
- 58. 02/09/2016 58 eBPF ● (Linux3.15) Redesigned by Alexei Starovoitov – Write programs in restricted C ● compile to BPF with LLVM – Justintime map to modern 64bit CPU with minimal performance overhead
- 59. 02/09/2016 59 Areas Use eBPF more than a filter today ● Seccomp filters of syscalls (chrome sandboxing) ● Packet classifier for traffic contol ● Actions for traffic control ● Xtables packet filtering ● Tracing – (Linux4.1) attach to kprobe – (Linux4.7) attach to tracepoint
- 64. 02/09/2016 64 perf + eBPF [8] ● Linux4.8rc (?) by Wang Nan in Huawei ● Ongoning staff and future plans – Load BPF – Tracing rare outliner – Integrate LLVM and other frontend
- 68. 9/2/16 68/70 Reference [1] Steven Rostedt (Dec. 2009), “Debugging the kernel using Ftrace part 1”, LWN [2] Steven Rostedt (Feb. 2011), “Using KernelShark to analyze the realtime scheduler”, LWN [3] 章亦春 , “ 动态追踪技术漫谈” [4] Brendan Gregg, (Feb. 2016), "Linux 4.x Performance Using BPF Superpowers", presented at Performance@ scale 2016 [5] Gary Lin (Mar. 2016), “eBPF: Trace from Kernel to Userspace ”, presented at OpenSUSE Technology Sharing Day 2016 [6] Kernel documentation, “Using the Linux Kernel Tracepoints” [7] William Cohen (Feb. 2005), “cost of kprobe and jprobe operations”, systemtap mailing list [8] Wang Nan (Aug. 2016), “Performance Monitoring and AnalysisUsing perf+BPF” , LinuxCon North America 2016
- 69. 9/2/16 69/70 ● COSCUP is the Conference for Open Source Coders, Users and Promoters in Taiwan. ● iovisor is a project of Linux Foundation ● ARM are trademarks or registered trademarks of ARM Holdings. ● Linux Foundation is a registered trademark of The Linux Foundation. ● Linux is a registered trademark of Linus Torvalds. ● Other company, product, and service names may be trademarks or service marks of others. ● The license of each graph belongs to each website listed individually. ● The others of my work in the slide is licensed under a CC-BY-SA License. ● License text: http://creativecommons.org/licenses/by-sa/4.0/legalcode Rights to Copy copyright © 2016 Viller Hsiao
- 70. 9/2/16 Viller Hsiao THE END