LoadRunner Performance Testing
43 likes13,233 views

This document provides an overview of LoadRunner performance testing tool. It introduces key concepts such as performance testing, the need for automated performance testing, and the core activities involved. It describes LoadRunner components like VuGen for creating scripts and the Controller for creating scenarios. It also covers topics like protocol support, installation, terminology, recording and enhancing scripts, creating scenarios both manually and goal-oriented, and running/monitoring scenarios.


LoadRunner Performance Testing
- 1. PERFORMANCE TESTING TOOL LOAD RUNNER ATUL PANT
- 3. What'sInside Introduction Performance Testing Need for Automated Performance Testing Key Types of Performance Testing Core Activities of Performance Testing Functional Testing vs. Load Web Testing Performance Testing - Non Functional Testing Requirements
- 4. Non-Functional Testing. Determine the responsiveness, throughput, reliability, and/or scalability of a system under a given workload. Performance testing is the subset of performance engineering, which is focused on addressing performance issues in the design and architecture of software product. *.*.*Goal of Performance Testing*.*.* o Establishing the benchmark behaviour of the system. o Meet performance criteria before product release. “Gathering information about system performance and providing it to the customer” Performance Testing
- 5. Does the application respond quickly enough for the intended users? Will the application handle the expected user load and beyond? Will the application handle the number of transactions required by the business? If it doesn’t perform, then could damage to your company: o Loss of revenue? o Loss of customers? o Loss of productivity? o Backlog of work? o Damage to your brand? Need for Automated Performance Testing
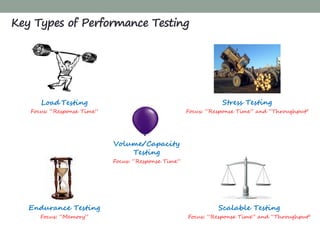
- 6. Load Testing Focus: “Response Time” Stress Testing Focus: “Response Time” and “Throughput" Endurance Testing Focus: “Memory” Volume/Capacity Testing Focus: “Response Time” Scalable Testing Focus: “Response Time” and “Throughput" Key Types of Performance Testing
- 7. Describe core Activities of Performance Testing: Core Activities of performance testing Analyze, Report & Retest Execute Tests Implement Test Design Configure Test Environment Plan and Design Tests Identify Performance Test Criteria Identify Test Environment Production Test Environment (Hardware, Software, Network, etc) Counter (Response Time, Throughput, Recourse Utilizations) Identify Scenarios, Define Test Data, Establish Metrics Test Environment, Tools, Resources Develop Test Scenarios Run and Monitor Test Consolidated and Share Test Results
- 8. Functionality Do business processes function properly after implementation? Stability Will 2,000 concurrent hits crash the server? Performance Is response time acceptable according to specifications? Functionality under load Do business processes function properly under heavy load? Functional Testing vs. Load Web Testing
- 9. Total user base: How many users will have access to this application? Concurrent User Load: What is the number of total users who will access the application together at any given point in time? Business Processes (Performance Scenarios) Service Level Agreement (Performance - Service Level Agreement) Performance Testing - Non Functional Testing Requirements
- 11. What'sInside Get Started What is LoadRunner? Why LoadRunner? LoadRunner Component How LoadRunner Works LoadRunner Architecture Load Runner: “The Big Picture” Types of Protocols Supported Installing LoadRunner LoadRunner Terminology
- 12. HP LoadRunner is an automated performance and test automation product from Hewlett-Packard for application load testing: examining system behaviour and performance, while generating actual load. HP acquired LoadRunner as part of its acquisition of Mercury Interactive in November 2006. It commands more than 70% Market Share in load testing tools. You can even use it as a “cloud “ based service. Main Competitors are OpenSTA, WebLoad , NeoLoad etc. What is LoadRunner?
- 13. Benefits of choosing LoadRunner o LR Credibility - Industry Standard (70 % Market Share) o Scalable (Add-ins) o Integration with QTP o Integration with QC o Record & Playback, Custom Code, Errors & Exceptions Why is LoadRunner?
- 15. How Load Runner Works
- 17. Tune System Based on Analysis Analyze System Under Load Phase 5 LoadRunner V U G E N LoadRunner C O N T R O L L E R & A N A L Y S I S Run Scenarios Phase 4 Create Scenarios Phase 3 Create Web Virtual Users Phase 2Phase 1 Plan Load Test Load Runner: “The Big Picture”
- 18. LoadRunner supports the most exhaustive types of protocols as compared to any other product in the market. Distributed Components: COM/DCOM, Corba-Java, and Rmi-Java protocols. E-business: FTP, LDAP, Palm, SOAP, Web (HTTP/HTML),Web/Winsocket Dual Protocol. Enterprise Java Beans: EJB Testing and Rmi-Java protocols. ERP: Baan, Oracle NCA, Peoplesoft-Tuxedo, SAP, Siebel-DB2 CLI, Siebel MSSQL, and Siebel Oracle protocols. Mailing Services: Internet Messaging (IMAP), MS Exchange (MAPI), POP3, and SMTP. Middleware: Jacada and the Tuxedo (6, 7) protocols. Streaming Data: Media Player (MMS) and Real protocols. Wireless: For i-Mode, VoiceXML, and WAP protocols. Legacy: Terminal Emulation (RTE). Types of Protocols Supported
- 19. Scenarios: Using Load Runner, you divide your application performance testing requirements into scenarios. A scenario defines the events that occur during each testing sessions. For example, a scenario defines and controls the number of users to emulate, the actions that they perform, and the machines on which they run their emulations. Vusers: In a scenario, Load Runner replaces human users with virtual users or Vusers. When you run a scenario, Vusers emulate the actions of human users submitting input to the server. A scenario can contain tens, hundreds, or even thousands of Vusers. LoadRunner Terminology
- 20. Vuser Scripts: The actions that a Vuser performs during the scenario are described in a Vuser script. When you run a scenario, each Vuser executes a Vuser script. Vuser scripts include functions that measure and record the performance of the server during the scenario. Transactions: To measure the performance of the server, you define transactions. Transactions measure the time that it takes for the server to respond to tasks submitted by Vusers. LoadRunner Terminology
- 21. Rendezvous Points: You insert rendezvous points into Vuser scripts to emulate heavy user load on the server. Rendezvous points instruct multiple Vusers to perform tasks at exactly the same time. For example, to emulate peak load on the bank server, you insert a rendezvous point to instruct 100 Vusers to simultaneously deposit cash into their accounts. Controller: You use the LoadRunner Controller to manage and maintain your scenarios. Using the Controller, you control all the Vusers in a scenario from a single workstation. Load Runner Terminology
- 22. Hosts: When you execute a scenario, the LoadRunner Controller distributes each Vuser in the scenario to a host. The host is the machine that executes the Vuser script, enabling the Vuser to emulate the actions of a human user. Performance Analysis: Vuser scripts include functions that measure and record system performance during load-testing sessions. During a scenario run, you can monitor the network and server resources. Following a scenario run, you can view performance analysis data in reports and graphs. Load Runner Terminology
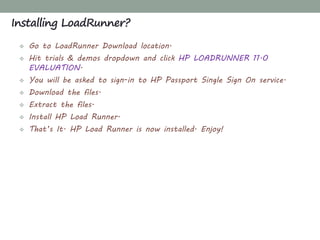
- 23. Go to LoadRunner Download location. Hit trials & demos dropdown and click HP LOADRUNNER 11.0 EVALUATION. You will be asked to sign-in to HP Passport Single Sign On service. Download the files. Extract the files. Install HP Load Runner. That’s It. HP Load Runner is now installed. Enjoy! Installing LoadRunner?
- 24. CHAPTER 3 VUGEN: CREATING SCRIPTS
- 25. What'sInside VuGen: Creating Scripts Introduction to VuGen Record Application with VuGen Enhancements Transaction Parameterization Content Checks Correlation Manual Correlation Automatic Correlation Configuring Run Time Settings
- 26. Virtual users or Vusers emulate the steps of real users. The steps that Vusers perform are recorded in a Vuser Script. VuGen is a protocol based testing tool. VuGen not only records Vuser scripts, but also runs them for debug. VuGen records sessions on Windows platforms only. However, a recorded Vuser script can run on both Windows and UNIX platform. Introduction to VuGen Protocol level Recording & Playback Captures: Communications Events Replays: Communications Events Event can be modify based on data: Data return from server Program logic within script User data provided in files AUT Client (User Actions)
- 27. Script Section Used when recording Is executed when vuser_init Login to a Server The Vuser is initialized (loaded) Actions Client activity The Vuser is in "Running" status vuser_end Logoff procedure The Vuser finishes or is stopped What VuGen can Do? Set up recording options Record the scripts Add Comments Insert Start and End Transactions Perform Correlation Add Checks Do Parameterization. Add Rendezvous Point Insert Load Runner Functions if required. Perform Run Time Settings Each Vuser script contains at least three sections: Introduction to VuGen
- 28. Recoding Mode Decide on recording mode. o For browser application, use HTML Mode. o For non-browser application, use URL Base. Record Application with VuGen HTML Mode URL Mode Intuitive & Easy Not as Intuitive to HTML Script Scalable More scalable & effect for creating a load test Recoding Options
- 29. Single Protocol Script Creates a single protocol Vuser script. This is the default option. Multiple Protocol Script Creates a multiple protocol Vuser script. VuGen displays all of the available protocols and allows you to specify which protocols record. Record Application with VuGen
- 30. For most Client / Server protocols, the following Screen opens. Recording Tool Bar (Floating Tool Bar). To complete recording, Click the stop recording button on the recording Tool Bar. It will capture a typical business process and saving the Vuser script. Record Application with VuGen
- 31. Add Transaction Used for measuring the response time of user steps. Can be done during recording else after recording. Syntax: lr_start_transaction("Transaction Name"); lr_end_transaction("Transaction Name", <status>); Inserting Comments To describe an activity or separate two sections. Can be added during recording or after recording. Inserting Rendezvous point Introduce concurrency. Syntax: lr_rendezvous("Logical Name"); Enhancements - Transaction
- 32. What is Parameter? “A parameter is a placeholder which re-place a recorded value in a Vuser script. At run time, a value from an external source is replaced with parameter against recorded value” Why to Parameter? If all user will use the same data, then response time will shorter respect to real system behavior. To over come this parameterize is done. Parameterization involves the following two tasks: Replacing the constant values in the Vuser script with parameters. Setting the properties and data source for the parameters. Enhancements - Parameterization
- 33. Types of Parameter Date/Time File Group Random Number Iteration Number Unique Number XML Vuser ID Load generator Name User defined function Enhancements - Parameterization Parameterization Process 1. Determine which fields to parameterize. 2. Replace recorded value with parameters. 3. Decide which parameter type to use. 4. Choose the data access method and the number of iterations. 5. Run the Vuser & analyze the results.
- 34. Creating Parameters Right click on the data to parameterize. In a script View: Select a string and select replace with parameter from the Right click menu. Type the Name of the parameter in the appropriate box or select from the list. Select parameter type from the parameter type list. The available types in the list are Date/Time, file, Group Name, Random number, Unique number, User defined function, or Vuser ID. Enhancements - Parameterization
- 35. LoadRunner checkpoints - validating response. Call this as text checkpoint or page validation or response verification, but these checkpoints you insert for every request helpful in identifying the failed transactions. Function to be used as text checkpoint - Web_reg_find("text=expected string on the page", LAST); This function has to be inserted above the http request that you want to validate. o Image Checkpoints: This checkpoint will verify the presence of an image on a page during run-time. o Text Checkpoint: This checkpoint will verify the presence of a text-string on a page during run-time. Enhancements - Content Checks
- 36. Correlation is the way handling dynamic values in client server communication. The values captured will be send back to server in later steps in the script. Correlation is typically used for handling session id's. Correlation Works Capture output values from one preceding step. User captured value as input to processing step. Correlation Types Correlation Automatic Correlation LR detect & helps to solve them. Manually Correlation LR detect but doesn't provide direct interface to correlate.
- 37. 1. Create two scripts of same scenario. 2. Find a dynamic value to capture. 3. Find server's response, containing the dynamic value. 4. Capture the dynamic value in a parameter. 5. Special parameter will be used instead of dynamic value. 6. Replace every occurrence of dynamic value in script with the parameter. 7. Relay & Verify Changes. Manual Correlation
- 38. In load runner there are three ways of doing Automatic correlation. Those techniques correlation during recording and correlation after record and replay. Automatic Correlation Types Auto -Detect Correlation Detect & correlate dynamic data for supported application Rule-Based Correlation When working with non supported application Correlating All Blindly correlated all dynamic data Automatic Correlation
- 39. Run Logic Instruct a Vuser to repeat the run section when you run the script. Each repetition is known as iteration. Number of Iterations Load Runner repeats all of the actions, the specified number of times. Pacing The pace tells the Vuser how long to wait between iterations of Vuser. Configuring Run Time Settings
- 40. Log Vusers log information about themselves and their communication between server. Two types of Logs Standard Extended Think Time VuGen allows you to use the recorded think time, ignore it, or use a value related to the recorded time. Miscellaneous Error Handling Multithreading Automatic Transactions Configuring Run Time Settings
- 41. CHAPTER 4 CONTROLLER: CREATING SCENARIOS
- 42. What'sInside Controller: Creating Scenarios Introducing to Controller Creating Scenarios Manual Scenario Goal-Oriented Scenario Manual Scenario v/s Goal-Oriented Scenario Load Generator Running and Monitoring Scenario Service Level Agreement - SLA
- 43. What is Scenario? A scenario defines the events that occur during each testing session. Thus, for example, a scenario defines and controls the number of users to emulate, the actions that they perform, and the machines on which they run their emulations. Scenarios Includes: Generate scenarios & run scenarios. Create Vusers Add Load generators Schedule our tests “LoadRunner Controller is used for creating Scenarios” Introducing the Controller
- 44. Manual Scenario Manage your Load Test by specifying the number of Virtual users to run. o Manage load test by specifying the number of virtual users to run. o Percentage mode to distribute the total number of Vuser among scripts based on a percentage specified. Goal-Oriented Scenario Allow Load Runner Controller to create a Scenario based on the goals you specify. o The number of concurrent Vusers o The number of hits per second o The number of transactions per second o The number of pages per minute o The transaction response time that you want your scenario Creating Scenarios
- 45. Step 1: Launching LoadRunner & it’s Controller Module. a) Start” > “Programs” > “LoadRunner” > “LoadRunner”. b) Open the LoadRunner Controller by clicking “Run Load Tests” In the “Load Testing tab”. Manual Scenario
- 46. Step 2: Making a selection of method of creation of scenario. a) Manual Scenario (Select) b) Goal-Oriented Scenario Step 3: Adding a script to the load test: Select a script out of the list of Scripts already available. Step 4: Defining the group attributes for the script. a) Locate the desired script. b) Change Scenario group name. c) Provide Vusers quantity for the group. Manual Scenario
- 47. Step 5: Adding a load generator for running the Vusers. a) Use already available Load Generator. b) Creating & using a new Load Generator. Manual Scenario
- 48. Step 6: Testing the Load Generator Connection. a) Select “localhost” and click “Connect”. b) Check connection with status changes from “Down” to “Ready”. Step 7: Scheduling of scenario in schedule pane of the Controller window. Manual Scenario
- 49. Step 8: Setting the schedule actions definitions in Actions Grid. a) Initialize b) Start Vusers c) Duration d) End Vusers Step 9: Initializing of Vusers. a) Initialize all Vusers simultaneously b) Initialize each Vuser at specified interval c) Initialize each Vuser just before it runs Manual Scenario
- 50. Step 10: Starting of Vusers at specified Intervals. Step 11: Specifying a duration through. “Interactive Schedule Graph” a duration is defined so that the Vusers keep on doing the scheduled action for a specific period. Manual Scenario
- 51. Step 12: Stopping of Vusers. Step 13: Configuring the Run-time settings. a) Run Logic to define the number of times a user repeats a group of actions. b) Pacing to define the time to wait before repeating an action. c) Log to define the type of information needed to be captured during the test. d) Think Time to define the time a user stops to think between steps. e) Speed Simulation to define network connections like modem, DSL or cable. f) Browser Emulation to define different browsers. g) Content Check for automatically detecting user-defined errors. Manual Scenario
- 52. Step 14: Enabling think time. Step 15: Enabling the logging option. Manual Scenario
- 53. Step 16: Configuring the Windows Resources monitor. a) Opening of the Run view b) Selection of monitored server Manual Scenario
- 54. Goal-Oriented Scenario Creating Scenario Defining Scenario Goals Assigning Properties to Scripts Run Scripts
- 55. Manual Scenario v/s Goal-Oriented Scenario Manual Scenarios Goal-Oriented Scenario Used to simulate the real time loads based on the fixed time and fixed number of virtual users. Used for simulating the load, based on the objectives defined by the customer expected goals. The duration is fixed. Since the time clearly defined in real world schedules. The duration is always much more than the duration mentioned in goal oriented scenarios. Acceleration and deceleration of the users will happen based on the schedule design. Acceleration and deceleration of the users will happen automatically, based on the goal defined.
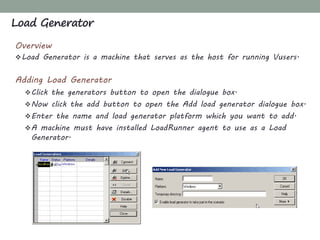
- 56. Overview Load Generator is a machine that serves as the host for running Vusers. Adding Load Generator Click the generators button to open the dialogue box. Now click the add button to open the Add load generator dialogue box. Enter the name and load generator platform which you want to add. A machine must have installed LoadRunner agent to use as a Load Generator. Load Generator
- 57. Running and Monitoring Scenario Running a Scenario The following procedure outlines how to run a scenario: Open an existing scenario or create a new one. Configure and schedule the scenario. Set the results directory. Run and monitor the scenario.
- 58. Running and Monitoring Scenario Monitoring a Scenario LoadRunner provides the following online monitors: o Run-Time o Transaction o Web Resource o System Resource o Network Delay o Firewall o Web Server Resource o Web Application Server Resource o Database Server Resource o Streaming Media o ERP Server Resource o Java Performance
- 59. Overview Service level agreements (SLAs) enable you to define goals for your load test scenario. During a scenario run, the Controller measures the performance and collects data. Analysis compares this data against thresholds defined in the SLAs. Service Level Agreement - SLA
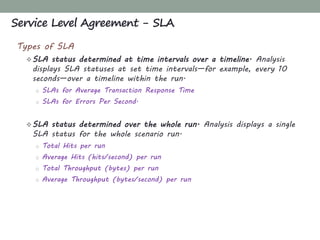
- 60. Types of SLA SLA status determined at time intervals over a timeline. Analysis displays SLA statuses at set time intervals—for example, every 10 seconds—over a timeline within the run. o SLAs for Average Transaction Response Time o SLAs for Errors Per Second. SLA status determined over the whole run. Analysis displays a single SLA status for the whole scenario run. o Total Hits per run o Average Hits (hits/second) per run o Total Throughput (bytes) per run o Average Throughput (bytes/second) per run Service Level Agreement - SLA
- 61. CHAPTER 5 ANALYSIS: ANALYZING RESULTS
- 62. What'sInside Analysis: Analyzing Results Introduction to Analysis Analyzer Window at a Glance Available Graphs Graph Configuration Interpreting Graphs and Identifying Bottlenecks
- 63. Analysis provides graphs and reports to help you analyze the performance of your system. The aim of the analysis session is to find the failures in your system's performance and then pinpoint the source of these failures. Were the test expectations met? What was the transaction response time on the user’s end under load? Did the SLA meet or deviate from its goals? What was the average transaction response time of the transactions? What parts of the system could have contributed to the decline in performance? What was the response time of the network and servers? Can you find a possible cause by correlating the transaction times and backend monitor matrix? Overview Analysis
- 64. Analyzer Window at a Glance
- 65. Session Explorer pane: In the upper left pane, Analysis shows the reports and graphs that are open for viewing. From here you can display new reports or graphs that do not appear when Analysis opens, or delete ones that you no longer want to view. Properties window pane: In the lower left pane, the Properties window displays the details of the graph or report you selected in the Session Explorer. Fields that appear in black are editable. Graph Viewing Area: In the upper right pane, Analysis displays the graphs. By default, the Summary Report is displayed in this area when you open a session. Graph Legend: In the lower right pane, you can view data from the selected graph. Analyzer Window at a Glance
- 66. User-Defined Data Point Graphs : Provide information about the custom data points that were gathered by the online monitor. System Resource Graphs : Provide statistics relating to the system resources that were monitored during the scenario using the online monitor. Network Monitor Graphs : Provide information about the network delays. Firewall Server Monitor Graphs : Provide information about firewall server resource usage. Web Server Resource Graphs : Provide information about the resource usage for the Apache, iPlanet/Netscape, iPlanet(SNMP), and MS IIS Web servers. Available Graphs
- 67. Available Graphs Transactions: o Average Transaction Response Time o Transactions per Second o TPS (Transactions Per Second) o Total Transactions per Second o Transaction Summary o Transaction Performance Summary o Transaction Response Time Under Load Web Resources: o Hits per Second o Hits Summary o Throughput o Throughput Summary o HTTP Responses per Second o Connections o Connections per Second o SSLs Per Second Vusers: o Running Vusers System Resources: o UNIX CPU Util o UNIX Avg Load o UNIX Paging rate Web Server Resources: o Apache CPU Usage o Apache Hits/sec o Apache Kbytes Sent/sec Web Page Breakdown o Web Page Breakdown o Page Component Breakdown o Download Component Size (KB)
- 68. User-Defined Data Point Graphs : Provide information about the custom data points that were gathered by the online monitor. System Resource Graphs : Provide statistics relating to the system resources that were monitored during the scenario using the online monitor. Network Monitor Graphs : Provide information about the network delays. Firewall Server Monitor Graphs : Provide information about firewall server resource usage. Web Server Resource Graphs : Provide information about the resource usage for the Apache, iPlanet/Netscape, iPlanet(SNMP), and MS IIS Web servers. Graph Configuration
- 69. Set Global Filter Set Filter By - Filter Condition, Group by Merge Graphs Auto-Correlate Graphs Cross Results Report generation Using Templates HTML Report Customizing Templates Graph Configuration
- 70. Graph analysis Introduction to Bottlenecks Types of bottlenecks Memory Bottlenecks CPU Bottlenecks Brief on Disk and Network Bottleneck Database Bottlenecks Interpreting Graphs and Identifying Bottlenecks
- 71. BEST PRACTICE
- 72. What'sInside Best Practices Best Practices for Performance Testing - Do Best Practices for Performance Testing - Don’t
- 73. Clear the application and database logs after each performance test. Excessively large log files may artificially skew the performance results. Identify the correct server software and hardware to mirror your production environment. Use a single graphical user interface (GUI) client to capture end-user response time while a load is generated on the system. Include a buffer time between the incremental increases of users during a load test. Use different data parameters for each simulated user to create a more realistic load simulation. Monitor all computers involved in the test, including the client that generates the load. This is important because you should not overly stress the client. Prioritize your scenarios according to critical functionality and high- volume transactions. Use a zero think time if you need to fire concurrent requests,. This can help you identify bottleneck issues. Stress test critical components of the system to assess their independent thresholds. Best Practices for Performance Testing - Do
- 74. Do not allow the test system resources to cross resource threshold limits by a significant margin during load testing, because this distorts the data in your results. Do not run tests in live production environments that have other network traffic. Use an isolated test environment that is representative of the actual production environment. Do not try to break the system during a load test. The intent of the load test is not to break the system. The intent is to observe performance under expected usage conditions. You can stress test to determine the most likely modes of failure so they can be addressed or mitigated. Do not place too much stress on the client test computers. Best Practices for Performance Testing - Don’t
- 75. THANK YOU