SlideShare a Scribd company logo
MARCH
2014
MACROECONOMIC
DEVELOPMENTS
REPORT
MACROECONOMIC DEVELOPMENTS REPORT
March 2013
MACROECONOMIC DEVELOPMENTS REPORT
March 2014, No 18
© Latvijas Banka, 2014
The source is to be indicated when reproduced.
Latvijas Banka
K. Valdemāra iela 2A, Riga, LV-1050, Latvia
Tel.: +371 67022300 Fax: +371 67022420
http://www.bank.lv
info@bank.lv
2
MACROECONOMIC DEVELOPMENTS REPORT
March 2014
CONTENTS
Contents
Abbreviations	3
Executive Summary 	 4
1. External sector and exports	6
1.1 External economic environment	 6
1.2 Latvia's competitiveness and dynamics of goods exports	 7
2. Monetary Policy and Financial Markets	 10
2.1 Global financial markets	 10
2.2 Securities market	 12
2.3 The ECB monetary policy decisions, Eurosystem operations, liquidity and 	
money market developments	 14
2.4 Lending and deposit rates	 15
2.5 Dynamics of domestic loans and deposits	 17
3. Domestic Demand	 21
3.1 Private consumption and investment	 21
3.2 Government expenditure and budget	 24
4. Aggregate Supply	 25
4.1 Industry and construction	 25
4.2 Services	 28
4.3 Labour market 	 30
5. Costs and Prices	 33
6. Balance of Payments	 36
7. Conclusions and Forecasts	 38
7.1 Economic developments 	 38
7.2 Inflation	 39
Statistics	41
Additional Information	 93
3
MACROECONOMIC DEVELOPMENTS REPORT
March 2014
Abbreviations
CIF – cost, insurance and freight at the importer's border
CIS – Commonwealth of Independent States
CPI – Consumer Price Index
CSB – Central Statistical Bureau of Latvia
EC – European Commission
ECB – European Central Bank
EMU – Economic and Monetary Union
ESA 95 – European System of Accounts 1995
EU – European Union
EU15 – EU countries before 1 May 2004
EU27 – EU countries from 1 January 2007 to 30 June 2013
EU28 – EU countries from 1 July 2013
EURIBOR – Euro Interbank Offered Rate
Eurostat – Statistical Office of the European Union
FCMC – Financial and Capital Market Commission
FOB – free on board at the exporter's border
FRS – Federal Reserve System
GDP – gross domestic product
HICP – Harmonised Index of Consumer Prices
IMF – International Monetary Fund
JSC – joint stock company
MFI – monetary financial institution
NA – no answer
n.i. – no information
OFI – other financial intermediary (other than an insurance corporation or a pension fund)
OMXR – NASDAQ OMX Riga index
PMI – Purchasing Managers Index
RIGIBOR – Riga Interbank Offered Rate
SEA – State Employment Agency
SJSC – state joint stock company
ULC – unit labour costs
UK – United Kingdom
UN – United Nations
US – United States of America
VAT – value added tax
WTO – World Trade Organisation
ABBREVIATIONS
4
MACROECONOMIC DEVELOPMENTS REPORT
March 2014
EXECUTIVE SUMMARY
Executive Summary
In January 2014, the IMF revised upward the global GDP growth perspective for 2014 in
comparison with October 2013 and downgraded the respective forecast for 2015. Of Latvia's
major trade partners, the growth forecast was lowered significantly for Russia, since, with
the depreciation of the Russian ruble persisting, the slowdown of the economic growth
continued at the end of 2013. As a result of the political crisis in Ukraine, the negative
trends in its economy grew more pronounced. Unfavourable dynamics was also observed in
Estonia, with its GDP moving down by 0.1% in the fourth quarter. As to the euro area, the
seasonally and working-day adjusted GDP picked up stronger-than-expected in the fourth
quarter.
At the end of 2013, Latvia's foreign trade activity weakened due to the high base and
seasonal factors; however, high competitiveness of the Latvian economy persisted. The
current account deficit of Latvia's balance of payments decreased to 0.8% of GDP in 2013.
In the fourth quarter, the market shares of Latvian exports in global imports continued to
expand. With the economy of EU countries strengthening gradually, Latvian exports to
EU countries resumed their growth. In 2014, higher external demand in EU countries, the
sustainable capability of Latvian manufacturers to compete in markets with weak demand,
and the anticipated pick-up in investment activity are expected to ensure an increase in the
growth of exports of goods. Still the external environment in general, inter alia investment
activity, is likely to be affected by uncertainty and the negative sentiment effects related to
the developments in Russia and Ukraine.
As of 1 January 2014, Latvijas Banka became a full-fledged member of the Eurosystem,
implementing the single monetary policy of the Economic and Monetary Union together
with other national central banks of the euro area and the ECB. In January–March, the
ECB did not change the interest rate on the main refinancing operations and the interest
rates on the marginal lending facility and the deposit facility also remained unchanged at
0.25%, 0.75% and 0.00% respectively. Despite the low level of interest rates, Latvian credit
institutions have been active participants in fixed-term deposit tenders with a maturity of
1 week since the beginning of 2014.
December was the last month when the lats was the sole legal tender in Latvia. In line with
expectations, with the euro changeover approaching, the amount of cash in lats in circulation
shrank sharply as savings were deposited with credit institutions and the volume of non-cash
transactions increased. And January 2014 – the first month since the introduction of the euro
– saw the anticipated trend that the changeover to the euro was also a changeover to a more
active employment of non-cash settlements. Most of the funds households and enterprises
deposited with credit institutions in December were also kept there in January.
Loans granted to resident households, financial institutions and non-financial corporations
continued on a downward trend in December and January. Households are expected to
refrain from taking new loans also in the future, and their debt level will gradually fall, while
lending to selected businesses, e.g. exporting companies, traders and service providers is
likely to increase. Overall, however, sustainable loan portfolio growth could rebound only
over the next couple of years.
Latvia's GDP growth remained among the strongest in the EU in the fourth quarter. Private
consumption was the main growth engine throughout the year. On the supply side, the
services sector was the major contributor to the annual GDP growth. Latvijas Banka's
GDP growth forecast for 2014 remained unchanged at 4.0%. Risks related to the external
environment are on the downside, and they have increased significantly; consequently, risks
to the forecast are generally considered to be on the downside.
5
MACROECONOMIC DEVELOPMENTS REPORT
March 2014
EXECUTIVE SUMMARY
The rate of real unemployment continued to moderate in the fourth quarter. The decline in
unemployment in Latvia, having been quite notable in the previous three years, is expected
to decelerate in 2014. In the future, sustainable decrease in unemployment will take place
mostly on account of a fall in structural unemployment, and it cannot happen quickly.
A moderate increase in the average monthly gross nominal wage in the fourth quarter
suggests there is no reason for concern over deterioration of competitiveness and pressure
on inflation at this stage. Both the nominal and the real unit labour cost levels still remain
considerably lower than in 2008.
Although annual core inflation posted a rise in January and February, neither the monthly nor
the annual price rises exceeded the averages observed in the respective months over the last
ten years. We will be able to draw conclusions regarding the impact of the euro changeover
on prices only at the end of the year; nevertheless, the data available to date suggest that the
effect of the euro changeover on the average consumer prices could be at the level estimated
in 2013 (approximately 0.2 percentage point).
In January and February 2014, annual inflation still remained low (0.4% and 0.5%
respectively), while approaching inflation rates associated with economic growth. Inflation
continued to be low due to supply-side factors – the annual rate of increase in prices of
fuel and heating energy still remained negative. Currently Latvijas Banka's forecast of the
average annual inflation for 2014 remains unchanged at 1.7%; however, risks to the above
forecast are considered to be on the downside, mostly on account of the postponement of
electricity market liberalisation for households.
6
MACROECONOMIC DEVELOPMENTS REPORT
March 2014
Table 1
GDP GROWTH FORECASTS FOR LATVIA'S MAJOR
TRADE PARTNERS IN 2013 AND 2014
(%)
20141
20142
20143
20151
20152
20153
Total global
economy 4.0 3.6 3.7 4.4 4.0 3.9
US 3.0 2.6 2.8 3.6 3.4 3.0
Euro area 1.1 1.0 1.0 1.4 1.4 1.4
Germany 1.5 1.4 1.6 1.3 1.4 1.4
UK 1.5 1.9 2.4 1.8 2.0 2.2
Russia 3.8 3.0 2.0 3.7 3.5 2.5
Denmark 1.3 1.2 n.i. 1.5 1.5 n.i.
Sweden 2.2 2.3 n.i. 2.3 2.3 n.i.
Finland 1.2 1.1 n.i. 1.5 1.4 n.i.
Estonia 3.2 2.5 n.i. 3.4 3.5 n.i.
Lithuania 3.3 3.4 n.i. 3.5 3.5 n.i.
Poland 2.2 2.4 n.i. 2.7 2.7 n.i.
Sources: April 2013 (1), October 2013 (2) and January 2014 (3) World
Economic Outlook (IMF).
1. EXTERNAL SECTOR AND EXPORTS
1. External Sector and
Exports
1.1 External economic environment
In January 2014, the IMF revised upward the global
GDP growth perspective for 2014 in comparison to
October 2013 and downgraded the respective forecast
for 2015. The 2014 downward revisions particularly
affected Russia, while those for 2015 concerned
Russia and the US. At the same time, projections were
upgraded for the UK and, for 2014, also for Germany
(see Table 1).
In the fourth quarter of 2013, the euro area seasonally
and working-day adjusted GDP picked up stronger-
than-expected 0.3% quarter-on-quarter (see Chart 1.1).
The contribution to the GDP growth from private
consumption (0.1 percentage point), investment
(0.2 percentage point) and net exports (0.4 percentage
point) was positive, while that from inventories was
negative (03.percentage point). The growth in the
euro area was enhanced by the advancing French
and German economies. In addition, the euro area
unemployment declined somewhat.
The euro area peripheral countries sent likewise
positive signals. The rating agency Moody's revised
Spain's credit rating upward in February, the fourth
quarter GDP in Italy picked up for the first time since
the second quarter of 2011, and Portugal bought
back 1.3 billion euro in bonds, due to be redeemed
in 2014 and 2015, to ease the debt repayment time
frame. In Greece, in turn, the 2013 current account of
the payment balance recorded a surplus for the first
time over almost 70 years.
Germany's GDP posted a 0.4% quarter-on-quarter
increase in the fourth quarter. Even though the
domestic demand was falling in the fourth quarter, the
GDP growth was on account of exports, which were
expanding, albeit were also subdued by weak growth
in Germany's trade partner countries. Export growth
might weaken in 2014, while the domestic demand is
likely to strengthen due to anticipated income rise.
In Estonia, the fourth quarter GDP dropped 0.1%
quarter-on-quarter in 2013. In the face of a sluggish
external demand, Estonia's exports contracted
towards the end of the year. Despite a year-on-year
lower overall unemployment level, the decline in
unemployment slowed down quarter-on-quarter, with
even a slight rise recorded in the fourth quarter.
Chart 1.1
annual and QUARTERLY GDP GROWTH RATE
IN Q4 2013 in latvia's MAJOR trade partner
countries
(%)
7
MACROECONOMIC DEVELOPMENTS REPORT
March 2014
In the fourth quarter, Lithuania's GDP accelerated by
1.2% quarter-on-quarter. The rise in GDP was driven
by private consumption augmented by rising wages. In
the meantime, the role of exports in economic growth
diminished due to external demand losing momentum.
In the fourth quarter of 2013, Poland recorded a 0.6%
quarter-on-quarter GDP pickup. At the close of the
year, the labour market situation eased somewhat, yet
the unemployment rate still lingered at a relatively
high level (10.1% in December).
The quarter-on-quarter rise in UK's GDP was 0.7% in
the fourth quarter of 2013, with the sustainability of
economic activity being spurred by more favourable
lending standards and improved confidence.
Unemployment rate decelerated at the end of the year
almost reaching the Bank of England's target of 7%.
In Sweden in the fourth quarter of 2013, GDP gained
1.7% quarter-on-quarter. The economic development
was strengthened by the expansion in industrial
production, and consumption, both private and
government, grew.
With private consumption and investment shrinking
in Denmark, its GDP contracted by 0.5% quarter-on-
quarter in the fourth quarter of 2013.
Despite an overall GDP growth over the year in Russia,
its pace lagged notably behind that of the previous
year. Towards the end of the year, depreciation of the
Russian ruble continued. Export growth was curbed
by the relatively weak external demand and somewhat
low oil and gas prices, while, with unemployment
soaring, the demand weakened also domestically.
Russia's involvement in the events in Ukraine resulted
in a further depreciation of the Russian ruble and also
stock market price falls. In an attempt to mitigate the
risks related to financial stability and inflation, the
Central Bank of the Russian Federation raised its main
refinancing rate. Taking into account the previous
downgrading of Russia's economic forecast for 2014
and 2015 (more impressive than for other countries),
a further escalation of the situation in Ukraine and the
uncertainty about the future direction of developments
herein may figure as an extra obstruction to Russia's
economic growth.
1.2 Latvia's competitiveness and dynamics
of goods exports
Towards the close of 2013, Latvia's foreign trade
activity moderated due to the high basis and effects of
1. External Sector and Exports
8
MACROECONOMIC DEVELOPMENTS REPORT
March 2014
seasonal factors. In the fourth quarter, Latvia's exports
and imports of goods posted year-on-year declines in
both nominal (2.9% and 6.2% respectively) and real
(2.0% and 5.4%) terms (see Charts 1.2 and 1.3).
Although the value of goods exports in the fourth
quarter was by 6.6% higher quarter-on-quarter, it had
contracted by 2.9% against the fourth quarter of 2012.
In general, seasonal export contractions are typical for
the end of the year, as traditionally exports expand in
the third quarter, owing to rising exports of vegetable
product after the harvesting season. Determined by the
record-high grain harvest in 2012 and the rising global
prices, the reference point for vegetable product
exports was high; hence, most of the export shrinkage
at the end of 2013 resulted from by far smaller grain
exports year-on-year. The contribution from exports
of base metals and articles of base metals as well
as transport vehicles continued to affect the overall
annual export growth adversely. Meanwhile, the
negative impact on overall exports, exerted by the
falling transport vehicle re-exporting, continued to
diminish; similar negative effects on overall exports
coming from the wind-up of the JSC Liepājas
Metalurgs were partly easing due to successful
operation of the producers of base metals and articles
of base metals. The growth in exports of wood and
articles of wood remained positive at the close of 2013
(annual growth of 15.8% in the fourth quarter). In the
meantime, the data on wood industry's performance
testify that its volume expansion in 2013 proceeded
at a slower pace than did the growth in turnover and
export value therein, most likely on account of both
wood price rises in the global market and higher value
added within the industry itself. Exports of food,
with a 13.2% increase, and animal products, with a
7.7% rise, continued to demonstrate a stable annual
growth in the fourth quarter, whereas the export value
of meat, dairy and fish products as well as of other
export goods was going up. Export performance of
other smaller industries, e.g. manufacture of paper
and products of the printing industry (16.4%), textile
articles (6.7%), articles of stone, plaster, cement,
glassware and ceramic products (6.3%), optical
instruments, photo and filming apparatus, medical,
measuring equipment and similar instruments (62.3%)
testifies to the growth being stable as well and in part
offsetting a decline in exports of base metals and
transport vehicles and enhancing a diversified export
portfolio.
According to the data of the WTO, Latvia's export
market shares in global imports continued to expand
1. External Sector and Exports
Chart 1.2
EXPORTS OF GOODS
(year-on-year; %)
Chart 1.3
IMPORTS OF GOODS
(year-on-year; %)
9
MACROECONOMIC DEVELOPMENTS REPORT
March 2014
1. External Sector and Exports
in the fourth quarter. As the EU economy gradually
strengthened, Latvia's exports to the EU countries
recommenced expanding (see Chart 1.4).
In the fourth quarter, imports of goods contracted
more than did the respective exports. Regarding
imports, shrinkages were reported by almost all
commodity groups, except wood. Imports of the
latter continued on an upward trend, thus testifying to
limited accessibility to raw materials and offsetting
their shortages by imported resources on an ever
larger scale. At the end of the year, imports of goods
contracted primarily on account of the completion
of major investment projects as well as a weak
new investment activity, underpinned by external
uncertainties. The dampening effect on imports of
intermediate goods of the wind-up of the JSC Liepājas
Metalurgs continued, whereas the contractions in
imports of mineral products resulted from dropping
oil prices. It is true however, that these contractions
in goods imports may also evidence that Latvia's
dependence on imports has diminished, for imported
goods can be well replaced by the local output on an
ever growing scale. The declining imports of goods
also signal a narrowing of the re-exporting activities,
for instance, in the car market.
In the fourth quarter, export and import prices
decreased somewhat year-on-year (by 0.9%). The
respective prices for vegetable products fell most.
Overall terms of trade posted a slight quarter-on-
quarter improvement in the fourth quarter (0.1%).
The terms of trade in transport vehicles improved
notably, whereas those for machinery and mechanical
appliances, electrical equipment deteriorated most.
Confidence indicators published by the EC show
that Latvia's economic sentiment, including also so
far volatile business sentiment, has improved. The
domestic demand has served as a primary driver, as
the export order volume assessment deteriorated in
January. In the first quarter of 2014, the assessment
of both export order volumes and competitiveness
worsened, businesses' future perception of
competitiveness within and outside the EU including.
All above said notwithstanding, it can be expected
that the rising external demand in several Latvia's
export market countries, sustained competitiveness
of Latvia's producers in markets where the demand
is weak, and anticipated buoyancy of investment
activity all will contribute to a more resilient growth
in exports of goods in 2014.
Chart 1.4
LATVIA'S EXPORTS AGAINST MAJOR TRADE PARTNER
countries' IMPORTS
(moving average; Q1 2010–Q3 2013; %)
* Estonia and Lithuania – right-hand scale.
10
MACROECONOMIC DEVELOPMENTS REPORT
March 2014
2. Monetary Policy and
Financial Markets
2.1 Global financial markets
In the first two months of 2014, a number of central
banks continued to pursue accommodative monetary
policy. This move was determined by low inflation
and inflation expectations as well as gradually
recovering economic activity. The FRS was an
exception, for it proceeded with the wind-down of the
asset purchase programme.
Similar to the ECB, other central banks kept their
refinancing rates close to zero as well (see Chart 2.1).
Following a decision passed in December 2013, the
FRS tapered its government bond-buying programme
from 85 billion US dollars to 75 billion US dollars
in January 2014, and to 65 billion US dollars from
February. Hence, beginning in February, the volume
of the US government bond-buying programme
is 35 billion US dollars per month in longer-term
Treasury securities and 30 billion US dollars per
month in agency mortgage-backed securities.
The FRS based this decision on the US economy
continuing to show progress. Analysts' forecasts
suggest that market participants expect the FRS to
keep up such monthly pace of asset-buying tapering.
The global financial market experienced high
volatility and a change in investors' risk perceptions
in January when China, a significant driver of global
economy, reported falling production activity. Along
with other factors, like moderating growth rate in the
emerging markets and further tapering of stimulus
measures in the US, the weakening of China's
manufacturing sector at the beginning of the year
gave rise to investors' worries about the prospects of
economic recovery in all emerging market countries
and spurred up the outflow of investment from the
latter countries. Investors returned to investing
in safer-deemed government bonds of developed
countries, which caused a sizable price drop in
stock markets where investing was considered
more risky, while the government bond prices of
developed countries soared. With the outflow of
capital from emerging market economies, the demand
for currencies of these countries weakened, thus
making them depreciate against the currencies of
developed countries. Against the euro, the Turkish
lira depreciated by 2.9%, whereas the Ukrainian
hryvnia, affected by the political crisis, lost 17% of its
2. Monetary Policy and Financial Markets
Chart 2.1
EuRO money market interest rates
(%)
11
MACROECONOMIC DEVELOPMENTS REPORT
March 2014
value in the reference period. Similarly, the Russian
ruble depreciated sharply against the currencies
of developed countries. It was driven by several
factors, among them weak performance data of
Russia's economy, dropping commodity prices, and
the national central bank's transition from managed
floating exchange rate regime to floating exchange
rate regime, hence increasing the market's role in
exchange rate determination. In the period between
1 January and 25 February, the exchange rate of
the Russian ruble against the euro fell by 8.0%.
The value continued to decrease, with investors
responding to Russia's intervention in Crimea, the
latter causing international community to condemn
it and give warnings of eventual sanctions against
Russia. The value of the Russian ruble was adversely
affected by the growing concerns about Ukrainian
solvency, considering substantial linkages of the
Russian economy with the crisis-hit country. Sensing
devaluation danger, investors and the Russian people
hurried to dispose of the Russian ruble, thus making
its value slip to a record-low level (50.64 rubles per 1
euro). Under the impact of financial market turmoil,
the Central Bank of the Russian Federation raised
the main refinancing rate from 5.5% to 7%. From the
beginning of 2014 to 4 March overall, the Russian
ruble depreciated against the euro by 11.0%.
In contrast to significant exchange rate fluctuations in
emerging market economies, the developed countries
saw marginal exchange rate fluctuations. In the
reporting period, the US dollar fluctuated against the
euro within the margin of 1.35 US dollars per euro to
1.38 US dollars per euro. The euro preserved stability
also against the Swiss franc and the British pound
sterling (see Chart 2.2).
As in the reporting period overall the investors opted
for investing in safer-deemed securities, the yields
on the government bonds of developed countries
tended to go down along with the increasing demand.
The yield on the US government 2-year bonds
dropped from 0.38% to 0.32%, whereas that on the
10-year bonds decreased from 3.0% to 2.7% in the
reporting period. Meanwhile, the yield on the German
government short-term bonds from 0.21% declined to
0.13%, whereas that on the respective long-term bonds
contracted from 1.93% to 1.62% (see Chart 2.3).
2. Monetary Policy and Financial Markets
Chart 2.2
euro Exchange rate against US dollar, Swiss
franc and UK pound sterling
(index: 1 January 2014 = 100)
Chart 2.3
10-YEAR GERMAN AND US GOVERNMENT BOND
YIELDS
(%)
12
MACROECONOMIC DEVELOPMENTS REPORT
March 2014
2. Monetary Policy and Financial Markets
2.2 Securities market
The primary tenders of the Latvian government
securities were not organised in January, but in
December 2013 the primary tenders of 6-month and
12-month Treasury bills were held, while in February
2014 – the primary tenders of 12-month Treasury
bills and 5-year bonds (see Chart 2.4). The total
amount supplied amounted to 66.3 million equivalent
in euro, the demand reached 218.6 million euro, and
the entire amount supplied was sold. The average
yield on 6-month Treasury bills remained unchanged
(0.23%) in comparison with the previous tenders. It
decreased by 2 basis points for 12-month Treasury
bills (to 0.37%), but for 5-month bonds – by 17 basis
points (to 1.79%). At the end of February, the overall
issuance in net terms in circulation was 972.4 million
euro (by 2.4% more than at the end of November).
In January, Latvia issued 7-year eurobonds in the
external market. The demand was 4.5 billion euro
but the issued amount – 1 billion euro. The average
bond selling rate applied was 2.815% (the mid-swap
rate plus 120 basis points) and the coupon rate –
2.625%. The bonds were bought by approximately
300 investors; majority of them were from Europe
and the rest – from the US. This rate was lower than
that for the EC loan maturing at the end of March
(3.125%). The Treasury data suggest that at the end
of January the balance of the Treasury accounts with
credit institutions, including Latvijas Banka, was 2.3
billion euro.
The bid yield on Latvian government euro-
denominated bonds maturing in 2018 decreased
from 1.71% at the end of November to 1.43% on
28 February (see Chart 2.5); the spread between the
above and the German government bonds of the
respective maturity narrowed from 118 basis points to
98 basis points. The bid yield on Latvian government
bonds denominated in US dollars and maturing in
2021 declined from 4.04% to 3.65%, and the spread
between the above and that of the US government
bonds of the same maturity shrank from 177 basis
points to 141 basis points.
Comparing yields on 10-year government bonds in
EU countries in the national currency, in December
and January the EU countries can be divided into two
groups. In the first group of countries this yield on
10-year bonds edged up (the strongest growth was in
December, however, in January it also remained below
2.5%). Bond yields rose as a result of the FRS decision
Chart 2.4
AUCTIONS OF GOVERNMENT DEBT SECURITIES
(millions of euro)
Chart 2.5
Latvian GOVERNMENT BOND bid YIELDS
(%)
13
MACROECONOMIC DEVELOPMENTS REPORT
March 2014
to reduce the amount of the securities purchased,
better sentiment indicators and economic growth
forecasts in Europe in 2014. In the second group of
countries the yields on 10-year government bonds
(with a few exceptions) decreased, standing within the
range of 2.5%–8.7% in December and January.
Latvia ranked 16th among the 27 EU countries
(Estonia does not have government long-term
securities). In November, the weighted average yield
on Latvian government 10-year bonds was 3.71%,
it stood at 3.62% in December and in January it was
down to 3.48%. In January, compared to November,
the spreads between Latvian government bonds
vis-à-vis German, Swedish and French government
bonds shrank by 31 basis points, 30 basis points
and 34 basis points respectively. When comparing
Latvia with the countries where the yield level
of government 10-year bonds is higher, it should
be concluded that the spread between Italian and
Latvian government bonds remained unchanged, it
decreased by 9 basis points between Spanish and
Latvian government bonds, and it dropped 54 basis
points between Portuguese and Latvian government
bonds. The yield risk premium on bonds of the
euro area countries facing difficulties continued
to decline as these countries started to see signs of
economic recovery. Developments in Greece and
other peripheral countries sent positive signals to
financial markets. The preliminary data suggested
that in 2013 Greece showed better GDP and fiscal
surplus data than expected. In the fourth quarter of
2013, Portugal experienced economic growth, and it
continued negotiations on exiting the international
bailout programme already in May 2014. Of the
euro area countries facing difficulties, the spread
between the yield on long-term government bonds
of Portugal, Slovenia and Greece and that of the
German government bonds of the respective maturity
decreased most notably (see Chart 2.6).
On 28 February, NASDAQ OMX Riga share price
index OMXR increased by 3.5% in comparison with
1 January. At the same time, the Baltic share price
index OMXBBGI rose by 2.5%. In contrast, higher
volatility was observed in foreign stock markets in
January primarily associated with developments
in emerging market economies, but in February
stock prices slightly stabilised. From 1 January
to 28 February the European stock market index
DJ EURO STOXX 50 edged up by 1.3%, the US
stock market index S & P 500 augmented a little by
0.6%, but the Japanese stock market index Nikkei 225
2. Monetary Policy and Financial Markets
Chart 2.6
SPREAD BETWEEN 10-YEAR GOVERNMENT BOND
yields OF EURO AREA PERIPHERAL COUNTRIES
AND the respective GERMAN GOVERNMENT BOND
yield
(percentage points)
14
MACROECONOMIC DEVELOPMENTS REPORT
March 2014
experienced correction going down by 8.9% during
the first two months of 2014 after the astoundingly
high rise in 2013 (see Chart 2.7).
2.3 The ECB monetary policy decisions,
Eurosystem operations, liquidity and money
market developments
In January–March, the ECB did not change the
interest rate on the main refinancing operations and
the interest rates on the marginal lending facility
and the deposit facility also remained unchanged at
0.25%, 0.75% and 0.00% respectively. The ECB did
not employ other monetary policy instruments either,
although inflation in the euro area remained low.
The ECB's decisions were based on signals that the
situation in the euro area was quite controversial: on
the one hand, consumer and producer confidence was
gradually improving; on the other hand, economic
recovery was slow and uneven. In turn, medium-
term inflation expectations still remain stable at the
level in line with the Governing Council's target.
ECB representatives also continued to show their
commitment to keep interest rates low in the future,
and expressed their readiness to use all available
instruments at the ECB's disposal when necessary
to meet its primary objective of maintaining price
stability in the euro area. Decisions of the ECB
Governing Council were no surprise to market
participants, therefore, they did not have a significant
impact on behaviour of financial market participants.
The ECB carried out the main refinancing operations
(on a weekly basis) as fixed rate tenders with full
allotment and a maturity of 1 week. Interest of
Eurosystem credit institutions in the main refinancing
operations declined; the amount allotted in tenders
contracted from 169 billion euro at the end of 2013 to
94 billion euro at the end of February 2014.
2. Monetary Policy and Financial Markets
Chart 2.7
STOCK PRICE INDICES
(1 January 2014 = 100)
15
MACROECONOMIC DEVELOPMENTS REPORT
March 2014
With regard to longer-term refinancing operations,
the ECB lent funds to euro area credit institutions
twice a month with full allotment and a maturity of
1 month and 3 months, with an interest rate equal
to the average interest rate on the main refinancing
operations during the life of the respective longer-
term refinancing operation. During the reporting
period credit institutions took the opportunity to
make an early partial repayment of funds borrowed
in December 2011 and March 2012 when the ECB
carried out longer-term refinancing operations with
a maturity of 3 years. In February 2014, credit
institutions of the euro area countries had repaid the
ECB 487.7 billion euro or 48% of funding allotted
through these operations.
Once a week the ECB organised fixed-term deposit
tenders with a maturity of 1 week to sterilise the
increase in the money supply associated with the
Securities Markets Programme. The maximum
amount of deposits accepted from Eurosystem credit
institutions within this operation on 8 and 15 January
were 179.0 billion euro and 175.5 billion euro in all
February tenders. The weighted average interest rate
on time deposits in the tenders organised during the
reporting period was 0.17%–0.24%.
Excess liquidity (the reserve account of credit
institutions plus the deposit facility minus the
marginal lending facility minus reserve requirements)
in the euro area fell from 283.5 billion euro on
3 January to 125.3 billion euro on 28 February.
This deceleration was caused by several factors: the
decline (88.3 billion euro) in the main and longer-term
refinancing operations, the increase in time deposits
(70.7 billion euro), the growth of government deposits
(43.8 billion euro) and the cutback of banknotes in
circulation (19.1 billion euro). Consequently, the fall
in liquidity was not on account of the autonomous
factors but on account of credit institutions themselves
by participating in ECB monetary operations.
The contraction in excess liquidity in the Eurosystem
had an upward impact on the euro money market
rates. Although interest rates on short-term interbank
loans gradually stabilised after the volatility caused
by the end of 2013 effect, they remained close to the
high level of the post-crisis period. EONIA fluctuated
within the range of 0.10%–0.45% (averaging
0.18% from 1 January to 28 February). At the same
time, fluctuations of the 3-month EURIBOR were
considerably less pronounced (within the range of
0.28%–0.30%), and EONIA volatility did not have a
direct impact on EURIBOR (see Chart 2.8).
Chart 2.8
base ratES
(%)
2. Monetary Policy and Financial Markets
16
MACROECONOMIC DEVELOPMENTS REPORT
March 2014
2.4 Lending and deposit rates
With lending supply and demand factors remaining
basically unchanged, lending rates continued to
fluctuate within a small range, remaining, however,
higher than deposit rates, and thus ensuring
profitability of credit institutions (see Chart 2.9).
After joining the euro area, interest rates on new euro
loans in the Latvian financial market were lower than
in the euro area countries hardest hit by the European
sovereign debt crisis; however, they were higher than
in other euro area countries not so badly affected by
the crisis (see Chart 2.10). This leads to the conclusion
that convergence possibilities of Latvian lending rates
still exist, and if the Latvian government continues to
implement a prudent and sustainable fiscal policy and
economic competitiveness improves further, interest
rates on loans granted in Latvia should decrease in the
medium-term approaching the interest rate level of
the euro area countries less affected by the European
sovereign debt crisis.
The weighted average interest rate on new loans in
all currencies to non-financial corporations increased
in December 2013, while in January 2014 it dropped
to 3.5% reaching a lower level than in November
(3.9%). Overall, the weighted average interest rate
on new loans in euro to non-financial corporations
continued to fluctuate within a small range (see Chart
2.11) as the lending supply and demand factors did
not change significantly: in 2013 the interest rate
on large size loans (exceeding 1 million euro) was
2.6%–4.3% but on loans of up to 1 million euro it was
higher (4.0%–4.9%).
The weighted average interest rate on new loans in all
currencies to households for house purchase moderated
in comparison with November (3.5%) shrinking to
3.1% in January as the respective interest rate on loans
granted in euro fell, and loans granted in lats with a
higher interest rate were replaced by loans in other
currencies with a lower interest rate. The weighted
average interest rate on loans in euro to households for
house purchase also tended to fluctuate within a small
range (3.1%–3.5%) in 2013. In January, the interest rate
on loans to households for house purchase reached the
lowest level since 2004 (3.1%), i.e. from the moment
when statistics on these interest rates is available.
The weighted average interest rate on new consumer
credit in all currencies in comparison with November
recorded a slight increase (from 20.2% in November
to 21.0% in January). The upward trend of interest
2. Monetary Policy and Financial Markets
Chart 2.9
SPREAD BETWEEN INTEREST RATES ON NEW LOANS
AND NEW DEPOSITS
(percentage points)
Chart 2.10
INTEREST RATES ON MFI new loans in EURO to
non-financial corporations in 2013
(%)
Chart 2.11
INTEREST RATES ON MFI SHORT-TERM LOANS IN
euro*
(%)
* Floating interest rates and interest rates with an initial interest rate
fixation period of up to 1 year.
17
MACROECONOMIC DEVELOPMENTS REPORT
March 2014
rates on consumer credits observed since the
beginning of 2013 persisted as new loans in the
consumer credit market were increasingly granted
by smaller credit institutions having lower credit risk
requirements.
Although interest rates on new deposits made by
households and non-financial corporations remained
low, they increased somewhat in December 2013
and January 2014 as credit institutions carried out
seasonal campaigns to attract new deposits by offering
slightly more favourable rates. At the end of 2013,
credit institutions increased interest rates particularly
on deposits in euro at a slightly accelerated pace
to facilitate timely replacement of deposits in lats
with those in euro. The rising interest rates of these
deposits were also affected by the upward fluctuations
of the euro money market index at the close of 2013
and in January 2014 as excess liquidity in the euro
area money market contracted. Overall, the weighted
average interest rate on new deposits attracted in
all currencies from households and non-financial
corporations edged up from 0.2% in November 2013
to 0.3% in January 2014.
2.5 Dynamics of domestic loans and deposits
December was the last month when the lats was the
only legal tender in Latvia. In line with expectations,
with the euro changeover approaching, the amount
of cash in lats in circulation shrank sharply as both
households and enterprises deposited their savings
with credit institutions and the number of non-cash
transactions increased. In December, the total money
supply augmented due to a rise in government
spending and economic growth. In turn, January
2014 – the first month since the introduction of the
single European currency – confirmed the forecast that
the changeover to the euro was also a changeover to a
more active employment of non-cash settlements. Most
of the funds households and enterprises deposited with
credit institutions in December were kept there also in
January suggesting that cash was losing the important
role it played in settlements before.
The monetary aggregate M3 grew by 2.7% in
December, and its annual growth rate reached 2.8%
(see Chart 2.12). The amount of lats in circulation
declined by 360.3 million euro in the last month
of 2013 and in comparison with the end of 2012
it decreased by 56.6%, but the cash component in
broad money shrank to 6.7% in December (15.8% in
December 2012; see Chart 2.13). This was one of the
2. Monetary Policy and Financial Markets
Chart 2.12
ANNUAL RATE OF CHANGE IN MONETARY
AGGREGATES
(%)
Chart 2.13
Currency in circulation
(%)
18
MACROECONOMIC DEVELOPMENTS REPORT
March 2014
2. Monetary Policy and Financial Markets
Chart 2.14
ANNUAL RATE OF CHANGE IN RESIDENT DEPOSITs
(%)
Chart 2.15
ANNUAL RESIDENT DEPOSIT dynamics
(billions of euro)
Chart 2.16
non-mfi deposit dynamics
(billions of euro)
factors determining the record high monthly growth
of deposits by financial institutions, non-financial
corporations and households (721.8 million euro).
Household deposits posted a rapid increase of 6.3%
in December, with the annual growth rate amounting
to 13.2%, and deposits of non-financial corporations
grew at an even faster pace by 11.7% and 14.8%
month-on-month and year-on-year respectively.
At the end of December, domestic deposits with
credit institutions reached 9.2 billion euro overall.
In January, deposits seasonally decreased, albeit
standing at significantly higher levels than in
November. Household deposits went down by a mere
1.4% month-on-month, with the annual growth rate
remaining unchanged, but deposits by non-financial
corporations declined by 5.8%, and their annual rate
of increase was 6.1% (see Charts 2.14 and 2.15).
Although funds attracted from foreign parent credit
institutions continued to diminish, the uplift of the
total foreign liabilities of credit institutions was
determined by non-resident non-MFI deposits (see
Charts 2.16 and 2.17).
19
MACROECONOMIC DEVELOPMENTS REPORT
March 2014
Although December was characterised by a significant
decrease in the loan portfolio for several years due
to both increased repayment of loans and write-
off of bad loans, it was only the household loans
that dropped modestly in December 2013, with the
aggregate loan portfolio decreasing by a mere 0.6%.
In turn, loans to financial institutions and non-
financial corporations augmented; their annual rate of
decrease and the negative annual growth rate of the
total deposits reached 4.9% and 6.4% respectively. In
January 2014, the aggregate loan portfolio of credit
institutions contracted by 3.5%; however, two thirds
of the decline were on account of structural changes –
the SJSC Latvijas Hipotēku un zemes banka and
JSC UniCredit Bank gave up their credit institution
licences as of January. Loans to non-financial
corporations and households in January decreased
by 4.8% and 1.5% respectively. Thus, in January the
annual rate of decrease of loans reached 9.4% (see
Charts 2.18 and 2.19); however, excluding data on the
credit institutions which surrendered their licences,
the annual rate of decrease of loans was only 3.4%,
and household indebtedness continued on a slow but
steady downward trend as household loans gradually
contracted. After the merger of the lats and euro loan
portfolios, at the end of January 95.1% of all domestic
loans were granted in euro and 4.9% – in foreign
currencies thus minimising borrowers' currency risk.
Chart 2.17
CREDIT INSTITUTION FOREIGN LIABILITIES
(billions of euro)
Chart 2.18
ANNUAL RATE OF CHANGE IN LOANS TO RESIDENTS
(%)
Chart 2.19
MONTHLY CHANGE IN LOANS TO RESIDENT
HOUSEHOLDS AND NON-FINANCIAL CORPORATIONS
(millions of euro)
2. Monetary Policy and Financial Markets
20
MACROECONOMIC DEVELOPMENTS REPORT
March 2014
In November and December 2013, credit investments
in forestry, individual subsectors of manufacturing
(wood production and printing), energy, water supply,
wholesale and retail trade, storage, information and
financial services increased. The annual growth rate
of loans in forestry, fishing, individual subsectors of
manufacturing, water supply, wholesale trade, land
transport and other sectors was positive in December
(for changes in the structure of the domestic loan
portfolio see Charts 2.20 and 2.21).
With GDP increasing, the ratio of loans to GDP
continued to decline (in 2013 – 58.1%; in 2012 –
65.5%). Since the total resident deposits increased
and the loan portfolio contracted, the ratio of loans
to residents and resident deposits dropped to 1.46 in
January (1.61 in November; see Chart 2.22).
The positive economic growth and changes in habits
enhanced by the introduction of the euro will foster an
increasing elimination of cash settlements by boosting
popularity of payment card transactions and internet
banking. Against the background of improving
external demand and ongoing positive economic
growth, deposits by non-financial corporations and
households with credit institutions will continue to
expand in 2014; however, the rate of increase will not
be fast. Development trends of loans to enterprises
will determine the lending dynamics, while
households will still refrain from taking new loans,
and their debt level will gradually fall. Although the
aggregate loan portfolio of credit institutions will
continue to diminish, statements by representatives
of individual major credit institutions suggest that
exporting companies, traders and service providers
could be creditworthy customers. Overall, however,
sustainable loan portfolio growth could rebound only
over the next couple of years.
Chart 2.20
CHANGES IN the STRUCTURE OF the DOMESTIC
LOAN PORTFOLIO
(millions of euro)
Chart 2.21
CHANGES IN LOANS TO RESIDENTS
(billions of euro)
Chart 2.22
RESIDENT LOAN TO DEPOSIT RATIO
2. Monetary Policy and Financial Markets
21
MACROECONOMIC DEVELOPMENTS REPORT
March 2014
Chart 3.1
CHANGES IN GDP
(constant prices; %)
Chart 3.2
contribution to ANNUAL CHANGES IN GDP
(demand side; percentage points)
Chart 3.3
Indicators characterising consumption
(2010 = 100; consumer confidence, net responses; %)
3. Domestic Demand
Latvia's GDP growth remained one of the strongest
in the EU in the fourth quarter. The GDP increased
by 0.8% quarter-on-quarter in seasonally non-
adjusted terms and by 3.6% year-on-year (see
Chart 3.1). Private consumption remained the main
growth engine throughout the year (see Chart 3.2).
The purchasing power of households continued to
improve, primarily on account of rising employment
and real wages. Household confidence improved more
notably towards the turn of the year, supported by
the well-organised euro changeover in combination
with the prevalence of consumer-friendly price
developments.
Investment growth was weak in 2013 and gross fixed
capital formation contracted by 10.3% in the fourth
quarter. In 2013, investment developments were
affected by external uncertainties, the "wait-and-see"
attitude with regard to the euro changeover and the
completion of some major investment projects.
The growth of the real exports of goods and services
decelerated and even entered a negative territory in
the third quarter. In the fourth quarter, the exports
were at the level observed a year ago. Considering the
high base (including the good harvest of 2012) and
the decline in exports by JSC Liepājas Metalurgs, the
performance of exports and the manufacturing sector
in the fourth quarter should be viewed as decent.
Real imports of goods and services continued to
contract in the fourth quarter, falling by 3.0% and,
given the unchanged level of exports, made a positive
contribution to GDP growth (1.8 percentage points).
3.1 Private consumption and investment
Private consumption remained the main driver
of economic growth in 2013 (see Chart 3.3),
increasing further by 4.3% in the fourth quarter and
contributing 2.6 percentage points to the overall GDP
growth. At the turn of the year, price developments
were consumer-friendly. Consumption increased
towards the end of the year inter alia on account
of reducing the previously-accumulated savings.
Although households placed part of their cash
savings on current accounts in anticipation of the
euro changeover, a certain share of those savings
was spent, thereby resulting in higher consumption
(see Chart 3.4). Consumer confidence (see Chart 3.5)
improved more notably in the last two months of the
3. Domestic Demand
22
MACROECONOMIC DEVELOPMENTS REPORT
March 2014
3. Domestic Demand
year, implying that the euro changeover proceeded
more smoothly than expected.
The developments in retail trade turnover also pointed
to rising consumption: the increase in sales towards
the turn of the year was more substantial in the case of
food (includes all sales, inter alia the sales of non-
food items at shops primarily selling food), clothing
and furniture. The developments with regard to the
number of cars newly-registered with the Road Traffic
Safety Department (see Chart 3.6) and car sales
were volatile: following a more notable increase in
September and October, the sales volumes dropped in
November and December.
Chart 3.4
CHANGES IN GDP AND PRIVATE CONSUMPTION
(year-on-year; %)
Chart 3.5
CONSUMER CONFIDENCE AND UNDERLYING
FACTORS
(net responses; percentage points)
Chart 3.6
NUMBER OF vehicles NEWLY REGISTERED WITH
THE ROAD TRAFFIC SAFETY DEPARTMENT
(thousands)
23
MACROECONOMIC DEVELOPMENTS REPORT
March 2014
Investment growth was weak in 2013 overall (see
Charts 3.7 and 3.8), and a 10.3% fall was reported
in the fourth quarter. According to the data on non-
financial investment, the drop was slightly more
pronounced for investment in public administration
and public services; nevertheless, private investment
also contracted as suggested by the shrinking imports
of capital goods (see Chart 3.9). The decline of
investment was affected by external uncertainties,
the "wait-and-see" attitude with regard to the euro
changeover and the completion of some major
investment projects. Better industrial and export
performance towards the end of the year allowed
hoping for more favourable investment developments
in the future. However, the events in Ukraine have
renewed and even exacerbated the concerns with
regard to the opportunities to attract investment.
Therefore, the EU funding inflows will be particularly
important to support development.
Chart 3.7
Indicators characterising investment
(2010 = 100; %)
Chart 3.8
CONTRIBUTION OF PRIVATE AND GOVERNMENT
INVESTMENT TO GDP
(%)
Chart 3.9
NON-FINANCIAL INVESTMENT BY SECTOR
(% of total non-financial investment)
3. Domestic Demand
24
MACROECONOMIC DEVELOPMENTS REPORT
March 2014
3.2 Government expenditure and budget
According to the official information by the Treasury,
the surplus of the consolidated general government
budget estimated on a cash flow basis amounted to
91.3 million euro or 0.4% of the forecast GDP in
January 2014, representing a year-on-year increase
of 10.5 million euro (see Chart 3.10). However, there
was a deficit of 128.3 million euro or 0.6% of GDP in
2013 overall in the consolidated general government
budget estimated on a cash flow basis as opposed to
a 27.2 million euro surplus accumulated at the end of
2012.
The rise in the revenue of the consolidated general
government budget decelerated to 1.1% in January
2014 in comparison with the 4.0% increase reported a
year ago. Although the VAT revenue grew by 23.6%,
the revenue from social insurance contributions and
personal income tax, albeit rising towards the end of
2013, was overall smaller. January tax collections
(see Chart 3.11) were broadly as planned: the revenue
target was exceeded, although less than in the
respective period of the previous year (100.3% and
104.9% of the target in January 2014 and January
2013 respectively). Non-tax revenue was 13.5 million
euro smaller year-on-year, mainly on account of the
shrinking repayments of the unspent funding from the
EU funds to the central government basic budget.
The general government consolidated budget
expenditure decreased by 0.6% year-on-year in
January (see Chart 3.12). The decline in spending
was largely a result of lower disbursements of social
benefits (by 27.8 million euro or 14.4%), as part of
them were made at the end of 2013.
The general government debt totalled 9 195.2 million
euro on a cash flow basis at the end of January 2014
(37.0% of the forecast GDP for 2014; estimated as
39.8% of the forecast GDP for 2014 according to
ESA 95 methodology). There is an increase of 923.0
million euro in comparison with January 2013 which
is largely attributable to the 7-year Eurobonds issued
by Latvia in January 2014 in the amount of 1 billion
euro and maturing in January 2021. Debt is expected
to decrease due to a partial repayment (1 billion euro)
of the principal amount of the loan received from the
EC scheduled for the end of March and the maturing
of 10-year government bonds in the amount of 400
million euro in April.
Chart 3.10
ACCRUED BALANCE OF THE CONSOLIDATED
GENERAL GOVERNMENT BUDGET BY level
(billions of euro)
Chart 3.11
SELECTED TAX REVENUE
(January; millions of euro)
Chart 3.12
RATE OF CHANGE IN CONSOLIDATED GENERAL
GOVERNMENT BUDGET EXPENDITURE
(year-on-year; %)
3. Domestic Demand
25
MACROECONOMIC DEVELOPMENTS REPORT
March 2014
4. Aggregate Supply
4.1 Industry and construction
In the fourth quarter, the value added of
manufacturing at constant prices recorded a year-on-
year expansion of 2.6% (contribution to the annual
GDP growth – 0.3 percentage point). At the same
time, the value added of manufacturing (seasonally
adjusted) recorded a quarter-on-quarter rise of 1.5% in
the fourth quarter.
In the fourth quarter, the volume of output in
manufacturing at constant prices increased by 2.0%
quarter-on-quarter and grew by 2.7% year-on-year
(see Chart 4.1). Higher output (6.2%) of the largest
subsector of manufacturing – the manufacture of
products of wood – accounted for the major positive
contribution to the development of manufacturing in
the fourth quarter. Expanding manufacture of food
products (2.7%), basic metals (18.3%) and chemicals
(8.9%) also supported the manufacturing growth. At
the same time, the quarterly decline in the output of
the volatile manufacture of other transport equipment
(51.9%) as well as a reduction in the manufacture of
beverages (9.4%) and wearing apparel (5.1%) exerted
a negative impact.
Year-on-year, the manufacture of food products,
products of wood as well as the manufacture of
computer, electronic and optical products had a
positive impact on the growth of manufacturing in
the fourth quarter. The manufacture of basic metals
exerted the most pronounced adverse effect in annual
terms. The manufacture of basic pharmaceutical
products and pharmaceutical preparations and other
transport equipment and the repair and installation of
machinery and equipment also affected the dynamics
of manufacturing negatively (see Chart 4.2 for the
changes in the manufacturing output in the fourth
quarter of 2013 in comparison with the respective
period of the previous year).
After falling for two quarters the turnover in
manufacturing at current prices recorded a year-on-
year rise of 1.4% in the fourth quarter. Meanwhile,
the turnover in the external market continued on a
downward trend for the third consecutive quarter (a
3.1% drop in the fourth quarter). The turnover rose by
9.2% in the domestic market, and this was the highest
increase since the beginning of 2012, pointing to a
growth in the domestic demand.
Chart 4.1
DYNAMICS OF MANUFACTURING OUTPUT
(at constant prices; %)
Chart 4.2
ANNUAL INDUSTRIAL OUTPUT CHANGES IN THE
FouRTh quarter OF 2013
(working-day adjusted; %)
4. Aggregate Supply
26
MACROECONOMIC DEVELOPMENTS REPORT
March 2014
4. Aggregate Supply
The industrial confidence indicator of manufacturing
aggregated by the EC for the fourth quarter was
0.8 point higher quarter-on-quarter. It was primarily
attributable to a higher assessment of order volume
as well as the assessment of output volume for the
coming months. The sales prices and employment
assessment for the coming months improved
considerably, while the assessment of the export order
volume recorded the only subdued decline. Hence the
signals from Latvia's business surveys regarding the
fourth quarter are to be considered positive overall.
Production capacity utilisation projected for the first
quarter of 2014 has remained almost unchanged
(72.2% in the fourth quarter of 2013 and 72.1% in the
first quarter of 2014; see Chart 4.3). In the breakdown
by sector, production capacity utilisation was high
in the manufacture of wood and of products of wood
and cork (80.2%), paper products (78.3%), printing
and reproduction of recorded media (78.1%) and
electrical equipment (76.8%). Production capacity
utilisation recorded the most buoyant expansion in
the manufacture of electrical equipment (an increase
of 9.8 percentage points), motor vehicles, trailers
and semi-trailers (a rise of 9.0 percentage points)
and pharmaceutical preparations (a growth of 7.3
percentage points). At the same time, the manufacture
of basic metals (41.6%; 6.5 percentage points – the
sharpest drop in this sector), beverages (59.8%),
non-metallic mineral products (64.2%) as well as the
manufacture of textile articles (64.6%) accounted
for low projected production capacity utilisation.
A notable decline in the production capacity
utilisation has also been projected in the food industry
(4.4 percentage points; to 66.0%).
Businesses reported the lack of demand as a growth-
restrictive factor also in the first quarter of 2014
(37.7% of the total number of respondents; see Chart
4.4); however, this indicator continued on a downward
trend. A larger number of respondents than in the
previous quarter pointed to the lack of equipment
(11.9%) and the lack of available financing (5.7%).
In the latest business survey, however, the number of
respondents identifying no substantial constraint for
the production was an all-time high (35.5%).
As regards manufacturing, preliminary data for
January were particularly negative. In January, the
volume of output shrank by 17.3% in comparison with
December (seasonally adjusted), whereas the annual
fall was 11.3%. In the post-crisis period seasonality
of manufacturing changed every year, this being the
Chart 4.3
PRODUCTION CAPACITY UTILISATION IN
MANUFACTURING
(%)
Chart 4.4
GROWTH-RESTRICTIVE factors IN
mANUFACTURING
(% of replies from respondents)
27
MACROECONOMIC DEVELOPMENTS REPORT
March 2014
most likely reason why the seasonality filters allowed
the drop in the non-adjusted data to be as strongly
reflected in the seasonally adjusted data. However, not
all can be explained by seasonality. The deterioration
of the non-adjusted data this January has been
considerable even for the usually volatile beginning of
the year. The negative development of manufacturing
was attributable to the subsector of the manufacture
of basic metals, showing a very steep fall in output.
In annual terms, it was still mainly on account of the
impact of the wind-up of JSC Liepājas Metalurgs,
since January 2013 was the last month when the
company operated at full capacity. At the same time,
the decline against December 2013 is in line with the
information published recently in mass media about
the problems encountered by some metalworking
companies as well as the long-term stagnation in the
metallurgical industry of the EU. However, other data
do not point to any serious problems in the industry.
The Latvian business confidence indicators improved
in January and February due to a lower assessment
of the inventories of finished goods. High business
confidence indicator is consistent with the one
observed at the beginning of 2008.
In 2014, the growth in manufacturing will depend
to a large extent on the developments in the external
environment, since exports account for about 62%
of the overall turnover. The development outlook
for the euro area gives rise to hopes that the external
demand for Latvia's export goods will follow an
upward path. The construction sector in the major
trade partner countries is also recovering, suggesting
that, for instance, the wood industry could be
expected to expand further also in 2014, if the access
to raw materials is sufficient. However, in 2014 the
domestic developments are expected to play a more
significant role in manufacturing than before. Private
consumption has become the main driver of GDP
growth as a result of a rise in disposable income and
more active spending of savings. In line with that,
data on manufacturing also reflect an ever increasing
rise in turnover in the domestic market, whereas the
turnover in exports has shrunk over the last quarters.
In 2014, the recovery of investment activity may
be reasonably anticipated in the sector since a new
round of inflows of financing from the EU funds
begins. Successful implementation of the investment
projects should lead to an expanding volume of
output and higher value added in the sector.
In the fourth quarter, the value added of the
construction sector recorded a year-on-year rise of
4. Aggregate Supply
28
MACROECONOMIC DEVELOPMENTS REPORT
March 2014
3.9%. The value added (seasonally adjusted) of the
construction sector declined by 0.5% quarter-on-
quarter. The contribution of the construction sector
to the annual GDP growth was 0.3 percentage point.
At the same time, construction output at current
prices recorded a year-on-year increase of 5.2% in
the fourth quarter (see Chart 4.5). The construction
of engineering structures (3.5 percentage points),
including that of pipelines and communication lines
(3.9 percentage points) and bridges and tunnels
(1.1 percentage points), accounted for the major
contribution to the annual growth. The construction
of apartment blocks (contribution – 3.1 percentage
points) was the main driver of the expanding
construction of residential buildings (contribution –
3.3 percentage points). The negative contribution
of non-residential buildings segment, observed in
the previous two quarters, persisted (1.6 percentage
points); however, the construction of administrative
buildings was a notable positive contributor
(3.2 percentage points) to the sector.
The construction confidence indicator assessed by the
EC declined by 1.6 percentage points in the fourth
quarter. This development was mainly attributable
to a sharply deteriorating assessment of employment
expectations for the next three months. Builders
primarily pointed to a lack of demand (43.2%) and
weather conditions (23.8%) as the constraint for
business growth. One-fourth of builders did not refer
to any construction hampering factors. In January
the construction confidence indicator improved
(associated with a higher assessment of employment
for the next three months); however, in February the
confidence indicator deteriorated moderately, mainly
on account of a lower order assessment.
4.2 Services
In the fourth quarter of 2013, the value added of the
services sector at constant prices recorded a year-
on-year increase of 4.3%. The overall contribution
of the services sector to the annual GDP growth was
2.7 percentage points (see Chart 4.6 for the changes
in value added of the main types of services). Public
administration (0.6 percentage point), real estate
activities (0.5 percentage point) and professional
services (0.4 percentage point) were the major
positive contributors to GDP growth in the fourth
quarter of 2013.
Growth in retail trade turnover also continued in the
fourth quarter (see Chart 4.7). Retail trade turnover
Chart 4.5
CONTRIBUTION OF SOME TYPES OF CONSTRUCTION
objects TO ANNUAL CONStRUCTION GROWTH AT
CURRENT PRICES
(percentage points)
Chart 4.6
CHANGES IN VALUE ADDED BY MAIN TYPES OF
SERVICES
(year-on-year; seasonally adjusted data; %)
4. Aggregate Supply
29
MACROECONOMIC DEVELOPMENTS REPORT
March 2014
Chart 4.7
BREAKDOWN BY QUARTERLY CHANGES IN RETAIL
TRADE TURNOVER
(percentage points)
Chart 4.8
ANNUAL CHAnGES IN FREIGHT TURNOVER BY MAIN
TYPE OF FREIGHT TRAFFIC
(%)
increased by 1.0% quarter-on-quarter (including the
sales of motor vehicles – by 0.8%). The rise was
mainly attributable to an increasing sales volume
of food products, furniture and household goods,
probably on account of the households spending
their lats savings prior to the euro changeover. It
should be noted that the breakdown is based on the
main operating activity of the companies; hence
the expanding sales volume of supermarkets may
be associated not only with the purchase of food
products, but also with the purchase of household
goods, wearing apparel and other consumer durables.
Retail trade turnover rose by 4.0% year-on-year
(including the sales of motor vehicles – by 6.0%).
In the fourth quarter, the value added of the
transportation and storage sector reported a year-
on-year rise of 0.1% (see Chart 4.8 for the annual
changes in freight turnover by the main types of
transport). The value added of the sector shrank by
0.6% quarter-on-quarter (seasonally adjusted data),
increasing by 1.3% in 2013 overall.
With the negative trend observed at the end of 2012
persisting, cargoes loaded and unloaded overall at
Latvia's ports in the fourth quarter of 2013 declined
by 0.8% year-on-year. The situation had improved
more over the last quarter of the year than was
usually observed. The sharply declining volume of
cargoes loaded and unloaded at Liepāja port (34.3%)
contributed most to the shrinking overall cargo
traffic, albeit the ports of Riga and Ventspils recorded
a pickup (4.7% and 3.2% respectively). A notable
reduction in cargo volume at Liepāja port is, most
likely, associated with both the wind-up of the JSC
Liepājas Metalurgs and the fact that harvests were
smaller in 2013 than in 2012.
The turnover of freight traffic by rail (indicator
based on the distance covered and freight weight)
grew by 4.9% in the fourth quarter, discontinuing
the downward trend that started in the fourth quarter
of 2012. The increasing turnover was on account
of a rise in international freightage (6.1%). At the
same time, the turnover of domestic freight shrank
steeply (by 30.7%). The volume of freight traffic by
rail (indicator based on the freight weight only) rose
more than the turnover (by 6.3%) over the year. It was
underpinned by expanding imports (11.6%). However,
exports and freight transit declined (by 14.2% and
19.2% respectively).
In the fourth quarter, the volume of freight traffic by
road increased by 11.7% year-on-year, whereas the
4. Aggregate Supply
30
MACROECONOMIC DEVELOPMENTS REPORT
March 2014
turnover of freight traffic by road (indicator based on
the distance covered and freight weight) fell by 3.4%.
The overall annual reduction was for the most part
determined by the decreasing turnover of international
freight traffic by road (3.0%); however, the domestic
turnover of road freight also shrank (by 4.6%).
Preliminary data for the first quarter of 2014 point to
a minor improvement of the situation. The increase
in the volume and turnover of rail freight that started
in the fourth quarter of 2013 continued in January
and February. Freight traffic at ports also recorded an
expansion. Improving performance of the transport
sector might be associated with the trend of a gradual
economic recovery observed in the EU; however,
concern about the sustainability of the situation
persists.
4.3 Labour market
Real unemployment or the rate of jobseekers
continued to decline in the fourth quarter of 2013
reaching 11.3% of the economically active population,
despite of the lay-offs at JSC Liepājas Metalurgs (the
estimated impact of the wind-up of this company
on unemployment is about 0.2 percentage point).
Consequently, the rise in registered unemployment
observed in the last three months (9.8% at the end
of January; see Chart 4.9) reflects the impact of the
problems associated with the wind-up of JSC Liepājas
Metalurgs and the seasonal effects rather than
suggests any shifts in the underlying labour market
trends.
The rate of jobseekers in the euro area stabilised
towards the turn of 2013 at the level of 12%, close to
the historical maximum. The high unemployment rate
of the euro area, however, was determined by the rates
reported by individual Member States (e.g. Spain and
Greece), as their competitiveness deteriorated sharply
during the period of the economic boom and they
attempted to postpone the fiscal austerity measures
after the onset of the crisis. In several other euro
area Member States (including Latvia), the current
unemployment rate is close to the average of the
last 15 years, whereas in some Member States (e.g.
Germany and Estonia) it is considerably below the
historical average.
An increase in job vacancies also points to improved
employment opportunities. As at the end of January
2014, there were 4.7 thousand vacancies registered in
the SEA databases (about 1 000 vacancies more than
Chart 4.9
registered unemployment rate and RATE OF
jobseekers
(%)
4. Aggregate Supply
31
MACROECONOMIC DEVELOPMENTS REPORT
March 2014
in January 2013; see Chart 4.10). On average, 5% of
the registered unemployed found a permanent job in a
period of one month, the same as in 2006. The number
of long-term unemployed decreased gradually as well
as their proportion in the total number of unemployed
(see Chart 4.11).
Average monthly gross nominal wage continued to
increase moderately in the fourth quarter, rising by
4.8% and thereby easing the concerns over potential
deterioration of competitiveness and creating no
significant upward pressure on inflation. Both private
and public sector wages increased at a similar rate
(see Chart 4.12). One of the factors suggesting that
Latvia is currently in a state of a macroeconomic
balance is the fact that the average wage is in line
with the labour productivity (see Chart 4.13).
Consequently, sustainable wage increases can only be
achieved through raising productivity.
4. Aggregate Supply
Chart 4.10
BEVERidGE CURVE: NUMBER OF UNEMPLOYED
PERSONS REGISTERED WITH THE SEAAND THAT OF
VACANCIES
(in thousands)
Chart 4.11
long-term unEMPLOYEd*
(%)
* Persons registered with the SEA for a period of over 1 year.
Chart 4.12
ANNUAL CHAnGES IN average nominal and real
full-time monthly wage
(%)
32
MACROECONOMIC DEVELOPMENTS REPORT
March 2014
Businesses' views on the presence of labour shortage
have stabilised at a moderate level, suggesting that
any wage increases will be based on productivity
gains; hence they will be sustainable and will not
impair the competitiveness of the economy (see Chart
4.14).
Nominal unit labour costs followed a gradual upward
trend, confirming the sustainability of the revival in
competitiveness. Both nominal and real unit labour
costs were notably lower than in 2008.
The decline in unemployment in Latvia which was
quite notable in the previous three years is expected
to decelerate in 2014. A sustainable decrease in
Latvia's unemployment can only be achieved through
reducing the structural unemployment, which could
be supported by both robust economic development
as well as the implementation of active labour market
policy initiatives. Yet this cannot happen quickly.
Therefore, Latvia's medium-term economic growth
will be increasingly more based on productivity
gains rather than higher employment. According
to the CSB labour survey, the annual rise in the
number of employed was 0.8% in the fourth quarter,
which is one of the weakest performances since
overcoming the economic crisis. The SRS data on
the number of employed also point to decelerating
employment growth. Considering the notable GDP
growth, the annual increase of labour productivity
could reach about 3% which, in turn, is one of the
best achievements of late. Consequently, Latvia's
economic growth is gradually shifting from an
extensive development to an intensive one, supporting
sustainable wage increases.
4. Aggregate Supply
Chart 4.13
REAL WAGE AND SALARY AND LABOUR
PRODUCTIVITY INDEx
(historical average = 100; seasonally adjusted data)
Chart 4.14
THE RATE OF BUSINESSES WHO FIND LABOUR
SHORTAGE THE MAIN OBSTACLE FOR BUSINESS
GROWTH
(%)
33
MACROECONOMIC DEVELOPMENTS REPORT
March 2014
5. Costs and Prices
5. Costs and Prices
In January and February 2014, annual inflation
remained low (0.4% and 0.5% respectively), while
approaching inflation rates associated with economic
growth. Inflation continued to be low due to supply-
side factors – the annual rate of increase in fuel and
heating prices still remained negative (see Chart 5.1).
The negative contribution of energy prices (see
Chart 5.2) is related to both the base effect of the
cogeneration projects launched or expanded in 2013
and offering a lower heating tariff and the price level
of fuel resources (oil products) which remained
relatively stable and did not affect the dynamics of
fuel prices significantly. Although the contribution of
heating prices was still negative, it declined somewhat
as contrary to January 2013, a moderate heating price
increase (e.g. in Valmiera) was observed in January
2014. However, already in February the dynamics of
the prices of resources (natural gas) contributed to a
further decrease in heating prices in Latvia, while in
March the heating tariff was reduced in Daugavpils
under the impact of the factors unrelated to fuel
resources, and this will be reflected in inflation data
in the future. The price of Brent crude oil fluctuated
in a relatively narrow band (107–112 US dollars per
barrel) in January–March, falling slightly at the end
of the reporting period (see Chart 5.3). The price of
Brent crude oil was primarily affected by the demand
and supply ratio. According to the International
Energy Agency's estimates, the global demand for
crude oil is projected to strengthen moderately in
the second quarter of 2014. Likewise, an increase in
supply which will be more rapid than an increase in
demand, thus exerting a downward effect on crude oil
prices is expected.
Chart 5.1
CHANGES IN CPI BY COMPONENT
(percentage points)
Chart 5.2
IMPACT OF ENERGY AND FOOD PRICE CHANGES ON
ANNUAL CONSUMER PRICE INFLATION
(percentage points)
Chart 5.3
OIL PRICES ON GLOBAL MARKET
34
MACROECONOMIC DEVELOPMENTS REPORT
March 2014
5. Costs and Prices
The global food price developments had a stabilising
effect on food prices in Latvia in January, with only
prices of dairy products recording a rise due to the
growing demand. Other major food commodity
groups posted a minor price drop, which was
favourably affected by the harvest estimates in the
countries having the harvest season at the beginning
of the year (see Chart 5.4). In January, the seasonal
increase in potato and vegetable prices in Latvia
exceeded the seasonal price rise in this group in
2013, accounting for 0.2 percentage point (half) of
annual consumer price inflation. The majority of food
commodity groups recorded an increase in prices on
the global market in February. There are concerns
about the expected harvest in several regions of the
northern hemisphere due to unusual winter weather
conditions, and this could be one of the reasons why
the prices of agricultural commodity futures have
followed an upward trend somewhat.
Although annual core inflation rose to 1.3% in
January and 1.4% in February along with an increase
in non-administered service prices, neither the
monthly nor the annual price rise in total consumption
and services exceeded the average level observed
in January and February 2004–2013 in January and
February 2014. The data for the beginning of the year
is too small an amount of information to estimate
the impact of the introduction of the euro on prices
as many price changes may be temporary. Thus, it
will be possible to estimate the impact of the price
changes untypical for the season (e.g. the introduction
of the euro) on inflation during the year. However,
the flash impact assessment made by using the data
of price monitoring and the price changes typical for
January suggests that the price changes which are
not underpinned by concrete factors or are related to
maintaining attractive prices may have influenced
the average consumer price level, without exceeding
the amount estimated in 2013 (approximately 0.2
percentage point of total inflation both between
September 2013 and January 2014 and only in
January 2014).
The share of the respondents who considered that
consumer prices would rise rapidly during the year,
affecting overall inflation expectations favourably
decreased temporarily in January (see Chart 5.5).
At the same time, the share of the respondents
whose answers indicate that a moderate price rise is
expected increased. The share of the respondents who
considered that consumer prices had risen rapidly
during the year declined in December and January.
Chart 5.4
GLOBAL FOOD PRICES
(average monthly indicator of 2002–2004 = 100)
Chart 5.5
BREAKDOWN OF HOUSEHOLD EXPECTATIONS FOR
CONSUMER PRICE CHANGES IN NEXT 12 MONTHS
(%)
35
MACROECONOMIC DEVELOPMENTS REPORT
March 2014
This indicator showed a slight increase in February
(data on inflation in January that was higher than in
December were available), but did not reach the level
observed in November. At the same time, the share
of the respondents who considered that consumer
prices would rise rapidly during the year rebounded
again to the December level in February. The decrease
in heating prices observed in February did not
improve the people's price perception, but it could
become more optimistic in March and April, while
knowing that the heating price is expected to decline
further in several cities. Likewise, liberalisation
of the electricity market has been postponed, thus
limiting electricity price rises temporarily, and the
Public Utilities Commission has approved reductions
in the inter-operator tariffs for the providers of
telecommunications services.
5. Costs and Prices
36
MACROECONOMIC DEVELOPMENTS REPORT
March 2014
6. Balance of Payments
The current account deficit of Latvia's balance of
payments decreased to 134.3 million lats or 0.8%
of GDP in 2013 (see Chart 6.1). It was driven by
a decline in foreign trade deficit in goods and the
growing foreign trade surplus in services.
The goods and services foreign trade balance
improved in 2013, with the foreign trade deficit
decreasing to 305.9 million lats or 1.9% of GDP.
At the same time, exports of services increased by
4.8%, while imports of services expanded merely
by 0.3% (see Chart 6.2). Transportation services
were dampened by the relative weakness of external
demand, while exports of all other services posted a
rise.
The income account deficit dropped to 233.5 million
lats or 1.4% of GDP in 2013 as profit earned by
foreign direct investors in Latvia decreased somewhat.
The surplus of the current transfers account and the
capital account likewise declined (to 405.0 million
lats or 2.5% of GDP and 402.7 million lats or 2.5%
of GDP respectively) in comparison with 2012. The
dynamics of the current transfers and capital accounts
was primarily determined by a change in the amount
of the EU funds received. 738.9 million lats were
received from EU funds in 2013; however, albeit less
than year-on-year, the amount corresponded to 4.5%
of GDP.
The financial account recorded a deficit of 135.2
million lats or 0.8% of GDP in 2013. Foreign direct
investment inflows into Latvia amounted to 427.9
million lats or 2.6% of GDP in 2013 (see Chart 6.3).
The amount of foreign direct investment recorded
in financial and insurance activities increased in
comparison with the previous year, while investment
in real estate activities decreased. The contribution
of investment to manufacturing expanded from
approximately 10% in 2012 to approximately 15% of
total foreign direct investment in 2013 (see Chart 6.4).
The fourth quarter of 2013 when the largest inflows of
investment were recorded in financial and insurance
activities (from Russia, Sweden and the Netherlands),
the energy sector (from Russia and Germany) as well
as manufacturing (manufacture of food products –
from Lithuania, Cyprus and Malta, woodworking –
from Cyprus and the Netherlands, and manufacturing
of chemicals and chemical products – from Russia
and Czech Republic) was successful to attract foreign
direct investment.
6. Balance of Payments
Chart 6.1
CURRENT ACCOUNT OF LATVIA'S BALANCE OF
PAYMENTS AND ITS COMPONENTS
(% of GDP)
Chart 6.2
GROWTH RATE OF EXPORTS AND IMPORTS OF GOODS
AND SERVICES
(year-on-year; %)
Chart 6.3
FOREIGN DIRECT INVESTMENT IN LATVIA
(% of GDP)
37
MACROECONOMIC DEVELOPMENTS REPORT
March 2014
In late 2013 and early 2014, several international
credit rating agencies have confirmed Latvia's credit
rating at the present level, but Standard & Poor's
raised Latvia's credit rating outlook from stable
to positive, thus acknowledging stable economic
development. The balance of payments financial
flows at the beginning of 2014 will be also affected
by the fact that Latvia successfully launched an
issue of bonds in the amount of 1 billion euro on
the international markets (the previous issue of
the Latvian government bonds on the international
markets took place in December 2012). The payments
for the loan received from the EC within the
framework of the international financial assistance
programme and the bonds issued on the international
markets previously are to be made in 2014.
Chart 6.4
net flows of FOREIGN DIRECT INVESTMENT
(millions of euro)
6. Balance of Payments
38
MACROECONOMIC DEVELOPMENTS REPORT
March 2014
7. Conclusions and
Forecasts
7.1 Economic developments
In the fourth quarter of 2013, the economic growth
in Latvia was slightly slower than projected. GDP
grew by 3.6% year-on-year (0.8% over the previous
quarter). Contribution of retail trade turnover and
manufacturing allowed us to hope for more rapid
GDP growth; however, the latter slightly moderated
on account of weak performance in the energy and
construction sectors.
In 2014, the economic development prospects will be
affected by domestic factors, generally favourable for
further growth. The contribution of industry in 2013
and the publicly available investment projects suggest
that growth in industrial output will also continue in
2014; however, new investments might be hindered
by negative sentiment effects caused by the impact
of the Russian–Ukrainian crisis. Retail trade turnover
saw a robust increase, and there is no reason to expect
it to fall significantly in 2014. As regards construction,
its growth will mostly depend on the available
funding and the overall investment activity in the
private sector. Private and public funding will remain
at approximately the same levels as in 2013, while the
amount of EU funds will be cardinally different when
broken down by subprogramme. Nevertheless, growth
is generally expected to persist in construction as well.
The growth prospects of the transportation and
storage sector cause the most prominent concern.
2013 was quite unfavourable for the sector in general:
the increase in the demand for freight transportation
in the Baltic Sea region moderated and the mutual
competition of ports for the freight flow became more
pronounced. Moreover, several taxes and duties (port
tax and road use duty) have been introduced in 2014;
they might hinder more accelerated growth of the
sector. With growth recovery in EU countries in the
next few years, the demand for transportation services
is also expected to increase gradually in the Baltic
Sea region; however, it might be dampened by the
slowdown of the Russian economic growth.
Despite the persisting gradual improvement of the
economic situation in the euro area countries, growing
uncertainty regarding the developments in Russia and
Ukraine is observed in the external environment. In
2014, the euro area GDP is expected to increase for
the first time since 2011. At the beginning of the year
7. Conclusions and Forecasts
39
MACROECONOMIC DEVELOPMENTS REPORT
March 2014
Chart 7.1
CHANGES in GDP
(year-on-year; %; forecast of Latvijas Banka*)
* The coloured area represents 90% of potential scenarios (the lighter
the colour, the lower the scenario's probability).
several economic confidence indicators (confidence
indicators aggregated by the EC, PMI, etc.) suggested
gradual economic recovery. Gradual strengthening
of the US economic growth is also observed;
nevertheless, the tapering of the FRS securities
purchase programme might have a negative effect.
The emerging market economies, having been the
driving force of the global economic growth in
recent years, have lately shown signs of moderating
economic growth. In 2013, weaker growth was also
observed in two Baltic Sea region countries (Estonia
and Finland). The gradual moderation of the Russian
economic growth rate is particularly significant for the
economy of Latvia. The situation is aggravated by the
accelerating tension and uncertainty about the mutual
relationship of Ukraine and Russia that could lead
to further weakening of the economic growth in the
region, with a potentially unfavourable effect also on
the Latvian economy, e.g. manufacturing exports and
travel and transportation sectors in particular.
Sectoral performance indicators for the fourth quarter
of 2013 and the preliminary indicators for the first
quarter of 2014 suggest sustainable economic growth.
In view of the high production capacity utilisation,
as well as intensive drawdown of selected EU funds
from the previous planning period in 2014 and
2015, investment growth is likely to be more rapid
than projected. External risks, however, are on the
downside, and they have increased significantly.
They are mostly related to the weakening of the
Russian economic activity and uncertainty regarding
the future developments in Russia and Ukraine.
Consequently, the medium-term risks to the national
economic growth outlook are generally considered to
be on the downside (see Chart 7.1). At this stage, the
development of the new forecasts is in progress; they
will be published in June 2014.
7.2 Inflation
Annual inflation remained low mostly on account
of supply side factors. Nevertheless, the inflation
rate became positive and was closer to a level
characteristic of economic growth periods. The global
raw material prices have a favourable impact and
inflation expectations are moderate.
Annual core inflation rose to 1.3% and 1.4% in
January and February respectively, including a pick-
up in prices on non-administered services; however,
neither the overall price rise (in monthly and annual
7. Conclusions and Forecasts
40
MACROECONOMIC DEVELOPMENTS REPORT
March 2014
terms) nor the increase in service prices exceeded the
averages observed in the respective months over the
last ten years. The data for the beginning of the year
is too small an amount of information to estimate the
effect of the euro changeover on prices as many price
changes may be temporary. Thus, it will be possible to
estimate the impact of the price changes unusual for
the season (e.g. the euro changeover) on inflation over
a year.
Risks to the average inflation (HICP) for 2014
mostly lie in the postponement of electricity market
liberalisation for households. The impact of the above
decision on the inflation rate forecast for 2014 is
significant (even a decline of 0.6 percentage point
could be reached), with a respective increase in the
inflation forecast for 2015 (see Chart 7.2).
The risks related to administered price dynamics
might mutually offset each other. Public transport
fares in Riga will be lower in 2014 in comparison with
2013. Inter-operator tariffs for telecommunications
services have also been reduced. Heating tariffs
continue on the downward trend in several cities
and towns, both on account of the natural gas price
and other factors. However, prices of water supply
and sewage are likely to rise in several cities and
towns, and the uncertain dynamics of the Ukrainian–
Russian relationship might affect the energy price
developments. Due to political factors and natural
conditions, there is uncertainty regarding the levels
of grain prices in this season. Overall, the risks to the
inflation outlook currently could be considered to be
on the downside.
Chart 7.2
HICP CHANGES
(year-on-year; %; forecast of Latvijas Banka*)
* The coloured area represents 90% of potential scenarios (the lighter
the colour, the lower the scenario's probability).
7. Conclusions and Forecasts
41
MACROECONOMIC DEVELOPMENTS REPORT
March 2014
Statistics
Statistics
List of tables
1.	 Monetary Indicators and Interest Rates	 43
2.ab	 Real Sector Indicators and Prices	 44
3.	 Monetary Base	 45
4.	 Monetary Aggregates and Counterparts 	 46
5.	 Seasonally Adjusted Monetary Aggregates	 46
6.	 Assets and Liabilities of Latvijas Banka 	 47
7.	 Aggregated Balance Sheet of MFIs (excluding Latvijas Banka) 	 48
8.	 Consolidated Balance Sheet of MFIs 	 49
9.ab	 Aggregated Balance Sheet of MFIs (excluding Latvijas Banka)	 50
10.	 Monetary Survey	 51
11.ab	 Foreign Assets and Liabilities of MFIs (excluding Latvijas Banka)	 54
12.	 Selected Items in the Monthly Financial Position Report of MFIs (excluding
	 Latvijas Banka) by Group of Countries	 55
13.	 Maturity Profile of Deposits of Resident Financial Institutions, Non-Financial
Corporations and Households (in lats and foreign currencies)	 55
14.a	 Deposits by Financial Institutions (in lats and foreign currencies)	 56
14.b	 Deposits by Non-Financial Corporations (in lats and foreign currencies)	 57
14.c	 Deposits by Households (in lats and foreign currencies)	 59
14.d	 Deposits by Government and Non-Residents (in lats and foreign currencies)	 59
15.	 Maturity Profile of Loans to Resident Financial Institutions, Non-Financial
Corporations and Households (in lats and foreign currencies)	 60
16.a	 Loans to Financial Institutions and Non-Financial Corporations	 60
16.b	 Loans to Households	 61
16.c	 Loans to Government and Non-Residents	 61
17.	 Loans to Financial Institutions and Non-Financial Corporations in the National
Economy	62
18.	 Lending to Resident Financial Institutions, Non-Financial Corporations and
Households	62
19.a	 Holdings of Securities Other than Shares	 63
19.b	 Holdings of Shares and Other Equity	 63
20.a	 Currency Breakdown of Resident Deposits 	 64
20.b	 Currency Breakdown of Non-Resident Deposits 	 64
20.c	 Currency Breakdown of Loans to Residents	 65
20.d	 Currency Breakdown of Loans to Non-Residents	 65
20.e	 Currency Breakdown of Holdings of Resident Securities Other than Shares	 66
20.f	 Currency Breakdown of Holdings of Non-Resident Securities Other than
Shares	66
20.g	 Currency Breakdown of Debt Securities Issued by MFIs	 67
21.a	 Weighted Average Interest Rates Charged by MFIs in Transactions with
Resident Non-Financial Corporations and Households in Lats	 67
21.b	 Weighted Average Interest Rates Charged by MFIs in Transactions with
Resident Non-Financial Corporations and Households in Euro	 71
21.c	 Weighted Average Interest Rates Charged by MFIs in Transactions with
Resident Non-Financial Corporations and Households in US Dollars	 75
21.d 	 Weighted Average Interest Rates Charged by MFIs in Transactions with Resident
Non-Financial Corporations (new business)	 80
42
MACROECONOMIC DEVELOPMENTS REPORT
March 2014
Statistics
22.	 Lending in the Interbank Markets 	 81
23.a	 Interest Rates in the Domestic Interbank Market	 82
23.b	 Interest Rates Set by Latvijas Banka	 82
23.c	 Interest Rates in Latvijas Banka Tenders of Repurchase Agreements
and Short-Term Currency Swap Contracts	 83
24.	 Principal Foreign Exchange Transactions (by type, counterparty and currency)	 83
25.	 Non-cash Foreign Exchange Transactions	 84
26.	 Monthly Averages of the Exchange Rates Set by Latvijas Banka	 85
27.	 Weighted Average Exchange Rates (cash transactions)	 85
28.	 Structure of Government Securities 	 86
29.	 Auctions of Government Securities in the Primary Market	 87
30.	 The Bank of Latvia's Transactions in the Secondary Market for
Government Securities	 87
31.	 Dynamics of GDP	 87
32.	 Changes in the Average Monthly Wages and Salaries and Unemployment	 88
33.	 Latvian Foreign Trade Balance	 88
34.	 Main Export Goods of Latvia	 89
35.	 Main Import Goods of Latvia	 89
36.	 Latvian Foreign Trade Partners	 90
37. 	 Convenience and Extended Credit, Revolving Loans and Overdraft to Resident
Non-financial Corporations and Households	 91
38.a	 Loans to Resident Non-financial Corporations in the Breakdown
by Residual Maturity and by Interest Rate Reset Period	 91
38.b	 Loans to Resident Households in the Breakdown by Residual Maturity and
by Interest Rate Reset Period	 92
43
MONETARY INDICATORS AND INTEREST RATES
2012 2013
Q1 Q2 Q3 Q4 Q1 Q2 Q3 Q4
M11
10.9 16.6 12.8 14.8 10.9 8.0 10.4 14.1 9.1 8.0
M21
3.8 0.5 2.4 1.9 3.8 1.9 2.1 1.2 –0.4 1.9
M31
2.8 –0.1 2.0 2.3 2.8 2.8 3.8 3.3 1.0 2.8
M2X1
4.5 1.3 2.3 2.6 4.5 2.0 3.3 2.7 1.0 2.0
Loans to resident financial
institutions, non-financial
corporations and households1
–10.6 –11.0 –11.6 –11.2 –10.6 –6.4 –6.7 –6.4 –7.6 –6.4
Deposits of resident financial
institutions, non-financial
corporations and households1
4.5 –2.5 –0.8 –0.2 4.5 13.2 4.1 4.2 5.1 13.2
Long-term interest rate for
convergence assessment purposes2
4.57 5.45 5.11 4.35 3.36 3.34 3.20 3.14 3.32 3.70
RIGIBOR (3-month loans)3
0.9 1.4 1.0 0.6 0.5 0.4 0.5 0.4 0.3 0.3
Average yield on government
bonds 4.94
4.35
5.24
4.14
3.14
2.25
1.46
1.16
1.26
2.25
OMXR3
383.9 388.3 379.4 382.8 384.7 432.5 405.8 416.5 457.7 448.2
1.
2012 2013
X XI XII I II III IV V VI VII VIII IX X XI XII
M11
15.9 8.0 10.9 13.3 12.3 10.4 13.1 15.4 14.1 11.9 11.4 9.1 7.9 7.7 8.0
M21
3.7 4.4 3.8 4.7 3.7 2.1 2.3 2.4 1.2 0.4 –0.2 –0.4 –0.8 –0.6 1.9
M31
4.0 5.1 2.8 3.7 3.4 3.8 4.2 4.2 3.3 1.8 1.2 1.0 0.8 0.7 2.8
M2X1
5.1 8.9 4.5 5.4 4.2 3.3 3.4 3.9 2.7 2.0 1.4 1.0 0.1 –0.4 2.0
Loans to resident financial
institutions, non-financial
corporations and households1
–11.0 –10.9 –10.6 –10.4 –10.1 –6.7 –7.2 –4.5 –6.4 –6.6 –6.9 –7.6 –8.2 –7.7 –6.4
Deposits of resident financial
institutions, non-financial
corporations and households1
2.9 8.3 4.5 6.2 5.2 4.1 4.9 5.1 4.2 4.2 4.3 5.1 5.1 5.5 13.2
Long-term interest rate for
convergence assessment purposes2
3.52 3.32 3.24 3.21 3.22 3.17 3.15 3.10 3.17 3.25 3.25 3.45 3.78 3.71 3.62
RIGIBOR (3-month loans)3
0.5 0.5 0.5 0.5 0.5 0.5 0.4 0.4 0.4 0.3 0.3 0.3 0.3 0.2 0.3
Average yield on government
bonds 3.14
– – 1.46
1.46
1.26
1.26
1.16
1.16
1.16
1.26
– 2.35
2.05
–
OMXR3
384.6 381.3 389.3 404.7 399.5 413.2 412.3 410.7 427.3 452.3 468.1 452.97
447.2 446.9 451.2
1
Year-on-year changes (%).
2
Average secondary market yield of 10-year government bonds.
3
Average of the period.
4
Weighted average primary market yield of 10-year government bonds.
5
Weighted average primary market yield of 5-year government bonds.
6
Weighted average primary market yield of 3-year government bonds.
7
Data have been revised.
44
REAL SECTOR INDICATORS AND PRICES
2012 2013
Q1 Q2 Q3 Q4 Q1 Q2 Q3 Q4
Industrial output1
Increase/decrease2
(at constant
prices; working day adjusted data; %) 9.3 14.9 8.0 8.1 7.6 0.6 –1.7 –0.6 1.7 2.7
Cargoes loaded and unloaded at ports
Turnover (thousands of tons) 75 193 20 032 20 309 17 722 17 129 70 480 18 969 17 990 16 523 16 999
Increase/decrease2
(%) 9.3 22.6 12.2 7.2 –4.0 –6.3 –5.3 –11.4 –6.8 –0.8
Retail trade turnover 1, 3
Turnover (at current prices; millions of
lats)
4 273.3 946.9 1 047.7 1 147.9 1 130.8 4 407.8 984.3 1 084.1 1 177.1 1 162.3
Increase/decrease2
(at constant prices; %) 7.3 9.0 6.3 7.7 6.6 3.8 4.7 4.0 2.64
4.0
Unemployment rate (%) 10.5 11.7 11.9 11.0 10.5 9.5 10.8 9.6 9.1 9.5
Producer prices1
(increase/decrease
compared with the previous period; %) 3.7 1.6 0.5 0.8 0.4 1.5 0.3 0.4 0.3 –0.1
Consumer price inflation
Year-on-year basis (%) 2.3 3.4 2.3 1.8 1.6 0 0.3 –0.1 –0.1 –0.3
Quarter-on-quarter basis (%) x 1.1 0.9 –0.6 0.2 x –0.1 0.5 –0.6 0
Financial surplus/deficit in the consolidated general government budget
Surplus/deficit (millions of lats) 19.1 –43.9 106.3 279.0 –322.2 –90.2 31.8 133.8 95.9 –351.7
Ratio to GDP (%) 0.1 1.3 2.8 6.9 7.6 0.6 0.9 3.3 2.2 7.9
1
Data are calculated according to the revised version of the EU Statistical Classification of Economic Activities (NACE Rev. 2).
2
Year-on-year basis.
3
Sale of motor vehicles and motorcycles not included.
4
Data have been revised.
2.a
45
REAL SECTOR INDICATORS AND PRICES
2012 2013
X XI XII I II III IV V VI VII VIII IX X XI XII
Industrial output1
Increase/decrease2
(at constant prices;
working day adjusted data; %) 5.5 7.4 10.2 –0.2 1.6 –5.6 –2.7 0 0.9 4.7 –1.3 1.9 2.2 2.6 3.3
Cargoes loaded and unloaded at ports
Turnover (thousands of tons) 5 337 5 825 5 967 6 553 5 614 6 802 6 268 6 034 5 688 5 491 5 724 5 308 5 307 5 336 6 356
Increase/decrease2
(%) –9.3 0.4 –3.0 –6.4 –3.2 –6.0 –11.5 –12.7 –10.0 –7.1 –2.9 –10.3 –0.6 –8.4 6.5
Retail trade turnover 1, 3
Turnover (at current prices;
millions of lats) 373.6 350.5 406.8 330.1 310.5 343.7 338.4 374.2 371.5 396.8 401.8 378.5 381.9 361.0 419.4
Increase/decrease2
(at constant
prices; %) 6.9 4.3 8.4 4.0 4.0 5.9 3.4 6.0 2.74
3.4 2.14
2.24
2.6 5.3 4.2
Unemployment rate (%) 10.7 10.6 10.5 10.9 10.9 10.8 10.4 9.9 9.6 9.5 9.3 9.1 9.1 9.3 9.5
Producer prices1
(increase/decrease
compared with the previous period; %) 0.2 –0.2 0.2 0.3 –0.2 0.1 0.1 0.3 0.1 –0.1 0.2 0.3 0 –0.2 –0.7
Consumer price inflation
Year-on-year basis (%) 1.6 1.6 1.6 0.6 0.3 0.2 –0.4 –0.1 0.2 0.3 –0.2 –0.4 0 –0.4 –0.4
Month-on-month basis (%) 0 –0.1 0 –0.2 –0.1 0.5 0 0.1 0.2 –0.3 –0.8 0.3 0.3 –0.5 0
Annual core inflation (%) –0.5 0.1 –0.6 –0.5 –0.3 0 –0.2 –0.2 –0.1 0.2 0.4 0.5 1.2 0.4 0.6
Financial surplus/deficit in the
consolidated general government
budget (millions of lats) –63.1 –76.2 –182.9 56.8 –70.7 45.7 58.4 96.9 –21.5 32.0 53.0 10.9 6.8 –105.5 –253.0
1
Data are calculated according to the revised version of the EU Statistical Classification of Economic Activities (NACE Rev. 2).
2
Year-on-year basis.
3
Sale of motor vehicles and motorcycles not included.
4
Data have been revised.
2.b
MONETARY BASE
(at end of period; millions of lats)
2012 2013
X XI XII I II III IV V VI VII VIII IX X XI XII
Currency in circulation 1 167.7 1 179.0 1 234.1 1 147.3 1 126.3 1 134.8 1 096.7 1 080.3 1 086.8 1 054.3 1 022.5 971.0 893.5 841.8 630.8
Currency as percent of
the monetary base 50.5 48.2 46.3 46.7 43.1 44.8 43.1 41.1 40.3 40.5 39.1 37.9 34.1 32.2 20.0
Deposits with Latvijas
Banka in lats 676.4 708.9 866.3 654.0 748.7 671.3 669.9 661.0 807.9 773.5 818.7 820.5 921.4 1 027.3 1 714.3
Deposits with Latvijas
Banka in foreign
currencies 466.6 555.7 567.2 657.7 736.6 724.5 776.4 889.4 805.2 777.0 771.9 770.8 806.1 749.0 813.3
Deposits as percent of
the monetary base 49.5 51.8 53.7 53.3 56.9 55.2 56.9 58.9 59.7 59.5 60.9 62.1 65.9 67.8 80.0
M0 2 310.7 2 443.6 2 667.7 2 459.1 2 611.7 2 530.7 2 542.9 2 630.7 2 699.9 2 604.8 2 613.2 2 562.3 2 621.0 2 618.1 3 158.3
Net foreign assets 3 759.8 3 874.9 4 025.8 3 874.1 3 988.3 4 051.7 4 038.6 4 140.7 4 060.1 4 019.7 4 032.6 4 064.4 4 172.4 4 063.1 4 073.8
Loans to MFIs 0 0 0 0 0 0 0 0 0 0 0 0 0 0 10.0
Credit to central
government (net) –766.7 –792.7 –761.2 –625.4 –528.7 –606.5 –600.8 –657.8 –591.0 –581.7 –617.0 –616.6 –624.3 –492.9 –239.2
Other items (net) –682.4 –638.5 –597.0 –789.6 –847.8 –914.6 –894.9 –852.3 –769.3 –833.2 –802.5 –885.4 –927.1 –952.1 –686.2
Total 2 310.7 2 443.6 2 667.7 2 459.1 2 611.7 2 530.7 2 542.9 2 630.7 2 699.9 2 604.8 2 613.2 2 562.3 2 621.0 2 618.1 3 158.3
3.
46
MONETARY AGGREGATES AND COUNTERPARTS
(at end of period; millions of lats)
2012 2013
X XI XII I II III IV V VI VII VIII IX X XI XII
Monetary aggregates
M3 6 682.8 6 802.7 6 845.7 6 824.8 6 869.0 6 754.8 6 822.3 6 800.0 6 831.6 6 774.0 6 801.1 6 696.6 6 739.4 6 851.0 7 034.8
Repos 0 0 0 0 0 0 0 0 0 0 0 0 0 0 0
Money market fund
shares and units 66.2 66.2 62.0 64.7 64.4 63.6 62.4 62.0 61.2 57.1 55.9 54.8 53.0 51.1 46.6
Debt securities issued
with maturity of up to
2 years 50.0 72.8 77.7 77.6 96.9 120.7 130.2 130.3 152.3 149.8 153.0 150.4 172.3 176.8 154.7
M2 6 566.7 6 663.7 6 706.1 6 682.5 6 707.7 6 570.5 6 629.7 6 607.8 6 618.0 6 567.1 6 592.2 6 491.3 6 514.1 6 623.1 6 833.5
Deposits with an
agreed maturity of up
to 2 years 1 754.3 1 729.1 1 658.6 1 600.5 1 613.0 1 586.3 1 553.4 1 499.8 1 398.0 1 355.7 1 322.3 1 283.6 1 263.5 1 237.2 1 300.1
Deposits redeemable
at notice of up to
3 months 209.9 212.9 215.7 220.1 225.0 234.2 236.6 240.2 245.0 251.3 260.0 270.3 286.2 299.0 314.4
M1 4 602.5 4 721.7 4 831.7 4 862.0 4 869.6 4 750.0 4 839.7 4 867.8 4 975.0 4 960.0 5 009.9 4 937.4 4 964.4 5 086.9 5 219.0
Currency outside
MFIs
1 053.4 1 058.2 1 082.4 1 035.3 1 013.7 1 011.8 982.3 969.1 976.0 941.7 908.2 853.5 778.8 722.6 469.3
Overnight deposits 3 549.1 3 663.4 3 749.3 3 826.7 3 855.9 3 738.2 3 857.4 3 898.7 3 999.1 4 018.3 4 101.7 4 084.0 4 185.6 4 364.3 4 749.7
Counterparts of monetary aggregates and longer-term financial liabilities
Deposits of central
government 1 242.5 1 232.8 1 287.3 1 292.5 1 151.2 1 202.7 1 216.7 1 295.7 1 216.2 1 199.3 1 284.0 1 309.1 1 311.4 1 142.7 896.8
Longer-term financial
liabilities 2 583.0 2 576.2 2 585.3 2 602.8 2 631.4 2 585.7 2 605.6 2 604.4 2 600.3 2 617.6 2 629.7 2 654.5 2 674.6 2 698.3 2 679.7
Deposits with an agreed
maturity of over 2 years 246.0 247.5 250.6 255.8 258.9 267.2 262.1 257.6 255.7 254.0 247.8 242.3 243.8 232.1 223.7
Deposits redeemable at
notice of over 3 months 0 0 0 0 0 0 2.4 2.4 2.4 2.4 2.4 2.4 2.4 2.5 2.5
Debt securities issued
with maturity of over
2 years 63.5 65.9 61.9 61.5 62.5 67.1 66.0 65.2 79.9 79.8 80.4 79.7 79.6 101.4 79.9
Capital and reserves 2 273.6 2 262.8 2 272.8 2 285.6 2 310.0 2 251.4 2 275.0 2 279.2 2 262.3 2 281.3 2 299.0 2 330.1 2 348.8 2 362.4 2 373.7
Credit to residents 11 278.7 11 233.4 11 051.1 11 024.0 10 929.4 10 858.3 10 762.1 10 798.9 10 650.4 10 642.4 10 659.1 10 591.4 10 480.5 10 515.4 10 488.6
Credit to general
government 542.2 542.8 554.0 549.5 476.7 484.6 462.4 491.7 507.5 515.3 525.7 529.9 527.0 535.5 547.0
Credit to other residents 10 736.5 10 690.7 10 497.1 10 474.5 10 452.7 10 373.7 10 299.7 10 307.1 10 142.9 10 127.1 10 133.4 10 061.5 9 953.5 9 979.9 9 941.5
Loans 10 408.8 10 367.1 10 165.4 10 138.1 10 111.9 10 025.5 9 949.6 9 953.9 9 768.9 9 735.4 9 726.6 9 630.3 9 557.2 9 567.2 9 514.4
Net external assets 202.8 378.0 613.7 577.3 610.8 642.1 786.2 771.4 820.1 763.1 837.7 845.4 967.2 915.3 844.1
Other items (net) 973.0 999.7 946.4 881.2 888.7 957.2 903.7 870.2 822.5 814.6 782.0 776.6 722.3 738.7 721.3
4.
SEASONALLY ADJUSTED MONETARY AGGREGATES
(at end of period; millions of lats)
2012 2013
X XI XII I II III IV V VI VII VIII IX X XI XII
M1 4 643.4 4 720.3 4 727.4 4 841.3 4 841.4 4 790.0 4 881.8 4 915.9 4 938.2 4 949.7 5 012.8 4 976.1 5 003.6 5 093.0 5 085.0
M2 6 658.9 6 705.2 6 622.5 6 678.4 6 664.4 6 567.3 6 592.8 6 595.0 6 592.4 6 581.2 6 589.9 6 562.8 6 610.6 6 665.6 6 747.0
M3 6 778.8 6 846.0 6 768.2 6 825.3 6 824.3 6 744.6 6 784.0 6 786.3 6 803.4 6 785.2 6 794.2 6 772.8 6 842.0 6 898.9 6 956.2
5.
47
ASSETS AND LIABILITIES OF LATVIJAS BANKA
(at end of period; millions of lats)
2012 2013
X XI XII I II III IV V VI VII VIII IX X XI XII
ASSETS
Loans to residents 0 0 0 0 0 0 0 0 0 0 0 0 0 0 10.0
General government 0 0 0 0 0 0 0 0 0 0 0 0 0 0 0
Other residents 0 0 0 0 0 0 0 0 0 0 0 0 0 0 0
MFIs 0 0 0 0 0 0 0 0 0 0 0 0 0 0 10.0
Holdings of securities
other than shares issued
by residents 0 0 0 0 0 0 0 0 0 0 0 0 0 0 0
General government 0 0 0 0 0 0 0 0 0 0 0 0 0 0 0
Other residents 0 0 0 0 0 0 0 0 0 0 0 0 0 0 0
MFIs 0 0 0 0 0 0 0 0 0 0 0 0 0 0 0
Holdings of shares and
other equity issued by
residents x x x x x x x x x x x x x x x
External assets 3 786.5 3 892.9 4 053.5 3 925.7 4 046.8 4 083.1 4 078.6 4 165.9 4 107.9 4 055.8 4 056.4 4 098.9 4 198.4 4 107.3 4 098.4
Fixed assets 32.2 32.1 32.0 31.7 31.6 31.4 31.3 31.1 31.0 30.8 30.7 30.5 30.3 30.2 30.2
Remaining assets 0.7 0.8 0.9 0.8 1.1 1.1 1.0 1.0 1.0 0.9 0.9 0.9 0.8 0.8 0.7
Total 3 819.5 3 925.8 4 086.3 3 958.2 4 079.5 4 115.6 4 110.9 4 198.1 4 139.9 4 087.5 4 088.0 4 130.3 4 229.6 4 138.3 4 139.4
LIABILITIES
Currency in circulation 1 167.7 1 179.0 1 234.1 1 147.3 1 126.3 1 134.8 1 096.7 1 080.3 1 086.8 1 054.3 1 022.5 971.0 893.5 841.8 630.8
Deposits of residents 2 261.2 2 364.5 2 460.3 2 399.7 2 529.5 2 565.3 2 617.6 2 754.4 2 671.7 2 664.0 2 715.2 2 790.3 2 969.5 2 912.4 3 150.2
Central government 766.7 792.7 761.2 625.4 528.7 606.5 600.8 657.8 591.0 581.7 617.0 616.6 624.3 492.9 239.2
Other residents 32.5 11.4 10.8 11.5 21.7 10.2 11.2 19.4 18.9 20.8 10.2 12.8 15.7 25.2 10.0
MFIs 1 462.0 1 560.3 1 688.3 1 762.8 1 979.0 1 948.7 2 005.6 2 077.3 2 061.8 2 061.5 2 088.1 2 160.9 2 329.6 2 394.3 2 901.0
Debt securities issued 0 0 0 0 0 0 0 0 0 0 0 0 0 0 0
Capital and reserves 361.4 362.3 362.0 356.7 362.3 359.8 342.4 335.8 330.8 330.4 324.4 331.8 337.7 337.6 330.3
External liabilities 26.7 18.1 27.7 51.6 58.5 31.4 40.0 25.2 47.8 36.1 23.8 34.5 26.1 44.3 24.7
Remaining liabilities 2.5 1.9 2.2 2.8 2.9 24.3 14.2 2.4 2.8 2.7 2.0 2.7 2.8 2.2 3.4
Total 3 819.5 3 925.8 4 086.3 3 958.2 4 079.5 4 115.6 4 110.9 4 198.1 4 139.9 4 087.5 4 088.0 4 130.3 4 229.6 4 138.3 4 139.4
6.
48
AGGREGATED BALANCE SHEET OF MFIs (EXCLUDING LATVIJAS BANKA)
(at end of period; millions of lats)
2012 2013
X XI XII I II III IV V VI VII VIII IX X XI XII
ASSETS
Loans to residents 12 166.0 12 226.0 12 173.1 12 232.1 12 361.4 12 246.5 12 280.6 12 373.6 12 151.2 12 137.9 12 118.3 12 113.3 12 238.2 12 304.6 12 720.9
General
government 70.5 70.6 73.0 75.7 75.2 74.6 76.0 79.8 81.3 83.0 83.6 83.6 83.5 84.5 86.7
Other residents 10 408.8 10 367.1 10 165.4 10 138.1 10 111.9 10 025.5 9 949.6 9 953.9 9 768.9 9 735.4 9 726.6 9 630.3 9 557.2 9 567.2 9 514.4
MFIs 1 686.6 1 788.4 1 934.7 2 018.3 2 174.4 2 146.4 2 255.0 2 339.9 2 301.0 2 319.5 2 308.1 2 399.4 2 597.4 2 652.9 3 119.7
Holdings of
securities other than
shares issued by
residents 472.8 473.4 485.3 484.0 411.1 422.1 397.0 426.2 440.5 446.1 455.7 460.2 457.1 470.9 480.4
General
government 471.7 472.2 481.0 473.8 401.5 410.0 386.4 411.9 426.2 432.3 442.1 446.3 443.5 451.0 460.3
Other residents 0.2 0.2 4.3 10.2 9.6 12.1 10.6 14.3 14.3 13.8 13.6 13.9 13.6 19.9 20.1
MFIs 1.0 1.0 0 0 0 0 0 0 0 0 0 0 0 0 0
Money market fund
shares and units 0.4 0.4 0.4 0.4 0.4 0.4 0.4 0.4 0.4 0.4 0.4 0.4 0.4 0.4 0.4
Holdings of shares
and other equity
issued by residents 327.5 323.4 327.4 326.2 331.3 336.1 339.6 338.9 359.7 377.9 393.2 417.3 382.6 392.9 407.1
External assets 6 232.8 6 186.8 6 323.3 6 404.5 6 179.2 6 419.1 6 556.1 6 504.5 6 673.3 6 844.2 6 817.7 6 449.8 6 394.7 6 265.1 6 368.2
Fixed assets 87.1 88.4 87.2 85.1 89.6 89.8 89.9 90.4 90.4 90.8 91.4 92.0 90.0 91.8 93.7
Remaining assets 475.7 462.2 523.7 464.4 449.8 472.5 471.7 459.9 471.5 461.2 465.2 463.5 442.2 453.2 491.7
Total 19 762.2 19 760.7 19 920.5 19 996.7 19 822.8 19 986.5 20 135.3 20 194.0 20 187.0 20 358.5 20 341.9 19 996.5 20 005.2 19 978.8 20 562.3
LIABILITIES
Deposits of residents 6 426.6 6 513.2 6 635.9 6 813.7 6 748.6 6 609.8 6 766.1 6 779.5 6 746.5 6 736.5 6 811.9 6 806.3 6 917.0 7 014.1 7 464.1
Central
government 475.9 440.1 526.2 667.1 622.4 596.3 615.9 637.9 625.1 617.5 667.0 692.5 687.1 649.8 657.6
Other residents 5 726.8 5 841.5 5 863.5 5 891.4 5 931.2 5 815.8 5 900.7 5 879.3 5 881.3 5 861.0 5 924.0 5 869.9 5 965.9 6 109.9 6 580.4
MFIs 224.0 231.6 246.2 255.1 195.0 197.7 249.4 262.2 240.0 258.0 220.8 243.9 264.0 254.4 226.2
Money market fund
shares and units 66.6 66.5 62.4 65.0 64.8 64.0 62.8 62.4 61.6 57.5 56.3 55.2 53.3 51.5 47.0
Debt securities
issued 113.5 138.7 139.6 139.0 159.4 187.8 196.1 195.5 232.2 229.7 233.4 230.1 251.9 278.1 234.6
Capital and reserves 1 912.2 1 900.5 1 910.8 1 928.9 1 947.8 1 891.6 1 932.7 1 943.4 1 931.5 1 950.9 1 974.6 1 998.3 2 011.1 2 024.8 2 043.4
External liabilities 9 789.8 9 683.7 9 735.5 9 701.3 9 556.6 9 828.7 9 808.4 9 873.8 9 913.3 10 100.7 10 012.7 9 668.8 9 599.9 9 412.9 9 597.9
Remaining liabilities 1 453.6 1 458.1 1 436.4 1 348.7 1 345.6 1 404.6 1 369.1 1 339.5 1 302.0 1 283.2 1 253.0 1 237.8 1 172.0 1 197.3 1 175.4
Total 19 762.2 19 760.7 19 920.5 19 996.7 19 822.8 19 986.5 20 135.3 20 194.0 20 187.0 20 358.5 20 341.9 19 996.5 20 005.2 19 978.8 20 562.3
7.
49
CONSOLIDATED BALANCE SHEET OF MFIs
(at end of period; millions of lats)
2012 2013
X XI XII I II III IV V VI VII VIII IX X XI XII
ASSETS
Loans to residents 10 479.3 10 437.6 10 238.5 10 213.8 10 187.0 10 100.1 10 025.6 10 033.7 9 850.3 9 818.4 9 810.2 9 713.9 9 640.8 9 651.7 9 601.1
General
government 70.5 70.6 73.0 75.7 75.2 74.6 76.0 79.8 81.3 83.0 83.6 83.6 83.5 84.5 86.7
Other residents 10 408.8 10 367.1 10 165.4 10 138.1 10 111.9 10 025.5 9 949.6 9 953.9 9 768.9 9 735.4 9 726.6 9 630.3 9 557.2 9 567.2 9 514.4
Holdings of securities
other than shares
issued by other
residents 471.8 472.4 485.3 484.0 411.1 422.1 397.0 426.2 440.5 446.1 455.7 460.2 457.1 470.9 480.4
General
government 471.7 472.2 481.0 473.8 401.5 410.0 386.4 411.9 426.2 432.3 442.1 446.3 443.5 451.0 460.3
Other residents 0.2 0.2 4.3 10.2 9.6 12.1 10.6 14.3 14.3 13.8 13.6 13.9 13.6 19.9 20.1
Holdings of shares
and other equity
issued by other
residents 327.5 323.4 327.4 326.2 331.3 336.1 339.6 338.9 359.7 377.9 393.2 417.3 382.6 392.9 407.1
External assets 10 019.3 10 079.8 10 376.8 10 330.2 10 225.9 10 502.2 10 634.6 10 670.5 10 781.2 10 899.9 10 874.2 10 548.7 10 593.2 10 372.4 10 466.6
Fixed assets 119.3 120.5 119.2 116.8 121.2 121.2 121.2 121.6 121.3 121.7 122.1 122.5 120.3 121.9 123.9
Remaining assets 362.1 342.2 372.9 353.1 338.3 350.6 358.4 349.7 361.9 349.5 351.8 346.9 328.3 334.8 331.0
Total 21 779.4 21 775.9 21 920.0 21 824.2 21 614.8 21 832.3 21 876.4 21 940.6 21 914.8 22 013.5 22 007.2 21 609.5 21 522.3 21 344.6 21 410.1
LIABILITIES
Currency outside
MFIs 1 053.4 1 058.2 1 082.4 1 035.3 1 013.7 1 011.8 982.3 969.1 976.0 941.7 908.2 853.5 778.8 722.6 469.3
Deposits of central
government 1 242.5 1 232.8 1 287.3 1 292.5 1 151.2 1 202.7 1 216.7 1 295.7 1 216.2 1 199.3 1 284.0 1 309.1 1 311.4 1 142.7 896.8
Deposits of other
general government
and other residents 5 759.3 5 853.0 5 874.3 5 903.0 5 952.9 5 825.9 5 911.9 5 898.7 5 900.2 5 881.8 5 934.2 5 882.7 5 981.6 6 135.1 6 590.3
Money market fund
shares and units 66.2 66.2 62.0 64.7 64.4 63.6 62.4 62.0 61.2 57.1 55.9 54.8 53.0 51.1 46.6
Debt securities issued 112.5 137.7 139.6 139.0 159.4 187.8 196.1 195.5 232.2 229.7 233.4 230.1 251.9 278.1 234.6
Capital and reserves 2 273.6 2 262.8 2 272.8 2 285.6 2 310.0 2 251.4 2 275.0 2 279.2 2 262.3 2 281.3 2 299.0 2 330.1 2 348.8 2 362.4 2 373.7
External liabilities 9 816.5 9 701.8 9 763.1 9 752.9 9 615.1 9 860.1 9 848.4 9 899.0 9 961.1 10 136.8 10 036.5 9 703.3 9 626.0 9 457.2 9 622.5
Remaining liabilities 1 456.1 1 459.9 1 438.5 1 351.5 1 348.5 1 429.0 1 383.5 1 341.9 1 304.8 1 285.8 1 255.0 1 240.5 1 174.8 1 199.6 1 178.8
Excess of inter-MFI
liabilities –0.6 3.5 –0.1 –0.4 –0.3 0 0.1 –0.4 0.9 0 1.0 5.5 –3.9 –4.2 –2.5
Total 21 779.4 21 775.9 21 920.0 21 824.2 21 614.8 21 832.3 21 876.4 21 940.6 21 914.8 22 013.5 22 007.2 21 609.5 21 522.3 21 344.6 21 410.1
8.
50
AGGREGATED BALANCE SHEET OF MFIs (EXCLUDING LATVIJAS BANKA )
(at end of period; millions of lats)
2012 2013
X XI XII I II III IV V VI VII VIII IX X XI XII
MFI reserves 1 576.3 1 681.1 1 840.1 1 874.8 2 091.7 2 071.7 2 120.0 2 188.4 2 172.6 2 174.1 2 202.4 2 278.4 2 444.3 2 513.5 3 062.5
Vault cash in
national currency 114.3 120.8 151.8 112.0 112.7 123.0 114.4 111.2 110.8 112.6 114.3 117.5 114.7 119.2 161.4
Deposits with
Latvijas Banka 1 462.0 1 560.3 1 688.3 1 762.8 1 979.0 1 948.7 2 005.6 2 077.3 2 061.8 2 061.5 2 088.1 2 160.9 2 329.6 2 394.3 2 901.1
Foreign assets 6 232.8 6 186.8 6 323.3 6 404.5 6 179.2 6 419.1 6 556.1 6 504.5 6 673.3 6 844.2 6 817.7 6 449.8 6 394.7 6 265.1 6 368.2
Claims on the central
government 472.6 473.5 483.1 477.0 404.8 413.0 389.4 415.1 430.0 437.1 446.5 450.2 446.8 454.4 465.0
Loans 1.1 1.5 2.2 3.4 3.4 3.2 3.2 3.4 4.0 5.0 4.6 4.1 3.6 3.6 4.9
Holdings of
securities other
than shares 471.5 472.0 480.8 473.6 401.3 409.8 386.2 411.7 426.0 432.1 441.9 446.1 443.3 450.8 460.1
Claims on the local
government 69.5 69.2 71.0 72.5 71.9 71.6 73.1 76.6 77.5 78.1 79.2 79.7 80.2 81.1 82.1
Loans 69.4 69.1 70.8 72.3 71.7 71.4 72.9 76.4 77.3 78.0 79.0 79.5 80.0 80.9 81.9
Holdings of
securities other
than shares 0.2 0.2 0.2 0.2 0.2 0.2 0.2 0.2 0.2 0.2 0.2 0.2 0.2 0.2 0.2
Claims on the
financial institutions 539.8 529.3 529.1 543.7 547.9 562.2 543.0 547.9 582.3 597.1 614.1 641.0 592.0 607.9 631.9
Loans 285.4 277.1 279.5 295.4 294.5 304.4 287.6 293.3 303.3 298.6 300.6 298.2 284.9 287.4 302.8
Holdings of
securities other
than shares 0 0 0 0 0 0 0 0 0 0 0 0 0 6.6 6.8
Holdings of shares
and other equity 254.4 252.2 249.6 248.3 253.4 257.8 255.4 254.6 279.0 298.5 313.5 342.8 307.1 313.9 322.3
Claims on public
non-financial
corporations 499.5 503.2 504.5 504.1 496.2 499.2 497.0 492.2 482.5 483.0 480.9 482.6 491.6 489.9 489.4
Loans 499.5 503.2 502.0 502.2 494.9 495.8 495.1 488.9 479.3 480.1 478.2 479.7 489.1 487.7 487.1
Holdings of
securities other
than shares 0 0 2.5 1.9 1.3 3.4 1.9 3.3 3.3 2.8 2.6 2.8 2.6 2.2 2.3
Holdings of shares
and other equity 0 0 0 0 0 0 0 0 0 0 0 0 0 0 0
Claims on private
non-financial
corporations 4 979.4 4 972.2 4 830.4 4 828.3 4 833.6 4 764.1 4 735.1 4 773.5 4 615.0 4 611.5 4 625.4 4 553.1 4 521.7 4 559.4 4 568.7
Loans 4 906.2 4 900.8 4 750.8 4 742.2 4 747.5 4 677.1 4 642.3 4 678.2 4 523.4 4 521.1 4 534.6 4 467.5 4 435.1 4 469.4 4 472.9
Holdings of
securities other
than shares 0.2 0.2 1.8 8.3 8.3 8.7 8.7 11.0 11.0 11.0 11.0 11.1 11.1 11.1 11.1
Holdings of shares
and other equity 73.1 71.2 77.8 77.8 77.9 78.4 84.1 84.4 80.6 79.4 79.7 74.5 75.5 79.0 84.7
Claims on
households 4 717.7 4 686.0 4 633.1 4 598.4 4 575.0 4 548.2 4 524.6 4 493.6 4 463.0 4 435.5 4 413.1 4 384.8 4 348.2 4 322.7 4 251.6
Loans 4 717.7 4 686.0 4 633.1 4 598.4 4 575.0 4 548.2 4 524.6 4 493.6 4 463.0 4 435.5 4 413.1 4 384.8 4 348.2 4 322.7 4 251.6
Holdings of
securities other
than shares 0 0 0 0 0 0 0 0 0 0 0 0 0 0 0
Fixed assets 87.1 88.4 87.2 85.1 89.6 89.8 89.9 90.4 90.4 90.8 91.4 92.0 90.0 91.8 93.7
Other assets 361.4 341.5 372.0 352.4 337.1 349.5 357.4 348.7 360.8 348.6 350.9 346.0 327.5 333.9 330.1
Claims on resident
MFIs 224.7 228.1 246.3 255.5 195.3 197.7 249.3 262.7 239.2 258.0 220.0 238.4 267.8 258.6 218.7
Holdings of MFI
securities other than
shares 1.0 1.0 0 0 0 0 0 0 0 0 0 0 0 0 0
Money market fund
shares and units 0.4 0.4 0.4 0.4 0.4 0.4 0.4 0.4 0.4 0.4 0.4 0.4 0.4 0.4 0.4
Holdings of MFI
shares and other
equity 0 0 0 0 0 0 0 0 0 0 0 0 0 0 0
TOTAL ASSETS 19 762.2 19 760.7 19 920.5 19 996.7 19 822.8 19 986.5 20 135.3 20 194.0 20 187.0 20 358.5 20 341.9 19 996.5 20 005.2 19 978.8 20 562.3
9.a
51
AGGREGATED BALANCE SHEET OF MFIs (EXCLUDING LATVIJAS BANKA)
(at end of period; millions of lats)
2012 2013
X XI XII I II III IV V VI VII VIII IX X XI XII
Overnight deposits in
lats
1 828.4 1 903.6 2 025.7 1 964.6 1 984.1 1 935.5 1 980.9 1 984.5 2 044.1 2 068.3 2 093.8 2 111.7 2 164.7 2 266.9 2 575.2
Financial institutions 69.5 60.1 67.1 63.7 59.8 52.1 61.2 58.5 68.5 72.9 80.8 90.1 98.8 103.3 95.6
Public non-financial
corporations 107.1 125.2 121.6 126.3 143.4 144.3 144.6 142.8 154.2 147.6 134.7 146.9 125.8 143.0 135.6
Private non-financial
corporations 773.7 812.4 877.2 847.7 838.4 784.7 805.1 811.2 804.9 827.9 851.6 834.5 873.2 894.3 1 041.3
Households 878.1 905.9 959.8 926.9 942.5 954.4 970.1 972.0 1 016.4 1 019.9 1 026.7 1 040.2 1 066.8 1 126.2 1 302.7
Time deposits in lats 643.4 623.8 593.6 588.8 582.4 583.3 572.0 539.6 510.7 462.8 455.6 457.5 460.0 442.0 418.5
Financial institutions 118.8 118.1 108.3 106.4 109.7 112.4 108.2 106.5 99.4 96.6 101.0 96.4 90.7 84.0 112.0
Public non-financial
corporations 79.5 73.2 87.9 71.6 69.8 77.2 77.3 64.1 54.3 45.4 30.4 29.3 35.4 35.3 21.8
Private non-financial
corporations 77.0 76.0 70.7 83.9 79.1 77.1 77.2 66.0 67.1 38.9 46.9 55.6 57.5 50.5 25.8
Households 368.0 356.4 326.7 327.0 323.8 316.6 309.4 303.0 289.9 281.9 277.3 276.2 276.3 272.2 258.9
Deposits redeemable at
notice in lats 88.1 90.7 93.7 96.6 99.0 103.9 105.8 104.9 106.8 110.9 115.0 120.9 127.0 137.5 149.5
Financial institutions 7.4 7.4 7.3 7.4 7.3 7.2 7.3 7.2 7.2 7.1 7.2 7.2 7.3 7.3 7.3
Public non-financial
corporations 0.6 0.6 0.6 0.6 0.7 0.7 0.7 0.5 0.5 0.5 0.5 0.5 0.9 0.9 0.9
Private non-financial
corporations 5.3 5.1 5.2 5.1 5.4 8.6 8.6 6.5 5.5 5.7 6.0 6.6 5.9 9.8 10.3
Households 74.9 77.6 80.6 83.5 85.6 87.4 89.3 90.7 93.6 97.6 101.3 106.6 112.9 119.5 131.0
Repos in lats 0 0 0 0 0 0 0 0 0 0 0 0 0 0 0
Foreign currency
deposits of residents 2 949.9 3 007.9 2 980.0 3 060.5 3 084.7 3 003.2 3 032.9 3 032.7 3 017.0 3 025.2 3 064.6 2 992.1 3 037.0 3 089.1 3 299.6
Financial institutions 275.2 271.1 280.4 300.0 331.5 291.9 274.1 254.1 275.6 272.2 270.5 255.3 244.0 254.0 270.5
Public non-financial
corporations 131.0 156.8 150.2 156.9 153.9 134.1 188.1 207.0 187.6 179.6 165.3 140.9 159.8 183.8 242.6
Private non-financial
corporations 939.9 972.8 925.0 989.8 977.2 948.6 929.4 925.5 906.6 924.7 969.1 936.4 973.5 982.4 1 091.6
Households 1 603.7 1 607.2 1 624.5 1 613.8 1 622.1 1 628.7 1 641.3 1 646.1 1 647.2 1 648.8 1 659.7 1 659.5 1 659.6 1 668.9 1 694.9
Deposits of central
government 475.9 440.1 526.2 667.1 622.4 596.3 615.9 637.9 625.1 617.5 667.0 692.5 687.1 649.8 657.6
Overnight deposits in
lats 17.7 16.1 13.6 12.8 12.7 11.9 14.0 13.4 10.7 17.1 14.1 13.9 12.1 9.4 9.9
Time deposits in lats 57.0 50.7 52.6 56.1 45.7 47.6 48.7 47.5 22.8 10.3 18.8 13.8 11.8 5.5 5.0
Deposits redeemable
at notice and repos in
lats 0 0 0 0 0 0 0 0 0 0 0 0 0.5 0.8 0.8
Foreign currency
deposits 401.1 373.3 460.0 598.2 563.9 536.7 553.2 576.9 591.6 590.1 634.0 664.7 662.8 634.1 641.9
Deposits of local
government 217.0 215.6 170.5 180.9 181.0 189.9 209.0 217.7 202.8 193.7 195.0 187.7 177.3 174.4 137.6
Overnight deposits in
lats 145.0 145.4 106.6 120.7 124.7 130.7 153.0 153.9 143.8 138.1 140.5 139.7 125.4 122.9 90.6
Time deposits in lats 14.4 14.6 12.8 2.0 2.0 2.1 2.6 1.9 1.7 0.7 0.7 0.7 0.6 0.5 0.5
Deposits redeemable
at notice and repos in
lats 2.1 2.1 2.0 1.7 1.7 1.7 1.6 1.6 1.6 1.6 1.6 1.6 1.6 1.6 1.5
Foreign currency
deposits 55.5 53.5 49.1 56.5 52.6 55.3 51.9 60.3 55.7 53.3 52.2 45.7 49.7 49.5 45.0
Transit funds x x x x x x x x x x x x x x x
9.b
52
AGGREGATED BALANCE SHEET OF MFIs (EXCLUDING LATVIJAS BANKA) (CONT.)
(at end of period; millions of lats)
2012 2013
X XI XII I II III IV V VI VII VIII IX X XI XII
Foreign liabilities 9 789.8 9 683.7 9 735.5 9 701.3 9 556.6 9 828.7 9 808.4 9 873.8 9 913.3 10 100.7 10 012.7 9 668.8 9 599.9 9 412.9 9 597.9
Liabilities to Latvijas
Banka 0 0 0 0 0 0 0 0 0 0 0 0 0 0 10.0
Money market fund
shares and units 66.6 66.5 62.4 65.0 64.8 64.0 62.8 62.4 61.6 57.5 56.3 55.2 53.3 51.5 47.0
Debt securities issued 113.5 138.7 139.6 139.0 159.4 187.8 196.1 195.5 232.2 229.7 233.4 230.1 251.9 278.1 234.6
Capital and reserves 1 912.2 1 900.5 1 910.8 1 928.9 1 947.8 1 891.6 1 932.7 1 943.4 1 931.5 1 950.9 1 974.6 1 998.3 2 011.1 2 024.8 2 043.4
Residents 512.2 500.5 493.4 511.5 529.2 471.3 516.0 531.9 520.2 539.6 563.3 581.3 594.1 607.3 580.4
Retained earnings of
the reporting year 140.5 128.3 122.4 22.7 39.7 45.8 74.8 89.2 77.1 92.5 117.7 133.2 169.5 183.9 172.6
Non-residents 1 400.0 1 400.0 1 417.4 1 417.4 1 418.6 1 420.2 1 416.6 1 411.5 1 411.3 1 411.3 1 411.3 1 417.0 1 417.0 1 417.5 1 463.0
Provisions 1 126.4 1 115.3 1 053.3 1 033.4 1 027.6 1 015.3 998.8 1 006.7 967.5 956.6 929.8 876.8 846.5 837.2 791.4
Other liabilities (incl.
subordinated liabilities) 327.0 342.7 383.1 315.4 318.0 389.3 370.3 332.8 334.5 326.6 323.3 361.0 325.5 360.2 383.8
Liabilities to resident
MFIs 224.0 231.6 246.2 255.1 195.0 197.7 249.4 262.2 240.0 258.0 220.8 243.9 264.0 254.4 216.2
TOTAL LIABILITIES 19 762.2 19 760.7 19 920.5 19 996.7 19 822.8 19 986.5 20 135.3 20 194.0 20 187.0 20 358.5 20 341.9 19 996.5 20 005.2 19 978.8 20 562.3
Memo items
Trust assets 578.8 688.7 686.0 647.3 704.3 716.2 668.0 802.1 696.4 834.0 782.3 839.8 901.6 667.4 895.4
Foreign 484.7 612.1 611.5 534.5 595.3 609.0 561.1 693.2 584.6 730.5 682.0 740.6 809.0 579.1 805.7
Domestic 94.0 76.6 74.5 112.8 108.9 107.2 106.9 109.0 111.8 103.5 100.3 99.2 92.6 88.4 89.7
Trust liabilities 578.8 688.7 686.0 647.3 704.3 716.2 668.0 802.1 696.4 834.0 782.3 839.8 901.6 667.4 895.4
Foreign 523.4 633.2 636.1 597.5 653.1 664.9 616.3 750.8 645.5 783.0 732.1 789.2 852.3 612.9 840.7
Domestic 55.4 55.4 49.9 49.8 51.2 51.3 51.7 51.3 50.9 51.0 50.2 50.6 49.2 54.6 54.7
9.b
53
Net foreign
assets
Net domestic assets Total (M2X)
Credit to residents Other items (net)
General
government
(net)
Households Financial
institutions and
private
non-financial
corporations
Public
non-financial
corporations
2012
X 202.8 9 819.2 –917.3 4 717.7 5 519.3 499.5 –3 458.8 6 360.4 6 563.2
XI 378.0 9 785.1 –905.6 4 686.0 5 501.5 503.2 –3 478.8 6 306.3 6 684.2
XII 613.7 9 593.3 –903.8 4 633.1 5 359.5 504.5 –3 431.6 6 161.7 6 775.4
2013
I 577.3 9 550.6 –923.9 4 598.4 5 372.0 504.1 –3 382.0 6 168.6 6 745.8
II 610.8 9 597.3 –855.4 4 575.0 5 381.5 496.2 –3 444.3 6 153.0 6 763.9
III 642.1 9 465.7 –908.0 4 548.2 5 326.3 499.2 –3 470.1 5 995.6 6 637.7
IV 786.2 9 336.4 –963.3 4 524.6 5 278.1 497.0 –3 448.6 5 887.8 6 674.1
V 771.4 9 285.6 –1 021.6 4 493.6 5 321.4 492.2 –3 426.3 5 859.3 6 630.7
VI 820.1 9 231.3 –911.5 4 463.0 5 197.3 482.5 –3 397.0 5 834.3 6 654.5
VII 763.1 9 249.5 –877.6 4 435.5 5 208.6 483.0 –3 403.6 5 845.9 6 609.0
VIII 837.7 9 180.2 –953.3 4 413.1 5 239.5 480.9 –3 380.7 5 799.5 6 637.1
IX 845.4 9 094.6 –966.9 4 384.8 5 194.1 482.6 –3 404.4 5 690.2 6 535.6
X 967.2 8 991.8 –961.7 4 348.2 5 113.7 491.6 –3 391.6 5 600.2 6 567.4
XI 915.3 9 198.3 –781.6 4 322.7 5 167.3 489.9 –3 455.5 5 742.8 6 658.0
XII 844.1 9 454.2 –487.4 4 251.6 5 200.6 489.4 –3 386.2 6 068.0 6 912.1
MONETARY SURVEY
(at end of period; millions of lats)
Currency
outside MFIs
Overnight deposits (resident) Time deposits (resident) Total (M2X)
Households Financial
institutions and
private
non-financial
corporations
Public
non-financial
corporations
Households Financial
institutions and
private
non-financial
corporations
Public
non-financial
corporations
2012
X 1 053.4 3 327.6 1 556.8 1 600.0 170.8 2 182.3 1 367.9 666.9 147.5 6 563.2
XI 1 058.2 3 457.1 1 614.3 1 643.1 199.7 2 168.9 1 332.8 680.0 156.1 6 684.2
XII 1 082.4 3 586.6 1 712.4 1 692.3 181.9 2 106.4 1 279.1 648.9 178.4 6 775.4
2013
I 1 035.3 3 647.0 1 668.7 1 774.2 204.1 2 063.4 1 282.4 629.8 151.2 6 745.8
II 1 013.7 3 667.1 1 686.0 1 775.5 205.6 2 083.2 1 288.1 632.9 162.2 6 763.9
III 1 011.8 3 550.6 1 709.4 1 649.5 191.7 2 075.3 1 277.7 633.0 164.6 6 637.7
IV 982.3 3 650.4 1 746.0 1 712.6 191.8 2 041.3 1 264.1 558.4 218.8 6 674.1
V 969.1 3 673.9 1 762.1 1 700.8 211.0 1 987.7 1 249.6 534.7 203.4 6 630.7
VI 976.0 3 788.1 1 831.7 1 722.6 233.8 1 890.4 1 215.4 512.2 162.8 6 654.5
VII 941.7 3 823.8 1 850.1 1 750.1 223.6 1 843.5 1 198.0 495.9 149.6 6 609.0
VIII 908.2 3 906.2 1 871.2 1 833.5 201.4 1 822.8 1 193.8 499.5 129.5 6 637.1
IX 853.5 3 893.0 1 891.6 1 786.8 214.6 1 789.1 1 190.9 495.2 103.0 6 535.6
X 778.8 4 002.5 1 928.5 1 881.5 192.5 1 786.2 1 187.2 469.5 129.5 6 567.4
XI 722.6 4 174.4 2 011.1 1 929.3 234.0 1 761.1 1 175.7 456.3 129.1 6 658.0
XII 469.3 4 611.5 2 239.6 2 141.2 230.7 1 831.4 1 148.0 513.2 170.2 6 912.1
10.
54
FOREIGN ASSETS AND LIABILITIES OF MFIs (EXCLUDING LATVIJAS BANKA)
(at end of period; millions of lats)
2012 2013
X XI XII I II III IV V VI VII VIII IX X XI XII
Claims on MFIs 3 792.7 3 760.7 3 953.6 4 088.7 3 734.2 3 891.4 3 956.7 3 831.0 4 137.0 4 339.1 4 228.1 3 846.4 3 927.2 3 774.4 3 764.8
Loans
Overnight 2 326.3 2 283.4 2 332.3 2 456.9 2 190.6 2 262.4 2 180.9 2 301.4 2 519.9 2 621.7 2 305.5 2 100.3 2 195.9 2 042.7 2 170.6
Short-term 877.0 859.8 1 010.0 1 021.5 903.6 1 006.5 1 154.3 914.1 1 007.5 1 148.0 1 354.8 1 145.3 1 115.3 1 104.3 937.0
Long-term 15.2 15.3 15.1 15.0 22.1 22.5 21.6 17.1 20.4 18.1 19.7 19.4 18.6 15.3 31.0
Redeemable at notice 0 13.7 13.1 17.4 11.1 10.8 10.8 15.9 12.8 13.3 15.1 14.3 9.6 12.5 14.3
Holdings of securities other
than shares 518.7 532.9 527.4 522.1 551.0 533.4 533.3 526.5 520.2 482.4 477.5 511.2 529.6 541.1 553.4
Holdings of shares and other
equity 0.9 1.0 1.1 1.2 1.2 1.2 1.3 1.4 1.6 1.1 0.9 1.3 3.6 3.8 3.8
Other claims 54.6 54.6 54.6 54.6 54.6 54.6 54.6 54.6 54.6 54.6 54.6 54.6 54.6 54.6 54.6
Claims on non-MFIs 2 163.2 2 174.8 2 115.0 2 077.8 2 172.7 2 239.7 2 297.4 2 413.9 2 301.1 2 307.2 2 402.4 2 403.3 2 270.6 2 318.0 2 372.4
Loans
Short-term 459.1 484.3 471.2 443.8 464.9 486.0 469.1 520.7 478.5 499.2 507.7 494.1 492.9 506.1 487.2
Long-term 702.3 706.3 702.8 700.1 717.3 742.1 815.9 888.0 874.4 886.5 881.9 852.2 849.5 855.8 866.1
Holdings of securities other
than shares
Government 620.2 578.1 537.9 539.3 573.4 592.1 577.7 576.5 534.0 522.1 590.2 634.9 496.4 509.6 575.9
Private sector 320.5 342.1 337.5 324.9 347.9 351.3 366.0 360.0 343.7 330.4 348.2 348.2 358.6 369.1 368.7
Holdings of shares and other
equity 31.9 34.8 34.5 38.5 38.5 37.5 38.1 38.1 38.0 36.5 42.0 41.4 40.8 41.8 39.9
Other claims 29.3 29.3 31.1 31.1 30.6 30.6 30.6 30.6 32.5 32.4 32.4 32.4 32.4 35.6 34.5
Vault cash in foreign
currencies 76.1 70.1 76.9 72.7 70.6 63.5 72.1 67.2 66.9 67.2 61.0 64.1 61.7 65.3 71.1
Other assets
Other assets 200.7 181.2 177.8 165.3 201.7 224.6 229.9 192.4 168.3 130.7 126.2 136.1 135.3 107.4 160.0
Total foreign assets 6 232.8 6 186.8 6 323.3 6 404.5 6 179.2 6 419.1 6 556.1 6 504.5 6 673.3 6 844.2 6 817.7 6 449.8 6 394.7 6 265.1 6 368.2
Memo items
Trust assets 484.7 612.1 611.5 534.5 595.3 609.0 561.1 693.2 584.6 730.5 682.0 740.6 809.0 579.1 805.7
11.a
55
SELECTED ITEMS IN THE MONTHLY FINANCIAL POSITION REPORT OF MFIs (EXCLUDING LATVIJAS BANKA) BY
GROUP OF COUNTRIES
(at end of period; millions of lats)
Claims on MFIs Loans to non-MFIs Liabilities to MFIs Deposits by non-MFIs
EU Other
countries
and
international
institutions
EU Other
countries
and
international
institutions
EU Other
countries
and
international
institutions
EU Other
countries
and
international
institutions
incl. euro area
countries
incl. euro
area
countries
incl. euro
area countries
incl. euro area
countries
2012
X 2 389.6 1 352.6 828.9 532.8 364.6 628.7 3 261.9 1 694.2 640.2 1 745.8 619.1 3 972.8
XI 2 287.8 1 189.2 884.4 548.8 349.2 641.8 3 169.1 1 688.5 690.5 1 714.3 614.7 3 954.3
XII 2 380.9 1 225.2 989.6 549.3 351.4 624.7 3 144.9 1 705.1 683.4 1 727.4 640.3 4 024.4
2013
I 2 548.1 1 555.1 962.7 546.0 355.5 597.9 2 933.0 1 647.3 703.5 1 790.5 642.7 4 095.8
II 2 178.9 1 320.1 948.5 541.4 352.5 640.8 2 814.7 1 626.7 637.5 1 772.6 609.3 4 162.4
III 2 187.4 1 339.2 1 114.8 575.0 363.9 653.1 2 943.8 1 670.9 634.2 1 872.3 667.9 4 217.4
IV 2 267.2 1 407.9 1 100.3 652.5 428.9 632.5 2 922.7 1 688.6 619.1 1 840.2 726.4 4 234.3
V 2 161.9 1 375.4 1 086.6 752.1 455.2 656.5 2 843.6 1 695.1 612.2 1 874.3 747.8 4 297.6
VI 2 461.3 1 557.5 1 099.3 713.1 446.9 639.8 2 948.4 1 697.2 613.8 1 873.2 760.8 4 314.9
VII 2 700.4 1 663.4 1 100.7 732.1 464.2 653.7 2 932.3 1 621.3 646.3 1 976.2 889.2 4 384.5
VIII 2 667.8 1 611.7 1 027.3 743.1 472.4 646.4 2 844.9 1 589.3 613.5 2 055.2 942.5 4 358.2
IX 2 283.2 1 377.4 996.1 709.9 443.6 636.4 2 603.2 1 416.8 604.9 1 931.0 801.9 4 335.4
X 2 332.5 1 437.9 1 006.9 700.3 436.9 642.0 2 407.9 1 359.8 604.8 2 023.4 869.7 4 376.0
XI 2 178.9 1 319.6 996.0 681.6 408.3 680.3 2 355.7 1 307.4 597.3 2 038.5 909.6 4 174.0
XII 1 969.6 1 240.7 1 183.4 683.9 400.0 669.5 2 403.9 1 283.3 608.0 2 082.2 913.4 4 267.1
FOREIGN ASSETS AND LIABILITIES OF MFIs (EXCLUDING LATVIJAS BANKA)
(at end of period; millions of lats)
2012 2013
X XI XII I II III IV V VI VII VIII IX X XI XII
Liabilities to MFIs
Overnight 333.1 339.1 313.0 377.0 343.2 502.1 487.0 415.4 442.0 463.1 516.0 545.1 535.2 532.1 523.3
Short-term 545.9 511.8 552.2 372.7 345.9 373.1 389.4 409.6 503.1 636.0 528.3 502.4 363.0 365.6 546.2
Long-term 3 023.1 3 008.7 2 963.1 2 886.8 2 763.2 2 702.8 2 665.4 2 630.8 2 617.0 2 479.4 2 414.1 2 160.6 2 114.6 2 055.3 1 942.4
Redeemable at notice 0 0 0 0 0 0 0 0 0 0 0 0 0 0 0
From which liabilities to
associated and affiliated
MFIs 3 776.1 3 736.8 3 713.5 3 518.0 3 311.8 3 439.5 3 419.1 3 332.8 3 466.4 3 481.4 3 356.4 3 115.0 2 922.3 2 862.4 2 935.4
Non-MFI deposits
Overnight 4 828.4 4 799.9 4 901.9 5 095.6 5 130.7 5 290.4 5 289.6 5 415.1 5 434.2 5 598.0 5 698.9 5 551.8 5 713.1 5 611.1 5 682.3
Short-term 341.1 324.3 326.9 294.3 309.9 288.8 279.5 248.4 254.6 269.2 231.2 236.5 216.3 199.6 258.4
Long-term 452.1 457.0 441.2 421.9 421.4 455.6 439.3 445.5 442.4 440.5 422.5 411.0 407.6 335.9 347.6
Redeemable at notice 97.0 87.3 81.8 74.4 72.9 73.4 66.2 62.9 56.9 53.1 60.8 67.2 62.4 65.9 61.0
Other liabilities
Other liabilities1
169.2 155.5 155.5 178.7 169.4 142.5 192.1 246.1 163.0 161.5 140.9 194.2 187.8 247.3 236.7
Total foreign liabilities 9 789.8 9 683.7 9 735.5 9 701.3 9 556.6 9 828.7 9 808.4 9 873.8 9 913.3 10 100.7 10 012.7 9 668.8 9 599.9 9 412.9 9 597.9
Memo items
Trust liabilities 523.4 633.2 636.1 597.5 653.1 664.9 616.3 750.8 645.5 783.0 732.1 789.2 852.3 612.9 840.7
1
Including subordinated liabilities.
11.b
12.
56
MATURITY PROFILE OF DEPOSITS OF RESIDENT FINANCIAL INSTITUTIONS, NON-FINANCIAL CORPORATIONS AND
HOUSEHOLDS (IN LATS AND FOREIGN CURRENCIES)
(at end of period; millions of lats)
2012 2013
X XI XII I II III IV V VI VII VIII IX X XI XII
Overnight deposits
Amount 3 327.5 3 457.1 3 586.6 3 647.1 3 667.0 3 550.6 3 650.4 3 673.9 3 788.2 3 823.8 3 906.2 3 893.1 4 002.5 4 174.4 4 611.4
%1
60.4 61.5 63.0 63.9 63.8 63.1 64.2 64.9 66.7 67.5 68.2 68.5 69.2 70.3 71.6
Time deposits
Maturity of 1–6 months
Amount 620.2 633.0 635.5 594.6 610.4 578.9 563.1 509.0 436.8 402.0 396.8 361.2 336.2 333.8 425.9
%1
11.2 11.3 11.2 10.4 10.6 10.3 9.9 9.0 7.7 7.1 6.9 6.4 5.8 5.6 6.6
Maturity of 6–12 months
Amount 847.3 833.4 778.4 803.6 810.9 797.1 781.4 776.1 756.3 743.1 729.7 719.8 725.2 698.9 666.9
%1
15.4 14.8 13.7 14.1 14.1 14.2 13.7 13.7 13.3 13.1 12.7 12.7 12.5 11.8 10.4
Long-term
Amount 506.9 491.7 479.0 446.9 438.5 466.9 459.5 461.8 451.4 446.4 435.6 437.0 437.7 428.6 423.3
%1
9.2 8.7 8.4 7.8 7.6 8.3 8.1 8.2 8.0 7.9 7.7 7.7 7.6 7.2 6.6
Maturity of
1–2 years
Amount 260.9 244.2 228.4 191.1 179.6 199.6 197.4 204.2 195.7 192.4 187.8 194.7 194.0 196.6 199.7
%1
4.7 4.3 4.0 3.3 3.1 3.5 3.5 3.6 3.4 3.4 3.3 3.4 3.4 3.3 3.1
Maturity of over
2 years
Amount 246.0 247.5 250.6 255.8 258.9 267.2 262.1 257.6 255.7 254.0 247.8 242.3 243.8 232.0 223.6
%1
4.5 4.4 4.4 4.5 4.5 4.7 4.6 4.6 4.5 4.5 4.4 4.3 4.2 3.9 3.5
Deposits redeemable at notice
Up to 3 months
Amount 207.8 210.8 213.7 218.3 223.3 232.5 234.9 238.4 243.3 249.6 258.3 268.6 284.6 297.4 312.8
%1
3.8 3.7 3.7 3.8 3.9 4.1 4.1 4.2 4.3 4.4 4.5 4.7 4.9 5.0 4.8
Over 3 months
Amount 0 0 0 0 0 0 2.4 2.4 2.4 2.4 2.4 2.4 2.4 2.5 2.5
%1
0 0 0 0 0 0 0 0 0 0 0 0 0 0.1 0
Repos
Amount 0 0 0 0 0 0 0 0 0 0 0 0 0 0 0
%1
0 0 0 0 0 0 0 0 0 0 0 0 0 0 0
Total deposits 5 509.8 5 626.0 5 693.0 5 710.5 5 750.2 5 625.9 5 691.7 5 661.7 5 678.5 5 667.3 5 729.0 5 682.2 5 788.6 5 935.5 6 442.7
1
As percent of total deposits of resident financial institutions, non-financial corporations and households.
13.
57
OFIs and financial auxiliaries
Overnight With agreed maturity Redeemable at notice Repos In lats
Up to 1 year 1–2 years Over 2 years Up to 3 months Over 3 months
2012
X 58.5 51.1 2.6 60.3 7.4 0 0 179.9 47.6
XI 61.6 27.6 1.1 59.0 7.4 0 0 156.8 47.7
XII 64.8 26.7 1.1 59.1 7.3 0 0 159.1 44.4
2013
I 65.5 25.9 4.9 58.6 7.4 0 0 162.2 47.4
II 66.7 25.7 5.1 58.8 7.3 0 0 163.6 41.1
III 57.2 18.7 5.1 65.0 7.2 0 0 153.2 36.2
IV 68.8 19.6 4.3 65.1 7.3 0 0 165.0 44.2
V 58.8 19.6 4.4 65.2 7.2 0 0 155.2 38.1
VI 73.3 31.0 4.4 65.8 7.2 0 0 181.7 40.2
VII 56.2 60.5 1.0 65.4 7.1 0 0 190.1 32.9
VIII 78.4 61.2 1.0 61.8 7.2 0 0 209.7 44.4
IX 60.0 62.3 4.1 59.6 7.2 0 0 193.2 48.8
X 72.4 27.6 6.2 59.6 7.2 0 0 173.1 51.5
XI 85.4 28.3 6.4 60.8 7.3 0 0 188.1 57.8
XII 119.2 21.3 6.9 56.0 7.2 0 0 210.7 80.3
DEPOSITS BY FINANCIAL INSTITUTIONS (IN LATS AND FOREIGN CURRENCIES)
(at end of period; millions of lats)
Insurance corporations and pension funds
Overnight With agreed maturity Redeemable at notice Repos In lats
Up to 1 year 1–2 years Over 2 years Up to 3 months Over 3 months
2012
X 84.9 108.5 46.1 51.0 0.5 0 0 291.0 148.1
XI 82.3 117.9 47.8 51.5 0.5 0 0 300.0 138.0
XII 88.4 117.6 45.1 52.5 0.4 0 0 304.0 138.3
2013
I 113.3 105.5 43.1 53.0 0.4 0 0 315.3 130.0
II 129.7 116.7 41.7 56.3 0.4 0 0 344.8 135.7
III 111.6 88.4 52.4 57.6 0.4 0 0 310.4 135.6
IV 106.7 73.9 50.5 54.3 0.3 0 0 285.8 132.4
V 97.5 68.1 56.3 48.8 0.3 0 0 271.1 134.2
VI 106.9 61.4 52.6 47.8 0.3 0 0 269.0 135.0
VII 95.5 62.7 54.0 46.1 0.3 0 0 258.6 143.7
VIII 92.7 58.3 55.7 42.7 0.3 0 0 249.8 144.6
IX 108.8 50.8 54.5 41.4 0.3 0 0 255.7 144.8
X 119.5 50.3 52.9 44.8 0.3 0 0 267.8 145.3
XI 126.1 43.7 54.9 35.5 0.3 0 0 260.5 136.7
XII 84.5 96.7 57.7 35.5 0.3 0 0 274.8 134.6
14.a
58
Private non-financial corporations
Overnight With agreed maturity Redeemable at notice Repos In lats
Up to 1 year 1–2 years Over 2 years Up to 3 months Over 3 months
2012
X 1 456.5 278.2 20.3 24.3 16.7 0 0 1 796.0 856.0
XI 1 499.1 306.4 21.0 24.7 15.1 0 0 1 866.3 893.4
XII 1 539.1 278.5 21.0 24.7 14.8 0 0 1 878.1 953.1
2013
I 1 595.5 274.5 15.8 25.9 14.7 0 0 1 926.5 936.7
II 1 579.1 265.0 14.9 26.0 15.1 0 0 1 900.1 922.9
III 1 480.8 270.3 20.6 26.5 20.7 0 0 1 818.9 870.4
IV 1 537.1 214.8 21.1 26.7 20.6 0 0 1 820.2 890.8
V 1 544.5 193.2 25.9 27.2 18.5 0 0 1 809.2 883.6
VI 1 542.5 174.0 23.2 26.4 18.0 0 0 1 784.1 877.5
VII 1 598.4 132.9 22.5 25.7 17.8 0 0 1 797.2 872.5
VIII 1 662.3 147.0 20.8 25.3 18.1 0 0 1 873.6 904.5
IX 1 618.0 143.6 27.4 24.9 19.2 0 0 1 833.1 896.7
X 1 689.5 151.4 28.4 22.0 18.9 0 0 1 910.2 936.6
XI 1 717.8 150.3 28.3 18.9 21.7 0 0 1 937.0 954.6
XII 1 937.4 167.3 25.7 15.2 23.3 0 0 2 168.9 1 077.3
DEPOSITS BY NON-FINANCIAL CORPORATIONS (IN LATS AND FOREIGN CURRENCIES)
(at end of period; millions of lats)
Public non-financial corporations
Overnight With agreed maturity Redeemable at notice Repos In lats
Up to 1 year 1–2 years Over 2 years Up to 3 months Over 3 months
2012
X 170.8 125.0 20.3 0.1 2.1 0 0 318.2 187.2
XI 199.7 138.1 15.8 0.1 2.2 0 0 355.8 199.0
XII 181.9 162.1 15.4 0.1 0.8 0 0 360.3 210.1
2013
I 204.1 141.0 9.2 0.1 0.9 0 0 355.4 198.5
II 205.6 151.8 9.2 0.1 1.1 0 0 367.7 213.8
III 191.7 153.1 10.2 0.1 1.2 0 0 356.3 222.2
IV 191.8 207.2 10.2 0.1 1.3 0 0 410.7 222.5
V 211.0 195.9 6.1 0.1 1.3 0 0 414.4 207.4
VI 233.8 155.9 5.4 0.1 1.4 0 0 396.6 209.0
VII 223.6 138.7 8.8 0.6 1.5 0 0 373.2 193.6
VIII 201.4 121.9 5.4 0.6 1.7 0 0 331.0 165.6
IX 214.6 95.9 4.6 0.6 1.9 0 0 317.6 176.7
X 192.5 116.6 2.3 0.6 10.0 0 0 322.0 162.2
XI 234.0 116.1 2.3 0.6 10.2 0 0 363.1 179.3
XII 230.7 158.7 2.3 0.6 8.6 0 0 400.8 158.3
14.b
59
DEPOSITS BY GOVERNMENT AND NON-RESIDENTS (IN LATS AND FOREIGN CURRENCIES)
(at end of period; millions of lats)
General government Non-residents
Central
government
Local
government
In lats MFIs Non-MFIs In lats
General
government
Other
2012
X 475.9 217.0 692.8 236.2 3 902.0 5 718.6 8.2 5 710.4 9 620.7 139.1
XI 440.1 215.6 655.7 228.9 3 859.6 5 668.6 8.2 5 660.4 9 528.2 137.6
XII 526.2 170.5 696.7 187.5 3 828.2 5 751.7 10.9 5 740.9 9 580.0 162.4
2013
I 667.1 180.9 848.0 193.4 3 636.5 5 886.2 7.9 5 878.3 9 522.7 187.3
II 622.4 181.0 803.4 186.9 3 452.3 5 935.0 4.0 5 930.9 9 387.2 171.7
III 596.3 189.9 786.1 194.1 3 578.0 6 108.2 4.2 6 104.0 9 686.2 171.2
IV 615.9 209.0 825.0 219.8 3 541.8 6 074.5 4.5 6 070.0 9 616.3 136.8
V 637.9 217.7 855.6 218.4 3 455.8 6 171.9 4.0 6 167.9 9 627.7 135.8
VI 625.1 202.8 827.9 180.6 3 562.2 6 188.1 3.5 6 184.7 9 750.3 114.6
VII 617.5 193.7 811.2 167.8 3 578.5 6 360.7 3.5 6 357.3 9 939.3 131.8
VIII 667.0 195.0 862.1 175.9 3 458.4 6 413.3 3.6 6 409.7 9 871.8 134.1
IX 692.5 187.7 880.2 169.7 3 208.1 6 266.4 3.6 6 262.9 9 474.6 180.4
X 687.1 177.3 864.4 151.9 3 012.8 6 399.4 3.2 6 396.1 9 412.1 165.1
XI 649.8 174.4 824.3 140.7 2 953.0 6 212.6 3.3 6 209.2 9 165.6 162.7
XII 657.6 137.6 795.2 108.3 3 011.9 6 349.3 3.0 6 346.3 9 361.2 96.6
14.d
DEPOSITS BY HOUSEHOLDS (IN LATS AND FOREIGN CURRENCIES)
(at end of period; millions of lats)
Households
Overnight With agreed maturity Redeemable at notice Repos In lats
Up to 1 year 1–2 years Over 2 years Up to 3 months Over 3 months
2012
X 1 556.8 904.8 171.6 110.4 181.1 0 0 2 924.7 1 320.9
XI 1 614.3 876.5 158.5 112.2 185.7 0 0 2 947.1 1 339.9
XII 1 712.4 828.9 145.8 114.1 190.4 0 0 2 991.6 1 367.1
2013
I 1 668.7 851.4 118.1 118.0 194.9 0 0 2 951.1 1 337.4
II 1 686.0 862.0 108.8 117.7 199.4 0 0 2 974.0 1 351.9
III 1 709.4 845.5 111.3 117.9 202.9 0 0 2 987.1 1 358.5
IV 1 746.0 828.9 111.4 115.9 205.4 2.4 0 3 010.1 1 368.8
V 1 762.1 808.4 111.5 116.2 211.1 2.4 0 3 011.7 1 365.6
VI 1 831.7 770.9 110.2 115.5 216.3 2.4 0 3 047.1 1 399.9
VII 1 850.1 750.3 106.2 116.3 222.8 2.4 0 3 048.2 1 399.4
VIII 1 871.2 738.1 104.9 117.4 230.9 2.4 0 3 065.0 1 405.3
IX 1 891.6 728.3 104.2 115.8 240.1 2.4 0 3 082.5 1 423.0
X 1 928.5 715.7 104.2 116.8 248.1 2.4 0 3 115.6 1 456.0
XI 2 011.1 694.3 104.8 116.2 257.9 2.5 0 3 186.8 1 517.9
XII 2 239.6 648.8 107.1 116.3 273.4 2.5 0 3 387.6 1 692.7
14.c
60
LOANS TO FINANCIAL INSTITUTIONS AND NON-FINANCIAL CORPORATIONS
(at end of period; millions of lats)
Insurance corporations and
pension funds
OFIs and financial auxiliaries Public non-financial corporations Private non-financial corporations
Up to
1 year
In lats Up to
1 year
In lats Up to
1 year
1–5
years
Over
5 years
In lats Up to
1 year
1–5 years Over
5 years
In lats
2012
X 0 0 0 162.2 285.4 53.8 3.3 31.9 464.4 499.5 27.8 1 255.2 1 218.5 2 432.5 4 906.2 763.5
XI 0 0 0 144.1 277.1 59.4 3.3 30.7 469.2 503.2 30.0 1 246.9 1 239.7 2 414.2 4 900.8 777.0
XII 0 0 0 144.6 279.5 62.6 10.2 30.0 461.8 502.0 38.1 1 100.4 1 246.0 2 404.4 4 750.8 780.3
2013
I 0 0.1 0 140.7 295.3 69.0 11.1 31.6 459.4 502.2 43.2 1 115.7 1 229.2 2 397.3 4 742.2 779.2
II 0 0 0 142.8 294.5 66.9 10.8 31.1 453.0 494.9 42.4 1 155.8 1 216.3 2 375.3 4 747.5 794.2
III 0 0 0 144.9 304.4 70.9 10.3 30.4 455.1 495.8 41.6 1 094.5 1 231.4 2 351.1 4 677.1 785.8
IV 0 0 0 124.7 287.5 60.9 11.2 29.7 454.3 495.1 42.8 1 086.7 1 228.2 2 327.3 4 642.3 784.6
V 0 0 0 134.1 293.3 62.6 3.9 29.2 455.8 488.9 35.7 1 182.1 1 234.0 2 262.1 4 678.2 813.1
VI 0 0 0 148.3 303.2 63.6 4.1 28.8 446.4 479.3 35.5 1 111.7 1 276.9 2 134.8 4 523.4 706.2
VII 0 0 0 140.9 298.6 63.4 3.7 28.0 448.5 480.1 35.5 1 090.0 1 332.5 2 098.7 4 521.1 705.1
VIII 0 0 0 142.0 300.6 63.4 3.8 34.5 439.9 478.2 35.7 1 111.6 1 347.6 2 075.4 4 534.6 706.5
IX 0 0 0 134.0 298.2 63.5 4.1 34.1 441.5 479.7 35.6 1 078.9 1 355.0 2 033.6 4 467.5 698.2
X 0 0 0 118.8 284.9 59.8 2.9 35.2 450.9 489.1 36.5 1 080.9 1 345.9 2 008.3 4 435.1 693.5
XI 0 0 0 120.7 287.4 56.7 3.7 38.2 445.7 487.7 37.4 1 074.6 1 403.7 1 991.1 4 469.4 697.8
XII 0 0 0 136.3 302.7 40.1 4.3 43.3 439.5 487.1 37.5 1 093.1 1 404.3 1 975.6 4 472.9 696.8
16.a
MATURITY PROFILE OF LOANS TO RESIDENT FINANCIAL INSTITUTIONS, NON-FINANCIAL CORPORATIONS AND
HOUSEHOLDS (IN LATS AND FOREIGN CURRENCIES)
(at end of period; millions of lats)
2012 2013
X XI XII I II III IV V VI VII VIII IX X XI XII
Short-term
Amount 1 856.4 1 825.2 1 671.6 1 685.4 1 723.8 1 657.7 1 625.5 1 716.4 1 648.4 1 613.8 1 637.8 1 593.5 1 570.8 1 556.1 1 566.7
%1
17.8 17.6 16.4 16.6 17.0 16.5 16.3 17.2 16.9 16.6 16.8 16.5 16.4 16.3 16.5
Maturity of 1–5 years
Amount 1 646.2 1 695.1 1 694.7 1 692.3 1 676.3 1 692.2 1 693.7 1 671.2 1 707.6 1 764.6 1 778.3 1 785.9 1 779.2 1 824.8 1 819.8
%1
15.8 16.4 16.7 16.7 16.6 16.9 17.0 16.8 17.5 18.1 18.3 18.5 18.6 19.1 19.1
Maturity of over 5 years
Amount 6 906.2 6 846.8 6 799.1 6 760.3 6 711.8 6 675.6 6 630.4 6 566.4 6 412.9 6 357.0 6 310.5 6 250.9 6 207.2 6 186.3 6 127.9
%1
66.4 66.0 66.9 66.7 66.4 66.6 66.7 66.0 65.6 65.3 64.9 65.0 65.0 64.6 64.4
Total loans 10 408.8 10 367.1 10 165.4 10 138.1 10 111.9 10 025.5 9 949.6 9 953.9 9 768.9 9 735.4 9 726.6 9 630.3 9 557.2 9 567.2 9 514.4
1
As percent of total loans to resident financial institutions, non-financial corporations and households.
15.
61
LOANS TO HOUSEHOLDS
(at end of period; millions of lats)
Households
Consumer credit Lending for house purchase Other lending In lats
Up to
1 year
1–5 years Over
5 years
Up to
1 year
1–5 years Over
5 years
Up to
1 year
1–5 years Over
5 years
2012
X 563.7 189.9 93.7 280.0 3 806.4 176.6 146.5 3 483.3 347.6 69.2 61.6 216.8 4 717.7 499.1
XI 554.8 186.9 92.7 275.3 3 785.0 176.0 165.2 3 443.9 346.1 68.1 62.7 215.4 4 686.0 499.7
XII 546.0 183.6 90.4 272.1 3 748.9 171.1 158.7 3 419.1 338.2 61.7 63.3 213.1 4 633.1 497.5
2013
I 545.6 184.9 90.4 270.4 3 717.5 170.4 151.3 3 395.8 335.2 62.5 62.8 209.9 4 598.4 499.4
II 502.6 181.4 89.7 231.4 3 700.4 170.6 152.0 3 377.8 372.0 62.4 62.6 247.0 4 575.0 500.0
III 500.5 179.6 89.5 231.4 3 680.3 168.2 147.9 3 364.2 367.5 60.3 62.4 244.7 4 548.2 500.2
IV 498.9 179.1 90.5 229.3 3 662.1 163.6 148.6 3 349.9 363.6 60.0 62.0 241.6 4 524.6 501.1
V 391.3 169.6 88.4 133.3 3 743.7 165.8 127.8 3 450.1 358.5 60.8 59.2 238.5 4 493.6 499.2
VI 386.1 164.6 88.2 133.2 3 721.2 162.4 125.8 3 433.0 355.7 57.3 59.1 239.3 4 463.0 497.0
VII 386.1 164.3 88.9 132.9 3 697.6 158.2 124.1 3 415.2 351.8 56.7 58.6 236.6 4 435.5 498.5
VIII 383.3 161.3 89.1 132.9 3 680.4 156.6 120.5 3 403.3 349.4 62.5 52.7 234.2 4 413.1 499.0
IX 384.6 160.6 90.9 133.2 3 657.4 154.2 118.1 3 385.2 342.8 61.7 48.0 233.1 4 384.8 499.9
X 383.7 158.3 90.7 134.6 3 628.1 149.0 116.6 3 362.5 336.4 60.8 48.1 227.4 4 348.2 497.2
XI 377.3 156.5 86.1 134.8 3 609.1 146.1 114.9 3 348.0 336.3 54.5 50.4 231.4 4 322.7 493.2
XII 364.1 146.4 84.9 132.8 3 557.5 136.2 112.0 3 309.4 330.0 50.4 49.6 230.0 4 251.6 477.4
16.b
LOANS TO GOVERNMENT AND NON-RESIDENTS
(at end of period; millions of lats)
General government Non-residents
Central
government
Local
government
In lats MFIs Non-MFIs In lats
General
government
Other
2012
X 1.1 69.4 70.5 8.6 3 218.5 1 161.4 0 1 161.4 4 379.9 319.7
XI 1.5 69.1 70.6 9.3 3 172.2 1 190.6 0 1 190.6 4 362.8 298.5
XII 2.2 70.8 73.0 10.3 3 370.5 1 174.0 0 1 174.0 4 544.5 316.3
2013
I 3.4 72.3 75.7 11.6 3 510.9 1 143.9 0 1 143.9 4 654.8 275.5
II 3.4 71.7 75.2 11.3 3 127.4 1 182.2 0 1 182.2 4 309.6 270.2
III 3.2 71.4 74.6 10.6 3 302.2 1 228.2 0 1 228.2 4 530.4 296.9
IV 3.2 72.9 76.0 10.8 3 367.5 1 285.0 0 1 285.0 4 652.5 295.6
V 3.4 76.4 79.8 10.6 3 248.5 1 408.7 11.4 1 397.3 4 657.2 320.6
VI 4.0 77.3 81.3 11.0 3 560.6 1 352.9 11.4 1 341.6 4 913.5 372.7
VII 5.0 78.0 83.0 12.1 3 801.1 1 385.8 11.3 1 374.5 5 186.8 381.1
VIII 4.6 79.0 83.6 12.1 3 695.1 1 389.5 11.1 1 378.5 5 084.6 358.1
IX 4.1 79.5 83.6 12.2 3 279.3 1 346.3 11.0 1 335.3 4 625.6 345.6
X 3.6 80.0 83.5 10.2 3 339.3 1 342.3 11.0 1 331.4 4 681.7 330.3
XI 3.6 80.9 84.5 11.2 3 174.9 1 361.9 6.8 1 355.1 4 536.8 326.4
XII 4.9 81.9 86.7 12.9 3 153.0 1 353.4 6.8 1 346.6 4 506.4 362.6
16.c
62
LOANS TO FINANCIAL INSTITUTIONS AND NON-FINANCIAL CORPORATIONS IN THE NATIONAL ECONOMY
(at end of Q4 2013, millions of lats; structure, %)
With residual maturity of up to
1 year
With residual maturity of over
1 and up to 5 years
With residual maturity of over
5 years
Total loans
Amount % Of
which in
lats
% Amount % Of
which in
lats
% Amount % Of
which in
lats
% Amount % Of
which in
lats
%
1 828.8 100.0 399.6 100.0 2 589.3 100.0 264.9 100.0 844.5 100.0 136.8 100.0 5 262.6 100.0 801.3 100.0Total
A Agriculture, forestry and
fishing 102.9 5.6 29.1 7.3 182.6 7.0 52.8 19.9 60.4 7.2 23.0 16.8 345.9 6.6 104.9 13.1
B Mining and quarrying 4.2 0.2 1.0 0.2 12.0 0.5 0.5 0.2 2.3 0.3 0 0 18.6 0.3 1.5 0.2
C Manufacturing 271.1 14.8 47.8 12.0 360.6 13.9 29.2 11.0 52.5 6.2 1.8 1.3 684.3 13.0 78.8 9.8
D Electricity, gas, steam
and air conditioning
supply 72.5 4.0 7.5 1.9 221.5 8.6 24.8 9.4 79.6 9.4 2.4 1.8 373.6 7.1 34.7 4.3
E Water supply; sewerage,
waste management and
remediation activities 15.1 0.8 9.0 2.3 29.8 1.1 6.4 2.4 21.7 2.6 8.4 6.1 66.6 1.3 23.8 3.0
F Construction 66.8 3.6 18.4 4.6 104.2 4.0 8.3 3.1 165.8 19.6 36.7 26.8 336.7 6.4 63.4 7.9
G Wholesale and retail
trade; repair of motor
vehicles and motorcycles 352.2 19.3 66.1 16.5 183.4 7.1 22.6 8.5 33.4 4.0 5.0 3.7 569.0 10.8 93.7 11.7
H Transportation and
storage 62.7 3.4 5.6 1.4 193.2 7.5 16.5 6.2 111.9 13.3 1.3 1.0 367.9 7.0 23.4 2.9
I Accommodation and food
service activities 24.7 1.4 4.3 1.1 62.1 2.4 3.2 1.2 24.7 2.9 0.5 0.4 111.5 2.1 8.0 1.0
J Information and
communication 9.5 0.5 6.5 1.6 12.2 0.5 0.5 0.2 11.4 1.3 0.1 0.1 33.0 0.6 7.1 0.9
K Financial and insurance
activities 188.6 10.3 32.7 8.2 191.5 7.4 13.2 5.0 12.9 1.5 0.6 0.4 392.9 7.5 46.5 5.8
L Real estate activities 535.4 29.3 111.0 27.8 933.8 36.1 65.4 24.7 178.2 21.1 30.9 22.6 1 647.4 31.3 207.3 25.9
M Professional, scientific
and technical activities 8.2 0.4 2.5 0.6 9.9 0.4 2.5 1.0 2.8 0.3 0.2 0.2 20.9 0.4 5.2 0.6
N Administrative and
support service activities 74.3 4.1 43.6 10.9 10.7 0.4 0.5 0.2 10.8 1.3 0.6 0.4 95.8 1.8 44.7 5.6
O Public administration and
defence; compulsory
social security 0 0 0 0 1.3 0 0.3 0.1 18.8 2.2 6.3 4.6 20.1 0.4 6.6 0.8
P Education 1.5 0.1 0.4 0.1 3.1 0.1 0.1 0 0.7 0.1 0 0 5.2 0.1 0.5 0.1
Q Human health and social
work activities 5.6 0.3 2.1 0.5 10.9 0.4 1.5 0.6 2.3 0.3 1.4 1.0 18.8 0.4 5.0 0.6
R Arts, entertainment and
recreation 4.6 0.3 1.2 0.3 5.1 0.2 0.6 0.2 8.0 0.9 1.0 0.7 17.7 0.3 2.8 0.4
S Other service activities 29.0 1.6 10.8 2.7 61.5 2.4 16.0 6.1 46.3 5.5 16.6 12.1 136.8 2.6 43.4 5.4
17.
LENDING TO RESIDENT FINANCIAL INSTITUTIONS, NON-FINANCIAL CORPORATIONS AND HOUSEHOLDS
(at end of period; millions of lats)
2012 2013
XII III VI IX XII
Commercial credit 1 656.3 1 658.0 1 623.1 1 620.0 1 697.4
Industrial credit 1 759.9 1 757.2 1 715.6 1 688.4 1 608.4
Reverse repo 0.5 0.6 0.6 0.6 0.8
Financial leasing 30.9 29.8 27.4 30.5 31.3
Consumer credit 343.7 234.1 231.9 233.4 229.8
Mortgage loans 5 563.8 5 541.4 5 348.0 5 237.1 5 186.2
Factoring 1.8 1.9 2.6 2.2 2.0
Other credit 778.2 748.5 751.5 773.5 743.5
Total loans 10 135.1 9 971.6 9 700.7 9 585.7 9 499.4
1
Data have been revised.
18.
63
HOLDINGS OF SHARES AND OTHER EQUITY
(at end of period; millions of lats)
Shares and other equity
MFIs Other residents Non-residents In lats
2012
X 0.4 327.5 116.7 444.6 223.9
XI 0.4 323.4 119.6 443.4 222.9
XII 0.4 327.4 121.3 449.1 233.1
2013
I 0.4 326.2 125.4 452.0 233.0
II 0.4 331.3 124.9 456.5 237.5
III 0.4 336.1 123.9 460.4 243.8
IV 0.4 339.6 124.6 464.6 249.5
V 0.4 338.9 124.7 464.0 249.7
VI 0.4 359.7 126.6 486.7 248.0
VII 0.4 377.9 124.5 502.8 246.8
VIII 0.4 393.2 129.9 523.5 246.7
IX 0.4 417.3 129.7 547.4 241.2
X 0.4 382.6 131.4 514.4 232.7
XI 0.4 392.9 135.8 529.0 237.1
XII 0.4 407.1 132.8 540.3 207.4
19.b
HOLDINGS OF SECURITIES OTHER THAN SHARES
(at end of period; millions of lats)
Securities other than shares
MFIs General government Other residents Non-residents In lats
incl. long-term incl. long-term incl. long-term incl. long-term
2012
X 1.0 1.0 471.7 326.7 0.2 0.2 1 459.4 1 384.6 1 932.2 400.2
XI 1.0 1.0 472.2 327.4 0.2 0.2 1 453.1 1 387.9 1 926.5 398.4
XII 0 0 481.0 336.1 4.3 4.3 1 402.8 1 349.9 1 888.0 395.5
2013
I 0 0 473.8 352.7 10.2 10.2 1 386.3 1 332.1 1 870.3 380.8
II 0 0 401.5 301.2 9.6 9.6 1 472.4 1 415.8 1 883.5 296.6
III 0 0 410.0 305.1 12.1 12.1 1 476.8 1 416.8 1 898.9 303.0
IV 0 0 386.4 280.7 10.6 10.6 1 477.0 1 414.0 1 874.0 284.0
V 0 0 411.9 295.5 14.3 14.3 1 463.1 1 396.0 1 889.2 303.7
VI 0 0 426.2 310.9 14.3 14.3 1 398.0 1 338.0 1 838.4 310.5
VII 0 0 432.3 313.3 13.8 13.8 1 334.9 1 288.3 1 781.0 313.5
VIII 0 0 442.1 312.1 13.6 13.6 1 415.9 1 291.7 1 871.6 326.3
IX 0 0 446.3 310.9 13.9 13.9 1 494.3 1 296.2 1 954.5 329.8
X 0 0 443.5 311.4 13.6 13.6 1 384.7 1 286.4 1 841.8 330.5
XI 0 0 451.0 316.6 19.9 19.9 1 419.8 1 319.5 1 890.7 336.6
XII 0 0 460.3 315.2 20.1 20.1 1 498.0 1 442.7 1 978.4 345.1
19.a
64
CURRENCY BREAKDOWN OF RESIDENT DEPOSITS
(at end of period)
MFIs Non-MFIs
Outstanding
amount (all
currencies;
millions of lats)
Structure (%) Outstanding
amount (all
currencies;
millions of lats)
Structure (%)
In lats In foreign currencies In lats In foreign currencies
incl. EUR incl. USD incl. EUR incl. USD
2012
X 224.0 31.8 68.2 43.4 22.6 6 202.6 45.1 54.9 45.6 7.3
XI 231.6 31.1 68.9 36.3 30.8 6 281.7 45.3 54.7 45.1 7.3
XII 246.2 23.8 76.2 38.6 35.4 6 389.7 45.4 54.6 45.6 6.9
2013
I 255.1 18.6 81.4 39.9 39.6 6 558.5 43.4 56.6 47.6 6.9
II 195.0 21.1 78.9 49.6 26.2 6 553.6 43.5 56.5 47.7 6.8
III 197.7 24.0 76.0 46.2 27.0 6 412.1 43.9 56.1 47.5 6.6
IV 249.4 20.1 79.9 40.5 38.1 6 516.7 44.2 55.8 47.7 6.1
V 262.2 24.0 76.0 38.3 35.9 6 517.2 43.7 56.3 48.2 6.1
VI 240.0 26.7 73.3 40.6 31.0 6 506.5 43.7 56.3 48.0 6.2
VII 258.0 25.1 74.9 42.9 30.3 6 478.5 43.4 56.6 47.9 6.5
VIII 220.8 24.3 75.7 40.4 33.6 6 591.0 43.1 56.9 48.6 6.2
IX 243.9 25.0 75.0 38.1 34.9 6 562.4 43.6 56.4 48.3 6.1
X 264.0 23.5 76.5 34.9 40.0 6 653.1 43.6 56.4 48.3 6.0
XI 254.4 17.8 82.2 46.7 33.9 6 759.7 44.2 55.8 47.8 6.0
XII 226.2 16.4 83.6 47.5 35.3 7 237.9 44.9 55.1 47.2 5.9
20.a
CURRENCY BREAKDOWN OF NON-RESIDENT DEPOSITS
(at end of period)
MFIs Non-MFIs
Outstanding
amount (all
currencies;
millions of
lats)
Structure (%) Outstanding
amount (all
currencies;
millions of lats)
Structure (%)
In lats In foreign currencies In lats In foreign currencies
incl. EUR incl. USD incl. EUR incl. USD
2012
X 3 902.0 1.7 98.3 87.1 4.1 5 718.6 1.3 98.7 27.0 67.0
XI 3 859.6 1.7 98.3 87.1 3.9 5 668.6 1.3 98.7 28.0 66.1
XII 3 828.2 2.3 97.7 87.4 3.4 5 751.7 1.3 98.7 26.7 66.8
2013
I 3 636.5 3.3 96.7 85.6 3.7 5 886.2 1.2 98.8 26.5 67.4
II 3 452.3 3.2 96.8 84.7 4.5 5 935.0 1.1 98.9 27.0 67.1
III 3 578.0 2.9 97.1 85.0 4.7 6 108.2 1.1 98.9 26.6 66.9
IV 3 541.8 2.2 97.8 86.0 4.0 6 074.5 1.0 99.0 27.4 66.6
V 3 455.8 2.0 98.0 86.7 3.8 6 171.9 1.1 98.9 28.2 65.6
VI 3 562.2 1.5 98.5 88.0 3.5 6 188.1 1.0 99.0 27.3 65.9
VII 3 578.5 2.0 98.0 88.2 3.0 6 360.7 1.0 99.0 26.9 65.2
VIII 3 458.4 2.0 98.0 88.1 2.7 6 413.3 1.0 99.0 26.9 66.6
IX 3 208.1 3.7 96.3 86.0 2.5 6 266.4 1.0 99.0 27.2 66.8
X 3 012.8 3.4 96.6 86.1 2.4 6 399.4 1.0 99.0 27.5 66.6
XI 2 953.0 3.5 96.5 85.6 2.5 6 212.6 1.0 99.0 27.9 65.7
XII 3 011.9 1.4 98.6 88.2 2.6 6 349.3 0.8 99.2 27.5 66.5
20.b
65
CURRENCY BREAKDOWN OF LOANS TO NON-RESIDENTS
(at end of period)
MFIs Non-MFIs
Outstanding
amount (all
currencies;
millions of
lats)
Structure (%) Outstanding
amount (all
currencies;
millions of lats)
Structure (%)
In lats In foreign currencies In lats In foreign currencies
incl. EUR incl. USD incl. EUR incl. USD
2012
X 3 218.5 9.3 90.7 33.5 49.5 1 161.4 1.8 98.2 31.9 63.6
XI 3 172.2 8.8 91.2 33.1 50.9 1 190.6 1.7 98.3 31.2 64.2
XII 3 370.5 8.8 91.2 34.1 49.6 1 174.0 1.7 98.3 30.7 64.8
2013
I 3 510.9 7.3 92.7 36.2 50.0 1 143.9 1.8 98.2 32.1 62.8
II 3 127.4 8.1 91.9 35.4 48.4 1 182.2 1.3 98.7 31.2 64.2
III 3 302.2 8.5 91.5 30.2 53.6 1 228.2 1.3 98.7 30.8 64.6
IV 3 367.5 8.3 91.7 33.2 50.9 1 285.0 1.3 98.7 35.9 60.1
V 3 248.5 9.4 90.6 29.8 52.7 1 408.7 1.1 98.9 39.6 56.4
VI 3 560.6 10.0 90.0 29.6 53.0 1 352.9 1.2 98.8 39.6 57.4
VII 3 801.1 10.0 90.0 26.5 55.9 1 385.8 0.2 99.8 39.3 58.4
VIII 3 695.1 9.6 90.4 26.5 56.8 1 389.5 0.1 99.9 38.7 59.3
IX 3 279.3 10.4 89.6 21.6 59.1 1 346.3 0.3 99.7 37.5 60.1
X 3 339.3 9.8 90.2 19.7 62.4 1 342.3 0.1 99.9 37.8 59.8
XI 3 174.9 10.2 89.8 20.0 61.3 1 361.9 0.1 99.9 35.4 62.0
XII 3 153.0 11.3 88.7 16.4 64.1 1 353.4 0.4 99.6 35.1 62.3
20.d
CURRENCY BREAKDOWN OF LOANS TO RESIDENTS
(at end of period)
Non-MFIs
Outstanding amount (all
currencies; millions of lats)
Structure (%)
In lats In foreign currencies
incl. EUR incl. USD
2012
X 10 479.3 12.9 87.1 82.3 2.0
XI 10 437.6 13.2 86.8 82.0 2.1
XII 10 238.5 13.6 86.4 81.5 2.2
2013
I 10 213.8 13.7 86.3 81.4 2.2
II 10 187.0 13.9 86.1 81.1 2.3
III 10 100.1 13.9 86.1 80.9 2.4
IV 10 025.6 14.0 86.0 81.0 2.3
V 10 033.7 14.2 85.8 80.9 2.2
VI 9 850.3 13.3 86.7 81.8 2.3
VII 9 818.4 13.4 86.6 81.7 2.3
VIII 9 810.2 13.4 86.6 81.7 2.3
IX 9 713.9 13.5 86.5 81.7 2.2
X 9 640.8 13.5 86.5 81.6 2.3
XI 9 651.7 13.4 86.6 81.6 2.3
XII 9 601.1 13.2 86.8 82.0 2.3
20.c
66
CURRENCY BREAKDOWN OF HOLDINGS OF RESIDENT SECURITIES OTHER THAN SHARES
(at end of period)
MFIs Non-MFIs
Outstanding
amount (all
currencies;
millions of
lats)
Structure (%) Outstanding
amount (all
currencies;
millions of
lats)
Structure (%)
In lats In foreign currencies In lats In foreign currencies
incl. EUR incl. USD incl. EUR incl. USD
2012
X 1.0 0 100.0 100.0 0 471.8 84.8 15.2 8.0 7.2
XI 1.0 0 100.0 100.0 0 472.4 84.3 15.7 8.4 7.3
XII 0 0 0 0 0 485.3 81.5 18.5 9.6 8.9
2013
I 0 0 0 0 0 484.0 78.7 21.3 12.6 8.7
II 0 0 0 0 0 411.1 72.2 27.8 16.8 11.0
III 0 0 0 0 0 422.1 71.8 28.2 16.9 11.3
IV 0 0 0 0 0 397.0 71.5 28.5 16.9 11.6
V 0 0 0 0 0 426.2 71.3 28.7 17.9 10.8
VI 0 0 0 0 0 440.5 70.5 29.5 18.6 10.9
VII 0 0 0 0 0 446.1 70.3 29.7 18.8 10.9
VIII 0 0 0 0 0 455.7 71.6 28.4 17.5 10.9
IX 0 0 0 0 0 460.2 71.7 28.3 17.5 10.8
X 0 0 0 0 0 457.1 72.3 27.7 17.0 10.7
XI 0 0 0 0 0 470.9 71.5 28.5 16.7 10.6
XII 0 0 0 0 0 480.4 71.8 28.2 16.4 10.5
20.e
CURRENCY BREAKDOWN OF HOLDINGS OF NON-RESIDENT SECURITIES OTHER THAN SHARES
(at end of period)
MFIs Non-MFIs
Outstanding
amount (all
currencies;
millions of
lats)
Structure (%) Outstanding
amount (all
currencies;
millions of lats)
Structure (%)
In lats In foreign currencies In lats In foreign currencies
incl. EUR incl. USD incl. EUR incl. USD
2012
X 518.7 0 100.0 26.7 72.1 940.6 0 100.0 18.5 79.2
XI 532.9 0 100.0 26.8 71.5 920.2 0 100.0 19.6 78.0
XII 527.4 0 100.0 25.7 72.7 875.3 0 100.0 18.6 78.9
2013
I 522.1 0 100.0 25.7 72.7 864.2 0 100.0 18.8 78.6
II 551.0 0 100.0 23.9 74.7 921.4 0 100.0 17.7 79.8
III 533.4 0 100.0 22.1 76.9 943.4 0 100.0 16.3 81.4
IV 533.3 0 100.0 23.0 75.8 943.7 0 100.0 14.7 82.2
V 526.5 0 100.0 23.7 74.7 936.5 0 100.0 14.1 82.6
VI 520.2 0 100.0 24.6 73.6 877.7 0 100.0 14.9 81.8
VII 482.4 0 100.0 23.2 74.8 852.5 0 100.0 16.3 80.0
VIII 477.5 0 100.0 23.0 75.0 938.4 0 100.0 15.6 80.8
IX 511.2 0 100.0 25.5 72.7 983.1 0 100.0 13.7 82.9
X 529.6 0 100.0 27.1 70.6 855.1 0 100.0 15.6 80.0
XI 541.1 0 100.0 26.6 70.4 878.7 0 100.0 16.7 79.9
XII 553.4 0 100.0 27.6 69.6 944.5 0 100.0 16.5 80.6
20.f
67
CURRENCY BREAKDOWN OF DEBT SECURITIES ISSUED BY MFIs
(at end of period)
Outstanding amount (all currencies; millions of lats) Structure (%)
In lats In foreign currencies
2012
X 113.5 0 100.0
XI 138.7 0 100.0
XII 139.6 0 100.0
2013
I 139.0 0 100.0
II 159.4 0 100.0
III 187.8 0 100.0
IV 196.1 0 100.0
V 195.5 0 100.0
VI 232.2 0 100.0
VII 229.7 0 100.0
VIII 233.4 0 100.0
IX 230.1 0 100.0
X 251.9 0 100.0
XI 278.1 0 100.0
XII 234.6 0 100.0
20.g
1
End-of-period.
2
For this instrument category, households and non-financial corporations are merged and allocated to the household sector.
WEIGHTED AVERAGE INTEREST RATES CHARGED BY MFIs IN TRANSACTIONS WITH RESIDENT NON-FINANCIAL
CORPORATIONS AND HOUSEHOLDS IN LATS
(%)
21.a
1. Interest rates on deposits (new business)
2012 2013
X XI XII I II III IV V VI VII VIII IX X XI XII
Deposits from households
Overnight1
0.14 0.13 0.12 0.12 0.12 0.09 0.09 0.09 0.08 0.08 0.08 0.08 0.08 0.08 0.09
With agreed maturity
Up to 1 year 0.88 0.62 1.10 1.09 0.65 0.62 0.66 0.69 0.62 0.69 0.49 0.40 0.41 0.47 0.67
Over 1 and up to 2 years 1.81 1.64 1.25 1.60 1.15 0.94 1.17 0.96 0.80 0.91 0.79 0.83 0.89 0.98 1.23
Over 2 years 3.67 3.70 3.80 3.92 1.99 1.69 2.09 2.11 1.50 1.56 0.95 1.02 1.45 0.70 0.83
Redeemable at notice2
Up to 3 months 0.13 0.13 0.13 0.13 0.13 0.14 0.13 0.13 0.13 0.13 0.13 0.13 0.13 0.13 0.13
Over 3 months – – – – x – – – – – – – – – –
Deposits from non-financial corporations
Overnight1
0.05 0.05 0.04 0.05 0.04 0.04 0.04 0.04 0.04 0.04 0.03 0.03 0.03 0.04 0.03
With agreed maturity
Up to 1 year 0.10 0.08 0.12 0.12 0.06 0.09 0.06 0.06 0.05 0.04 0.04 0.06 0.05 0.03 0.04
Over 1 and up to 2 years 1.36 0.92 1.05 0.97 0.90 0.90 1.64 0.76 x 1.12 0.35 0.53 x 1.01 0.65
Over 2 years 1.26 1.61 1.06 1.45 x 0.80 0.80 0.52 1.26 0.61 0.63 x 0.44 0.74 0.55
Repos – – – – – – – – – – – – – – –
68
WEIGHTED AVERAGE INTEREST RATES CHARGED BY MFIs IN TRANSACTIONS WITH RESIDENT NON-FINANCIAL
CORPORATIONS AND HOUSEHOLDS IN LATS (CONT.)
(%)
21.a
2. Interest rates on deposits (outstanding amounts)
2012 2013
X XI XII I II III IV V VI VII VIII IX X XI XII
Households
Overnight1
0.14 0.13 0.12 0.12 0.12 0.09 0.09 0.09 0.08 0.08 0.08 0.08 0.08 0.08 0.09
With agreed maturity
Up to 2 years 1.86 1.79 1.49 1.35 1.32 1.29 1.24 1.21 1.17 1.11 1.07 1.04 1.01 0.98 0.89
Over 2 years 4.57 4.50 4.36 4.27 4.26 4.13 4.08 3.99 3.95 3.89 3.77 3.81 3.75 3.63 3.51
Redeemable at notice2
Up to 3 months 0.13 0.13 0.13 0.13 0.13 0.14 0.13 0.13 0.13 0.13 0.13 0.13 0.13 0.13 0.13
Over 3 months – – – – x – – – – – – – – – –
Non-financial corporations
Overnight1
0.05 0.05 0.04 0.05 0.04 0.04 0.04 0.04 0.04 0.04 0.03 0.03 0.03 0.04 0.03
With agreed maturity
Up to 2 years 0.97 0.91 0.83 0.78 0.72 0.69 0.66 0.63 0.63 0.77 0.60 0.55 0.47 0.46 0.54
Over 2 years 2.26 2.24 2.17 2.13 2.16 2.31 2.29 2.27 2.26 2.25 2.08 2.06 2.00 2.02 1.65
Repos – – – – – – – – – – – – – – –
1
End-of-period.
2
For this instrument category, households and non-financial corporations are merged and allocated to the household sector.
69
WEIGHTED AVERAGE INTEREST RATES CHARGED BY MFIs IN TRANSACTIONS WITH RESIDENT NON-FINANCIAL
CORPORATIONS AND HOUSEHOLDS IN LATS (CONT.)
(%)
21.a
1
End-of-period.
2
The annual percentage rate of charge covers the total cost of a loan. The total cost comprises an interest rate component and a component of other (related) charges, such as the cost of
inquiries, administration, preparation of documents, guarantees, etc.
3. Interest rates on loans to households (new business)
2012 2013
X XI XII I II III IV V VI VII VIII IX X XI XII
Bank overdraft1
– – – – – – – – – – – – – – –
Revolving loans and overdraft1
22.61 22.56 22.55 22.65 22.67 22.91 22.90 22.62 22.72 22.82 22.90 23.02 22.84 22.89 22.73
Extended credit card credit1
23.09 23.08 23.07 23.00 22.99 22.99 22.95 22.94 22.94 22.93 22.99 22.97 23.09 23.09 23.07
Lending for house purchase
By initial rate fixation
Floating rate and up to 1 year 2.88 2.84 2.94 3.06 2.83 3.26 3.55 3.10 3.24 3.19 3.16 3.30 3.39 3.71 3.29
of wich with collateral or
guarantees 2.88 2.81 2.99 3.02 2.82 3.15 3.51 3.04 3.22 3.18 3.12 3.25 3.36 3.53 3.20
Over 1 and up to 5 years 6.95 9.66 13.15 14.22 6.61 16.90 11.37 12.26 15.16 15.46 15.08 17.51 14.91 19.48 21.40
of wich with collateral or
guarantees 5.55 7.27 x 9.14 8.46 12.66 8.55 10.06 12.44 10.31 10.16 11.18 8.28 x x
Over 5 and up to 10 years 7.28 x x 6.52 x 4.75 4.53 x 6.98 x 7.25 x x x x
of wich with collateral or
guarantees 7.28 x x 6.92 x 4.54 4.33 x x x x x x x x
Over 10 years x 4.57 4.95 x x x x x x x 5.48 x x 6.28 x
of wich with collateral or
guarantees x 4.02 4.52 x x x x x x x 5.48 x x 6.28 x
Annual percentage rate of charge2
3.20 3.23 3.25 3.90 3.26 4.17 4.04 3.68 3.86 3.68 3.99 4.26 4.42 5.14 4.08
Consumer credit
By initial rate fixation
Floating rate and up to 1 year 19.59 20.40 20.21 16.71 21.69 22.23 21.45 23.06 22.71 22.60 21.72 20.17 21.82 23.04 23.21
of wich with collateral or
guarantees 4.76 4.54 3.52 4.92 4.81 4.94 4.08 5.20 5.68 5.05 5.66 5.03 5.25 5.43 8.83
Over 1 year 14.31 16.12 13.84 6.19 18.34 19.28 18.55 18.87 18.47 7.48 18.47 17.08 16.89 16.38 18.16
of wich with collateral or
guarantees 5.02 7.28 5.28 1.25 8.57 12.01 11.74 13.78 10.72 1.33 9.91 6.73 7.73 9.98 8.71
Annual percentage rate of charge2
21.84 21.31 22.05 19.30 22.41 23.12 22.80 22.87 22.84 20.77 22.55 22.47 22.28 22.77 23.04
Other lending by initial rate fixation
Floating rate and up to 1 year 6.15 7.26 6.87 5.28 5.48 5.69 6.10 6.12 4.97 7.01 5.44 5.14 6.17 5.35 5.84
Over 1 year x 14.50 11.91 14.50 x x x x x x x x x x x
70
WEIGHTED AVERAGE INTEREST RATES CHARGED BY MFIs IN TRANSACTIONS WITH RESIDENT NON-FINANCIAL
CORPORATIONS AND HOUSEHOLDS IN LATS (CONT.)
(%)
21.a
4. Interest rates on loans to non-financial corporations (new business)
2012 2013
X XI XII I II III IV V VI VII VIII IX X XI XII
Bank overdraft1
– – – – – – – – – – – – – – –
Revolving loans and overdraft1
2.67 2.60 2.43 2.43 2.43 2.50 2.49 2.35 2.38 2.33 2.29 2.25 2.24 2.26 2.13
Extended credit card credit1
24.36 24.29 24.55 24.97 25.25 25.97 25.34 24.38 24.43 24.47 25.11 24.41 24.34 25.28 23.63
Other loans up to 0.25 million euro by initial rate fixation
Floating rate and up to 1 year 4.34 4.58 4.81 4.57 4.70 4.89 4.18 4.68 4.67 4.23 4.34 4.40 4.67 4.76 4.23
of wich with collateral or
guarantees 4.14 4.38 4.66 4.50 4.52 4.79 4.10 4.70 4.63 4.38 4.29 4.36 4.69 4.63 4.09
Over 1 year x x 5.35 5.21 5.07 x 5.04 4.39 3.03 4.50 4.95 x 5.39 5.34 5.48
of wich with collateral or
guarantees x x 5.59 4.82 5.88 x 5.06 4.39 3.03 5.15 4.95 x x x x
Other loans over 0.25 million euro and up to 1 million euro by initial rate fixation
Floating rate and up to 1 year 4.86 3.41 3.46 4.91 4.74 4.43 4.43 3.86 3.99 3.34 7.15 4.18 4.21 4.09 5.46
of wich with collateral or
guarantees 4.69 3.41 3.39 4.98 4.96 4.50 4.41 3.87 3.78 x 4.57 4.28 3.95 x 5.79
Over 1 year x x x x x – – x – 3.51 x x x x x
of wich with collateral or
guarantees x x x x x – – x – x x x x x x
Other loans over 1 million euro by initial rate fixation
Floating rate and up to 1 year x x 6.08 – 4.09 4.62 4.57 4.76 x x 5.25 x 2.35 x x
of wich with collateral or
guarantees x x x – x 4.62 x 4.76 x x 5.25 x x x x
Over 1 year – x x x – x – – x – x x x – x
of wich with collateral or
guarantees – – – x – x – – x – x x – – x
1
End-of-period.
71
WEIGHTED AVERAGE INTEREST RATES CHARGED BY MFIs IN TRANSACTIONS WITH RESIDENT NON-FINANCIAL
CORPORATIONS AND HOUSEHOLDS IN LATS (CONT.)
(%)
21.a
1
Including revolving loans, overdrafts, and extended and convenience credit card credit.
2
Including bank overdraft.
1
End-of-period.
2
For this instrument category, households and non-financial corporations are merged and allocated to the household sector.
WEIGHTED AVERAGE INTEREST RATES CHARGED BY MFIs IN TRANSACTIONS WITH RESIDENT NON-FINANCIAL
CORPORATIONS AND HOUSEHOLDS IN EURO
(%)
21.b
5. Interest rates on loans (outstanding amounts)
2012 2013
X XI XII I II III IV V VI VII VIII IX X XI XII
Loans to households
Lending for house purchase, with
maturity
Up to 1 year 5.76 5.94 6.20 6.28 5.86 5.49 6.02 7.72 7.42 7.81 7.56 6.87 8.01 8.14 8.67
Over 1 and up to 5 years 4.72 4.94 4.96 4.98 4.96 4.92 4.88 4.80 4.78 4.77 4.86 4.93 5.02 5.14 5.15
Over 5 years 3.68 3.52 3.46 3.42 3.38 3.32 3.29 3.26 3.23 3.17 3.12 3.07 3.06 3.03 3.03
Consumer credit and other loans,
with maturity1
Up to 1 year2
23.15 23.11 23.20 23.18 23.13 23.04 23.21 23.28 23.05 23.15 23.20 23.21 23.24 23.33 23.32
Over 1 and up to 5 years 17.31 17.26 17.29 17.26 17.22 17.40 17.34 17.57 17.52 17.54 17.60 17.69 17.77 17.80 17.82
Over 5 years 8.12 8.01 7.80 8.34 8.22 8.12 8.04 8.13 7.88 7.98 7.94 7.81 7.76 7.69 7.62
Loans to non-financial corporations
With maturity1
Up to 1 year2
3.12 2.99 2.85 2.81 2.80 2.85 2.78 2.73 2.74 2.71 2.73 2.70 2.68 2.62 2.46
Over 1 and up to 5 years 4.12 4.06 4.11 4.05 4.05 4.02 3.96 3.98 3.96 3.87 3.74 3.65 3.62 3.58 3.54
Over 5 years 3.79 3.75 3.84 3.78 3.74 3.74 3.76 3.76 3.00 3.05 3.02 3.01 3.02 3.04 3.04
1. Interest rates on deposits (new business)
2012 2013
X XI XII I II III IV V VI VII VIII IX X XI XII
Deposits from households
Overnight1
0.14 0.13 0.12 0.12 0.12 0.12 0.12 0.12 0.11 0.11 0.11 0.11 0.12 0.11 0.12
With agreed maturity
Up to 1 year 0.43 0.34 0.68 0.72 0.31 0.41 0.45 0.35 0.36 0.41 0.26 0.31 0.40 0.36 0.54
Over 1 and up to 2 years 2.09 1.63 1.95 2.33 1.54 1.19 1.20 1.28 0.85 0.93 0.96 0.89 1.36 1.73 1.32
Over 2 years 3.85 3.92 3.48 3.55 1.29 2.23 2.56 2.33 2.44 2.28 5.52 1.41 1.21 1.59 1.62
Redeemable at notice2
Up to 3 months 0.21 0.20 0.20 0.20 0.20 0.16 0.15 0.15 0.15 0.15 0.15 0.15 0.16 0.16 0.16
Over 3 months – – – – x – x x x x x x x x x
Deposits from non-financial corporations
Overnight1
0.08 0.07 0.08 0.06 0.05 0.05 0.05 0.06 0.06 0.05 0.05 0.07 0.08 0.07 0.08
With agreed maturity
Up to 1 year 0.24 0.14 0.14 0.17 0.16 0.16 0.17 0.14 0.14 0.12 0.08 0.14 0.16 0.19 0.26
Over 1 and up to 2 years 1.19 0.62 0.89 x 0.99 1.09 0.98 0.72 x 0.77 0.83 0.62 1.31 0.66 1.36
Over 2 years x – x 4.70 2.17 x 0.72 x x 0.35 2.69 0.06 x 1.09 0.98
Repos – – – – – – – – – – – – – – –
72
WEIGHTED AVERAGE INTEREST RATES CHARGED BY MFIs IN TRANSACTIONS WITH RESIDENT NON-FINANCIAL
CORPORATIONS AND HOUSEHOLDS IN EURO (CONT.)
(%)
21.b
1
End-of-period.
2
For this instrument category, households and non-financial corporations are merged and allocated to the household sector.
2. Interest rates on deposits (outstanding amounts)
2012 2013
X XI XII I II III IV V VI VII VIII IX X XI XII
Deposits from households
Overnight1
0.14 0.13 0.12 0.12 0.12 0.12 0.12 0.12 0.11 0.11 0.11 0.11 0.12 0.11 0.12
With agreed maturity
Up to 2 years 2.01 1.91 1.61 1.39 1.32 1.27 1.20 1.16 1.10 1.02 0.99 0.97 0.96 0.94 0.91
Over 2 years 4.62 4.56 4.36 4.15 4.14 4.12 4.05 4.01 4.00 3.94 3.90 3.90 3.88 3.84 3.81
Redeemable at notice2
Up to 3 months 0.21 0.20 0.20 0.20 0.20 0.16 0.15 0.15 0.15 0.15 0.15 0.15 0.16 0.16 0.16
Over 3 months – – – – x – x x x x x x x x x
Deposits from non-financial corporations
Overnight1
0.08 0.07 0.08 0.06 0.05 0.05 0.05 0.06 0.06 0.05 0.05 0.07 0.08 0.07 0.08
With agreed maturity
Up to 2 years 1.04 0.85 0.75 0.64 0.59 0.56 0.51 0.50 0.52 0.49 0.48 0.54 0.53 0.51 0.46
Over 2 years 2.73 2.69 2.67 2.47 2.43 2.41 2.41 2.64 2.62 2.54 2.55 2.54 2.36 2.39 2.14
Repos – – – – – – – – – – – – – – –
73
1
End-of-period.
2
The annual percentage rate of charge covers the total cost of a loan. The total cost comprises an interest rate component and a component of other (related) charges, such as the cost of
inquiries, administration, preparation of documents, guarantees, etc.
WEIGHTED AVERAGE INTEREST RATES CHARGED BY MFIs IN TRANSACTIONS WITH RESIDENT NON-FINANCIAL
CORPORATIONS AND HOUSEHOLDS IN EURO (CONT.)
(%)
21.b
3. Interest rates on loans to households (new business)
2012 2013
X XI XII I II III IV V VI VII VIII IX X XI XII
Bank overdraft1
– – – – – – – – – – – – – – –
Revolving loans and overdraft1
4.47 4.48 4.61 4.79 4.91 4.97 5.00 5.00 4.98 4.99 4.97 5.88 4.72 4.75 4.89
Extended credit card credit1
23.81 23.93 23.84 23.56 23.96 23.65 24.33 23.56 23.67 23.37 23.15 23.14 23.55 22.89 22.83
Lending for house purchase
By initial rate fixation
Floating rate and up to 1 year 3.09 2.94 3.26 3.39 3.24 3.49 3.25 3.27 3.21 3.31 3.19 3.05 2.97 3.34 3.08
of wich with collateral or
guarantees 3.06 2.91 3.22 3.36 3.25 3.25 3.19 3.16 3.14 3.35 3.05 2.99 2.90 3.33 3.07
Over 1 and up to 5 years 5.11 5.15 4.77 3.64 4.30 4.63 4.28 5.09 4.12 4.94 5.71 5.54 6.76 5.83 4.77
of wich with collateral or
guarantees 5.06 5.13 4.76 3.62 4.16 4.59 4.23 4.98 3.93 4.76 5.50 5.40 6.74 5.76 4.77
Over 5 and up to 10 years 7.03 6.49 x x x 7.38 6.03 6.55 7.32 x 6.48 x x x x
of wich with collateral or
guarantees 7.06 x x x x 7.58 5.80 6.55 7.32 x x x x x x
Over 10 years x x 5.93 x x x x 6.00 5.37 x x 5.86 5.96 5.36 5.91
of wich with collateral or
guarantees x x 5.90 x x x x 5.94 x x x 6.10 6.27 5.20 5.97
Annual percentage rate of charge2
3.41 3.20 3.48 3.63 3.96 3.92 3.43 3.51 3.39 3.48 3.40 3.38 3.34 3.54 3.35
Consumer credit
By initial rate fixation
Floating rate and up to 1 year 6.82 7.57 6.51 7.73 7.09 7.55 7.22 12.60 15.26 15.14 18.32 12.27 12.74 14.05 14.71
of wich with collateral or
guarantees x x 4.22 x x x x 5.05 x x x 3.67 4.24 5.45 4.30
Over 1 year 18.29 17.55 18.35 23.55 22.80 22.81 23.20 23.90 24.76 26.27 24.52 24.27 21.61 23.18 25.36
of wich with collateral or
guarantees 8.19 7.78 8.67 11.79 9.95 9.81 13.56 11.50 12.57 16.19 10.53 13.71 12.77 11.50 13.74
Annual percentage rate of charge2
17.78 18.65 18.30 21.82 19.34 20.74 21.49 29.02 28.05 30.14 31.29 26.16 25.45 27.13 31.11
Other lending by initial rate fixation
Floating rate and up to 1 year 4.53 4.16 4.89 3.74 5.07 5.04 5.73 4.73 5.16 4.55 4.78 3.52 4.03 4.95 5.99
Over 1 year 6.67 x 4.16 x x x x x x x x x x x x
74
WEIGHTED AVERAGE INTEREST RATES CHARGED BY MFIs IN TRANSACTIONS WITH RESIDENT NON-FINANCIAL
CORPORATIONS AND HOUSEHOLDS IN EURO (CONT.)
(%)
21.b
1
End-of-period.
4. Interest rates on loans to non-financial corporations (new business)
2012 2013
X XI XII I II III IV V VI VII VIII IX X XI XII
Bank overdraft1
– – – – – – – – – – – – – – –
Revolving loans and overdraft¹ 3.71 4.28 3.42 3.37 3.52 3.52 3.51 3.48 3.43 3.27 3.24 3.72 3.25 3.33 3.24
Extended credit card credit¹ 24.62 23.42 23.74 23.47 23.77 23.66 24.14 23.43 17.15 23.14 24.47 24.08 24.28 24.41 24.01
Other loans up to 0.25 million euro by initial rate fixation
Floating rate and up to 1 year 3.97 3.93 3.96 3.83 4.32 4.27 3.75 3.85 4.31 5.45 4.17 4.39 5.34 4.07 4.23
of wich with collateral or
guarantees 3.83 3.90 3.98 3.81 4.22 4.23 3.71 3.81 4.30 5.44 4.31 4.25 3.86 4.02 4.23
Over 1 year 4.39 x 3.88 3.61 4.18 7.91 4.66 4.82 x 3.72 4.15 3.83 5.21 5.39 4.32
of wich with collateral or
guarantees 4.39 x 7.63 3.61 x x 4.55 4.82 x 4.98 3.68 4.97 5.04 6.17 5.30
Other loans over 0.25 million euro and up to 1 million euro by initial rate fixation
Floating rate and up to 1 year 3.57 3.77 3.99 4.28 4.27 4.17 4.43 3.66 4.00 4.76 4.04 4.29 4.06 3.98 4.60
of wich with collateral or
guarantees 3.49 3.84 3.97 4.25 3.94 4.14 4.45 3.66 3.98 4.16 4.14 4.27 4.09 3.96 4.61
Over 1 year x x 5.24 x x x x x x 3.87 4.23 6.79 x 2.94 5.70
of wich with collateral or
guarantees x x x x x x x x x x x 7.49 x 4.15 6.08
Other loans over 1 million euro by initial rate fixation
Floating rate and up to 1 year 2.73 3.94 2.82 4.14 3.41 2.92 3.57 3.87 3.31 3.53 3.47 3.26 2.57 3.57 4.29
of wich with collateral or
guarantees 3.35 3.95 2.42 4.31 3.59 2.90 3.78 3.88 3.30 3.83 3.48 3.13 2.40 3.57 3.19
Over 1 year 4.92 x 3.71 x x x x x x 4.90 x x x x 4.32
of wich with collateral or
guarantees 3.53 x 4.26 x x x x x x 4.90 x x x x 4.32
75
WEIGHTED AVERAGE INTEREST RATES CHARGED BY MFIs IN TRANSACTIONS WITH RESIDENT NON-FINANCIAL
CORPORATIONS AND HOUSEHOLDS IN EURO (CONT.)
(%)
21.b
1
Including revolving loans, overdrafts, and extended and convenience credit card credit.
2
Including bank overdraft.
WEIGHTED AVERAGE INTEREST RATES CHARGED BY MFIs IN TRANSACTIONS WITH RESIDENT NON-FINANCIAL
CORPORATIONS AND HOUSEHOLDS IN US DOLLARS
(%)
21.c
1
End-of-period.
2
For this instrument category, households and non-financial corporations are merged and allocated to the household sector.
5. Interest rates on loans (outstanding amounts)
2012 2013
X XI XII I II III IV V VI VII VIII IX X XI XII
Loans to households
Lending for house purchase, with
maturity
Up to 1 year 2.85 20.81 5.02 3.79 3.05 19.81 13.10 2.75 2.72 2.80 2.79 3.00 2.50 2.33 2.43
Over 1 and up to 5 years 4.17 4.07 4.15 4.07 4.08 4.05 4.07 3.99 3.95 3.98 3.97 3.95 3.97 3.97 3.97
Over 5 years 2.80 2.72 2.67 2.61 2.59 2.57 2.55 2.59 2.57 2.56 2.55 2.54 2.54 2.54 2.54
Consumer credit and other loans,
with maturity1
Up to 1 year2
9.33 9.45 9.75 9.81 10.09 10.25 10.47 11.11 10.98 11.19 10.73 11.48 11.01 11.39 12.71
Over 1 and up to 5 years 9.94 9.92 10.01 10.10 10.23 10.24 10.64 10.74 10.83 10.93 11.70 11.83 11.87 11.95 12.18
Over 5 years 4.39 4.32 4.28 4.23 4.22 4.21 4.22 4.19 4.18 4.20 4.22 4.22 4.25 4.23 4.40
Loans to non-financial corporations
With maturity1
Up to 1 year2
3.84 4.43 3.58 3.51 3.87 3.69 3.76 3.59 3.73 3.40 3.39 3.41 3.78 3.33 3.19
Over 1 and up to 5 years 3.51 3.43 3.43 3.47 3.50 3.37 3.39 3.35 3.32 3.38 3.32 3.36 3.36 3.33 3.34
Over 5 years 3.00 2.95 2.93 2.89 2.88 2.87 2.85 2.77 2.76 2.80 2.86 2.84 2.84 2.82 2.83
1. Interest rates on deposits (new business)
2012 2013
X XI XII I II III IV V VI VII VIII IX X XI XII
Deposits from households
Overnight1
0.18 0.18 0.15 0.14 0.13 0.13 0.15 0.16 0.15 0.14 0.15 0.22 0.21 0.20 0.20
With agreed maturity
Up to 1 year 0.27 0.25 0.52 0.37 0.24 0.28 0.19 0.17 0.14 0.18 0.12 0.15 0.23 0.24 0.37
Over 1 and up to 2 years 1.58 1.52 2.05 1.83 1.72 3.82 0.88 0.93 1.42 0.89 0.90 0.95 1.25 0.98 2.68
Over 2 years 4.44 3.56 3.65 4.00 2.82 1.92 2.62 3.46 1.50 2.53 1.75 0.81 0.72 1.27 1.69
Redeemable at notice2
Up to 3 months 0.21 0.21 0.21 0.21 0.21 0.19 0.19 0.18 0.17 0.17 0.17 0.17 0.17 0.17 0.17
Over 3 months – – – – x – – – – – – – – – –
Deposits from non-financial corporations
Overnight1
0.08 0.09 0.07 0.07 0.09 0.10 0.07 0.05 0.05 0.05 0.06 0.06 0.06 0.05 0.07
With agreed maturity
Up to 1 year 0.13 0.12 0.15 0.13 0.13 0.14 0.11 0.11 0.06 0.08 0.07 0.13 0.19 0.08 0.06
Over 1 and up to 2 years – – – – – – x x – – x – – – x
Over 2 years – – – – – – x – – – – x – x –
Repos – – – – – – – – – – – – – – –
76
1
End-of-period.
2
For this instrument category, households and non-financial corporations are merged and allocated to the household sector.
WEIGHTED AVERAGE INTEREST RATES CHARGED BY MFIs IN TRANSACTIONS WITH RESIDENT NON-FINANCIAL
CORPORATIONS AND HOUSEHOLDS IN US DOLLARS (CONT.)
(%)
21.c
2. Interest rates on deposits (outstanding amounts)
2012 2013
X XI XII I II III IV V VI VII VIII IX X XI XII
Deposits from households
Overnight1
0.18 0.18 0.15 0.14 0.13 0.13 0.15 0.16 0.15 0.14 0.15 0.22 0.21 0.20 0.20
With agreed maturity
Up to 2 years 1.27 1.24 1.12 1.05 1.07 1.07 1.05 1.05 1.03 1.00 0.99 0.95 0.94 0.93 0.90
Over 2 years 3.38 3.30 3.19 3.10 3.17 3.19 3.18 3.17 3.16 3.13 3.10 3.05 3.02 2.91 2.88
Redeemable at notice2
Up to 3 months 0.21 0.21 0.21 0.21 0.21 0.19 0.19 0.18 0.17 0.17 0.17 0.17 0.17 0.17 0.17
Over 3 months – – – – x – – – – – – – – – –
Deposits from non-financial corporations
Overnight1
0.08 0.09 0.07 0.07 0.09 0.10 0.07 0.05 0.05 0.05 0.06 0.06 0.06 0.05 0.07
With agreed maturity
Up to 2 years 0.56 0.44 0.38 0.47 0.45 0.49 0.39 0.37 0.37 0.32 0.25 0.39 0.47 0.66 0.58
Over 2 years 3.57 3.53 3.53 3.53 3.53 3.53 3.53 3.53 1.40 0.87 0.87 0.87 0.86 0.89 0.89
Repos – – – – – – – – – – – – – – –
77
WEIGHTED AVERAGE INTEREST RATES CHARGED BY MFIs IN TRANSACTIONS WITH RESIDENT NON-FINANCIAL
CORPORATIONS AND HOUSEHOLDS IN US DOLLARS (CONT.)
(%)
21.c
1
End-of-period.
2
The annual percentage rate of charge covers the total cost of a loan. The total cost comprises an interest rate component and a component of other (related) charges, such as the cost of
inquiries, administration, preparation of documents, guarantees, etc.
3. Interest rates on loans to households (new business)
2012 2013
X XI XII I II III IV V VI VII VIII IX X XI XII
Bank overdraft1
– – – – – – – – – – – – – – –
Revolving loans and overdraft1
7.32 7.47 7.57 7.79 8.14 6.17 6.12 6.76 7.39 7.38 7.53 6.24 6.38 6.41 6.41
Extended credit card credit1
25.04 25.66 25.92 25.86 24.76 24.96 25.78 24.97 25.33 24.66 24.85 24.79 25.10 24.95 24.68
Lending for house purchase
By initial rate fixation
Floating rate and up to 1 year 4.02 2.50 2.46 5.27 3.44 2.38 3.71 2.19 3.01 2.31 3.23 2.90 2.82 2.45 5.26
of wich with collateral or
guarantees 3.93 2.16 2.91 5.87 3.27 2.44 3.83 1.92 3.01 2.25 3.21 2.90 2.81 2.28 5.43
Over 1 and up to 5 years – – – – – x x x x x x x x x –
of wich with collateral or
guarantees – – – – – – – – – – – – – – –
Over 5 and up to 10 years x x x x x – – – x – – – – – –
of wich with collateral or
guarantees x – x – – – – – x – – – – – –
Over 10 years – x – – – – – x – – x x x x –
of wich with collateral or
guarantees – x – – – – – x – – – – – – –
Annual percentage rate of charge2
4.29 3.54 2.66 5.75 3.75 2.57 4.14 2.52 3.54 2.42 3.51 3.42 3.20 2.80 5.42
Consumer credit
By initial rate fixation
Floating rate and up to 1 year 12.43 x 17.92 x 16.12 15.75 13.70 16.68 16.94 x 16.53 x x 16.72 17.00
of wich with collateral or
guarantees x x x x x x x x – – x – – x x
Over 1 year x x – – x – x x x x x x x x x
of wich with collateral or
guarantees x – – – – – – – – – – – – – –
Annual percentage rate of charge2
18.25 15.00 14.37 24.55 13.82 18.21 13.15 13.75 14.83 13.85 21.38 14.59 14.05 14.31 18.09
Other lending by initial rate fixation
Floating rate and up to 1 year x 6.37 4.83 – x 6.21 x x 5.17 x x x 3.83 4.41 3.77
Over 1 year x – x x – x – – – x – x – – –
78
1
End-of-period.
WEIGHTED AVERAGE INTEREST RATES CHARGED BY MFIs IN TRANSACTIONS WITH RESIDENT NON-FINANCIAL
CORPORATIONS AND HOUSEHOLDS IN US DOLLARS (CONT.)
(%)
21.c
4. Interest rates on loans to non-financial corporations (new business)
2012 2013
X XI XII I II III IV V VI VII VIII IX X XI XII
Bank overdraft1
– – – – – – – – – – – – – – –
Revolving loans and overdraft1
3.65 3.72 3.73 3.74 3.63 3.67 3.59 3.59 3.71 3.53 3.48 3.52 3.56 3.56 3.51
Extended credit card credit1
13.94 17.66 15.94 17.10 16.38 15.02 13.03 14.47 21.53 16.34 15.28 16.77 12.33 13.34 15.99
Other loans up to 0.25 million euro by initial rate fixation
Floating rate and up to 1 year x x x x 6.33 7.00 7.13 7.72 7.04 3.58 x x x x x
of wich with collateral or
guarantees x x x x x x x 7.60 7.13 x x x x x –
Over 1 year x – – – – – – – – x – – – x –
of wich with collateral or
guarantees x – – – – – – – – x – – – x –
Other loans over 0.25 million euro and up to 1 million euro by initial rate fixation
Floating rate and up to 1 year x x x x 9.14 x x x 8.47 x – x – x x
of wich with collateral or
guarantees x x x x x x – x 8.47 x – x – x x
Over 1 year – – – – – – – x – – x – – – –
of wich with collateral or
guarantees – – – – – – – x – – x – – – –
Other loans over 1 million euro by initial rate fixation
Floating rate and up to 1 year – x 7.77 x x x x x x x 7.80 – x x x
of wich with collateral or
guarantees – x 7.77 x x x x x x x 7.80 – x x x
Over 1 year x – x – – – x – – – – – – – –
of wich with collateral or
guarantees x – x – – – x – – – – – – – –
79
1
Including revolving loans, overdrafts, extended credit card credit and convenience credit card credit.
2
Including bank overdraft.
WEIGHTED AVERAGE INTEREST RATES CHARGED BY MFIs IN TRANSACTIONS WITH RESIDENT NON-FINANCIAL
CORPORATIONS AND HOUSEHOLDS IN US DOLLARS (CONT.)
(%)
21.c
5. Interest rates on loans (outstanding amounts)
2012 2013
X XI XII I II III IV V VI VII VIII IX X XI XII
Loans to households
Lending for house purchase, with
maturity
Up to 1 year 2.05 2.19 1.97 1.98 2.84 2.71 1.35 2.19 3.26 1.52 3.90 2.07 2.09 4.16 3.42
Over 1 and up to 5 years 5.63 5.50 5.57 5.85 5.39 5.36 5.38 5.60 5.61 5.62 6.07 6.07 6.12 6.13 6.19
Over 5 years 3.00 2.94 2.91 2.87 2.83 2.82 2.80 2.84 2.82 2.80 2.79 2.77 2.77 2.77 2.75
Consumer credit and other loans,
with maturity1
Up to 1 year2
11.35 10.98 9.50 9.57 9.57 10.08 10.25 9.64 9.81 10.27 10.06 10.09 9.52 9.86 11.34
Over 1 and up to 5 years 7.39 7.30 7.31 7.33 7.14 6.71 6.68 6.76 7.10 7.18 7.26 7.30 7.21 7.26 7.47
Over 5 years 3.96 3.90 3.93 3.90 3.92 3.81 3.78 3.73 3.72 3.75 3.75 3.73 3.72 3.79 3.84
Loans to non-financial corporations
With maturity1
Up to 1 year2
4.13 4.35 4.66 4.77 4.59 4.72 4.67 4.60 4.57 4.77 4.19 4.25 3.99 4.23 4.21
Over 1 and up to 5 years 5.73 5.21 5.23 5.35 5.45 5.54 5.56 5.68 5.75 5.78 5.82 5.58 5.44 5.50 5.56
Over 5 years 4.36 4.67 5.79 5.83 5.54 5.48 5.54 5.48 5.47 5.59 5.41 5.41 5.52 5.48 5.72
80
2012 2013
X XI XII I II III IV V VI VII VIII IX X XI XII
In lats
Loans up to an amount of
0.25 million euro 4.23 4.53 4.74 4.70 4.92 4.99 4.55 4.66 4.65 4.47 4.36 4.42 4.55 4.70 4.37
of wich with collateral or
guarantees 3.96 4.37 4.50 4.60 4.57 4.82 4.43 4.57 4.61 4.39 4.18 4.31 4.44 4.56 4.27
Loans over an amount of
0.25 million euro and up to
1 million euro 4.11 3.17 3.48 4.19 4.63 4.07 x 3.94 3.97 3.80 7.70 4.08 3.87 4.30 4.99
of wich with collateral or
guarantees 4.11 3.17 3.39 4.15 4.63 4.14 x 3.94 3.74 x 4.72 4.13 3.95 4.30 5.15
Loans over 1 million euro x 4.86 x – 4.47 4.78 4.57 5.21 – 2.45 5.07 x x x x
of wich with collateral or
guarantees x 5.10 x – 4.47 4.78 x 5.21 – 2.45 5.07 x x – x
In euro
Loans up to an amount of
0.25 million euro 3.93 3.87 4.11 3.83 4.01 4.05 3.95 3.97 4.43 4.24 4.18 4.35 4.19 4.28 3.87
of wich with collateral or
guarantees 3.82 3.83 4.04 3.80 3.94 3.99 3.87 3.79 4.42 4.22 4.21 4.24 4.07 4.17 3.83
Loans over an amount of
0.25 million euro and up to
1 million euro 3.45 3.61 4.11 4.09 3.95 4.19 4.28 3.58 4.18 4.34 4.16 4.42 4.18 3.84 4.06
of wich with collateral or
guarantees 3.33 3.69 4.02 4.06 3.95 4.15 4.29 3.58 4.16 4.35 4.13 4.40 4.22 3.85 4.06
Loans over 1 million euro 2.65 3.77 2.80 4.01 3.33 3.00 3.47 3.73 3.42 3.18 3.17 3.31 2.37 3.63 5.35
of wich with collateral or
guarantees 3.26 3.77 2.37 4.30 3.47 2.99 3.68 3.75 3.33 3.40 3.16 3.35 2.25 3.62 3.68
In US dollars
Loans up to an amount of
0.25 million euro x x x 6.75 6.71 x 6.69 6.61 6.07 x 5.49 x x x x
of wich with collateral or
guarantees – x x x 6.59 x 6.51 6.45 5.95 x 5.37 x x x –
Loans over an amount of
0.25 million euro and up to
1 million euro x x x – x x x – x x – – – x x
of wich with collateral or
guarantees x x x – x x – – x x – – – x x
Loans over 1 million euro – x 7.13 – x x – – x – x – – – x
of wich with collateral or
guarantees – x 7.13 – x x – – x – x – – – x
WEIGHTED AVERAGE INTEREST RATES CHARGED BY MFIS IN TRANSACTIONS WITH RESIDENT NON-FINANCIAL
CORPORATIONS (NEW BUSINESS)
(with floating interest rate, up to 1 year initial rate fixation and original maturity of over 1 year; %)
21.d
81
Loans to non-resident MFIs Total loans
Overnight Up to 1 month 1–3 months Over 3 months
2012
X 23 274.4 1 362.8 17.7 15.1 24 670.0 26 350.4
XI 20 294.9 1 367.2 7.6 12.8 21 682.5 23 568.3
XII 19 114.4 1 101.7 74.3 11.7 20 302.1 21 906.6
2013
I 19 923.1 2 576.6 35.4 13.4 22 548.5 24 376.5
II 18 295.5 1 584.2 4.6 36.7 19 921.0 20 948.6
III 19 353.9 2 137.4 83.8 28.6 21 603.7 22 756.5
IV 20 953.5 1 925.3 109.5 63.8 23 052.1 24 552.2
V 19 867.6 2 394.9 2.9 30.5 22 295.9 24 309.4
VI 20 748.8 1 569.9 92.5 29.3 22 440.5 24 319.6
VII 26 712.7 1 842.0 28.4 21.3 28 604.4 30 744.9
VIII 25 717.9 2 254.6 17.8 19.9 28 010.2 30 386.4
IX 22 870.0 1 659.1 92.7 26.1 24 647.9 26 212.5
X 23 340.1 2 128.6 11.7 7.1 25 487.5 27 618.6
XI 18 980.8 1 582.6 241.0 14.6 20 819.0 22 560.2
XII 17 954.9 2 496.2 16.1 15.6 20 482.8 22 161.8
LENDING IN THE INTERBANK MARKETS
(transactions; millions of lats)
Loans to resident MFIs
In lats In foreign currencies
Overnight Up to
1 month
1–3 months Over
3 months
Overnight Up to
1 month
1–3 months Over
3 months
2012
X 475.3 23.4 7.1 – 505.8 1 009.3 165.3 – – 1 174.6 1 680.4
XI 477.6 51.2 3.0 – 531.8 1 173.5 176.5 – 4.0 1 354.0 1 885.8
XII 339.0 42.0 – 0.5 381.5 1 051.9 167.1 4.0 – 1 223.0 1 604.5
2013
I 472.8 48.2 9.1 – 530.1 1 068.4 215.8 2.8 10.9 1 297.9 1 828.0
II 248.2 26.5 – 5.0 279.7 618.1 129.8 – – 747.9 1 027.6
III 236.6 18.8 0.3 1.5 257.2 727.7 167.6 0.3 – 895.6 1 152.8
IV 335.9 6.1 7.8 – 349.8 1 008.9 127.6 13.8 – 1 150.3 1 500.1
V 524.8 26.3 – – 551.1 1 278.8 183.6 – – 1 462.4 2 013.5
VI 520.6 16.0 0.5 – 537.1 1 216.7 116.9 7.9 0.5 1 342.0 1 879.1
VII 669.2 10.9 5.2 – 685.3 1 301.4 148.5 5.3 – 1 455.2 2 140.5
VIII 520.0 11.2 – – 531.2 1 743.8 101.2 – – 1 845.0 2 376.2
IX 226.0 15.1 0.4 – 241.5 1 221.7 95.6 5.5 0.3 1 323.1 1 564.6
X 566.9 14.3 – – 581.2 1 359.9 182.3 7.7 – 1 549.9 2 131.1
XI 445.8 6.0 – – 451.8 1 053.3 232.6 3.5 – 1 289.4 1 741.2
XII 336.6 31.3 – – 367.9 1 087.9 215.7 7.5 – 1 311.1 1 679.0
22.22.
82
INTEREST RATES IN THE DOMESTIC INTERBANK MARKET
(% per annum)
2012 2013
X XI XII I II III IV V VI VII VIII IX X XI XII
Weighted average interest rates on loans in lats
Overnight 0.1 0.1 0.1 0.1 0.1 0.1 0.1 0.1 0.1 0.1 0.1 0.1 0.1 0.1 0.1
Up to 1 month 0.2 0.2 0.2 0.1 0.1 0.1 0.1 0.1 0.1 0.1 0.1 0.1 0.1 0.1 0.1
1–3 months 0.3 0.7 – 0.3 – 0.1 0.2 – 0.1 0.2 – 0.1 – – –
Over 3 months – – 0.1 – 0.7 0.8 – – – – – – – – –
Weighted average interest rates on loans in foreign currencies
Overnight 0.2 0.2 0.2 0.2 0.2 0.2 0.2 0.2 0.1 0.1 0.1 0.1 0.1 0.1 0.1
Up to 1 month 0.1 0.1 0.1 0.1 0.1 0.2 0.2 0.2 0.1 0.1 0.1 0.1 0.1 0.1 0.1
1–3 months – – 0.4 0.2 – 0.2 0.1 – 0.3 0.2 – 0.2 0.2 0.3 0.2
Over 3 months – 0.8 – 0.4 – – – – 0.5 – – 0.3 – – –
23.a
INTEREST RATES SET BY LATVIJAS BANKA
(% per annum)
Effective date
(dd.mm.yyyy)
Refinancing rate of
Latvijas Banka
Lombard rates Interest rates on time deposits
Up to the 10th day 11th–20th day Over 20 days 7-day deposits 14-day deposits
17.03.2000 3.5 5.5 6.5 7.5 1.5 1.75
19.11.2001 – – – – 3.0 3.25
17.05.2002 – – – – 2.5 2.75
16.09.2002 3.0 5.0 6.0 7.0 2.0 2.25
11.03.2004 3.5 – – – – –
12.11.2004 4.0 – – – – –
15.07.2006 4.5 5.5 6.5 7.5 – –
17.11.2006 5.0 6.0 7.0 8.0 – –
Marginal lending facility rate with Latvijas Banka Deposit facility rate with Latvijas Banka
(overnight deposits)
24.03.2007 5.5 6.5 2.0
18.05.2007 6.0 7.5 –
24.02.2008 – – 3.0
To credit institutions that
have used the facility no
more than 5 working
days within the previous
30 day period
To credit institutions
that have used the
facility 6–10 working
days within the previous
30 day period
To credit institutions that
have used the facility
more than 10 working
days within the previous
30 day period
09.12.2008 – 7.5 15.0 30.0 –
24.01.2009 – – – – 2.0
24.03.2009 5.0 – – – 1.0
24.05.2009 4.0 – – – –
Deposit facility rate with Latvijas Banka
Overnight deposits 7-day deposits
24.03.2010 3.5 – – – 0.5 1.0
24.07.2010 – – – – 0.375 0.5
24.11.2010 – – – – 0.25 0.375
24.03.2012 – 5.0 10.0 15.0 – –
24.07.2012 3.0 4.0 7.0 10.0 0.1 0.125
24.09.2012 2.5 3.0 6.0 9.0 0.05 0.075
24.07.2013 2.0 2.5 4.75 7.0 – –
24.09.2013 1.5 2.0 3.5 5.0 – –
24.11.2013 0.25 0.75 1.5 2.5 – –
23.b
83
PRINCIPAL FOREIGN EXCHANGE TRANSACTIONS (BY TYPE, COUNTERPARTY AND CURRENCY)1
(millions of lats)
2012 2013
X XI XII I II III IV V VI VII VIII IX X XI XII
Type of transaction
Spot exchange
transactions
32 272.4 29 128.7 23 204.4 20 526.2 23 588.8 23 904.6 22 343.6 20 878.8 21 318.8 22 762.1 21 325.0 21 644.4 23 385.8 19 077.0 24 781.2
Forward exchange
contracts 315.8 410.2 714.0 374.4 326.6 562.2 348.6 526.3 320.5 360.4 428.8 366.4 318.8 396.6 475.5
Currency swap
arrangements 48 919.5 43 290.0 39 273.8 46 723.3 40 305.8 37 633.1 39 531.5 39 804.5 42 257.6 45 742.6 49 376.9 46 936.3 50 135.1 41 887.1 50 424.0
Counterparties
Resident MFIs 7 411.2 6 263.0 3 603.8 3 703.2 2 874.4 1 521.1 1 536.4 3 143.6 3 930.8 4 753.5 3 702.0 2 567.6 2 543.1 2 220.1 2 758.6
Resident other financial
intermediaries, financial
auxiliaries, insurance
corporations and pension
funds 327.3 294.0 307.1 381.6 289.1 271.8 199.5 249.5 290.0 183.2 187.7 264.2 177.9 238.6 438.9
Resident government,
non-financial corporations
and non-profit institutions
serving households 972.1 906.0 1 038.8 800.6 858.9 898.2 881.2 880.7 809.9 933.8 804.3 810.5 830.8 795.6 1 216.7
Non-resident MFIs 47 995.8 44 145.3 39 074.6 43 693.8 40 820.0 39 118.6 41 224.8 40 065.3 40 641.6 43 746.8 45 461.3 42 977.2 46 131.7 38 209.1 45 749.8
Non-resident other
financial intermediaries,
financial auxiliaries,
insurance corporations
and pension funds 633.7 647.0 659.0 475.5 716.7 663.1 771.7 834.4 1 186.4 1 135.0 1 405.6 3 475.5 3 043.4 3 298.4 3 817.2
Non-resident government,
non-financial corporations
and non-profit institutions
serving households 19 133.1 16 148.6 14 466.8 14 891.5 14 672.2 13 886.3 13 704.8 11 606.4 11 090.7 11 715.9 12 320.8 12 272.7 13 855.9 10 631.0 18 570.6
Households 5 034.3 4 425.0 4 042.2 3 677.6 3 990.0 5 740.7 3 905.3 4 429.8 5 947.5 6 396.8 7 248.9 6 579.5 7 256.8 5 967.9 3 129.0
Currencies
Total in all currencies 81 507.6 72 828.9 63 192.2 67 623.9 64 221.3 62 099.9 62 223.7 61 209.6 63 897.0 68 865.1 71 130.7 68 947.2 73 839.7 61 360.7 75 680.8
incl. lats for euro 6 618.7 10 970.5 8 985.4 8 736.6 6 508.2 6 139.3 6 642.4 8 461.4 9 131.7 9 488.6 8 457.9 6 388.6 7 558.6 6 912.3 11 715.4
incl. lats for US dollars 712.0 352.3 282.7 311.6 213.4 221.1 209.5 206.0 162.7 681.5 311.5 220.0 333.9 205.4 251.0
incl. lats for other
currencies 84.2 74.5 78.2 58.4 55.4 68.5 67.9 65.5 65.0 71.8 71.8 70.7 66.3 64.7 76.4
1
Including the cash and non-cash transactions performed by credit institutions. The volume of cash and non-cash transactions has been translated into lats applying the exchange rate of
the respective foreign currency as set by Latvijas Banka on the last day of the reporting month.
INTEREST RATES IN LATVIJAS BANKA TENDERS OF REPURCHASE AGREEMENTS AND SHORT-TERM CURRENCY
SWAP CONTRACTS
(% per annum)
2012 2013
X XI XII I II III IV V VI VII VIII IX X XI XII
Main refinancing operation with
maturity 7 days average interest rate – – – – – – – – – – – – – – 0.5
Weighted average interest rate
on short-term currency swaps – – – – – – – – – – – – – – –
23.c
24.
84
NON-CASH FOREIGN EXCHANGE TRANSACTIONS1
(millions of lats)
2012 2013
X XI XII I II III IV V VI VII VIII IX X XI XII
EUR for LVL2
Amount 6 539.6 10 853.8 8 891.0 8 660.5 6 461.8 6 107.9 6 602.1 8 413.5 9 098.9 9 455.2 8 430.3 6 363.7 7 529.1 6 889.8 11 681.6
%3
8.0 14.9 14.1 12.8 10.1 9.8 10.9 13.8 14.3 13.8 11.9 9.2 10.2 11.3 15.5
USD for LVL2
Amount 689.9 339.9 271.0 303.0 196.5 206.2 196.7 192.0 150.7 675.9 301.1 212.3 326.7 198.7 242.5
%3
0.8 0.5 0.4 0.4 0.3 0.3 0.3 0.3 0.2 1.0 0.4 0.3 0.4 0.3 0.3
Other currencies for LVL2
Amount 74.5 65.5 68.9 51.3 49.5 60.7 60.3 56.8 56.0 60.4 62.2 63.4 59.5 57.9 69.4
%3
0.1 0.1 0.1 0.1 0.1 0.1 0.1 0.1 0.1 0.1 0.1 0.1 0.1 0.1 0.1
USD for EUR
Amount 46 707.5 37 984.4 31 461.8 36 893.3 39 026.3 34 853.5 34 119.7 32 507.2 34 297.6 38 137.6 40 020.6 39 036.5 44 564.6 35 794.4 39 479.3
%3
57.4 52.3 49.9 54.6 60.8 56.2 56.2 53.2 53.7 55.4 56.3 56.7 60.5 58.5 52.3
GBP for EUR
Amount 1 713.4 1 432.6 689.7 724.8 1 180.7 1 087.5 829.5 814.8 753.5 848.3 803.4 1 341.6 840.9 803.4 986.6
%3
2.1 2.0 1.1 1.1 1.8 1.8 1.4 1.3 1.2 1.2 1.1 1.9 1.1 1.3 1.3
Other currencies (except
LVL) for EUR
Amount 3 881.0 3 441.7 2 783.2 3 282.0 2 859.1 2 483.0 2 829.9 2 555.3 3 223.9 3 035.3 2 776.7 2 532.1 2 563.0 2 602.3 3 020.2
%3
4.8 4.7 4.4 4.9 4.5 4.0 4.7 4.2 5.0 4.4 3.9 3.7 3.5 4.3 4.0
RUB for USD
Amount 6 915.2 6 471.0 9 273.6 5 492.1 6 140.4 7 229.9 7 573.3 6 472.8 7 971.5 8 152.5 9 098.9 7 207.0 7 878.2 5 407.5 6 971.5
%3
8.5 8.9 14.7 8.1 9.6 11.7 12.5 10.6 12.5 11.8 12.8 10.5 10.7 8.8 9.2
GBP for USD
Amount 4 831.1 3 983.9 3 387.1 5 515.4 3 150.3 4 326.0 3 116.5 3 629.4 2 726.8 2 964.7 3 201.3 5 437.6 4 108.0 3 700.8 6 483.3
%3
5.9 5.5 5.4 8.2 4.9 7.0 5.1 5.9 4.3 4.3 4.5 7.9 5.6 6.1 8.6
SEK for USD
Amount 52.9 72.7 21.6 32.0 14.6 25.2 9.8 13.8 28.7 46.5 23.3 59.4 57.9 9.9 14.9
%3
0.1 0.1 0 0 0 0 0 0 0 0.1 0 0.1 0.1 0 0
Other currencies (except LVL
and EUR) for USD
Amount 8 417.3 5 774.6 4 188.6 4 644.1 3 182.3 3 106.7 4 365.5 4 662.7 2 976.4 3 371.5 4 387.9 4 790.4 3 760.9 3 759.5 4 537.2
%3
10.4 7.9 6.7 6.9 5.0 5.0 7.2 7.6 4.7 4.9 6.2 7.0 5.1 6.1 6.0
Other currencies (except LVL,
EUR and USD) for other
currencies
Amount 1 574.2 2 270.7 2 040.3 1 927.7 1 890.5 2 559.2 956.1 1 820.6 2 559.1 2 053.6 1 977.4 1 758.2 1 963.9 1 958.9 2 031.0
%3
1.9 3.1 3.2 2.9 2.9 4.1 1.6 3.0 4.0 3.0 2.8 2.6 2.7 3.2 2.7
1
Including non-cash transactions performed by credit institutions, reported by major currency.
2
The transaction volume has been translated into lats using the weighted average exchange rate of the respective foreign currency for the reporting month.
3
As percentage of the total.
25.
MONTHLY AVERAGES OF THE EXCHANGE RATES SET BY LATVIJAS BANKA
(LVL vs foreign currency)
2012 2013
X XI XII I II III IV V VI VII VIII IX X XI XII
EUR 0.7028 0.7028 0.7028 0.7028 0.7028 0.7028 0.7028 0.7028 0.7028 0.7028 0.7028 0.7028 0.7028 0.7028 0.7028
USD 0.5421 0.5478 0.5361 0.5305 0.5243 0.5415 0.5408 0.5410 0.5330 0.5371 0.5277 0.5267 0.5161 0.5203 0.5138
GBP 0.8717 0.8748 0.8652 0.8487 0.8144 0.8168 0.8256 0.8285 0.8242 0.8164 0.8162 0.8337 0.8306 0.8365 0.8411
100 JPY 0.6875 0.6783 0.6421 0.5990 0.5641 0.5723 0.5543 0.5385 0.5464 0.5390 0.5396 0.5309 0.5275 0.5219 0.4977
26.
85
WEIGHTED AVERAGE EXCHANGE RATES (CASH TRANSACTIONS)
(LVL vs foreign currency)
2012 2013
X XI XII I II III IV V VI VII VIII IX X XI XII
EUR
Buy 0.6914 0.6917 0.6915 0.6922 0.6961 0.6974 0.6967 0.6955 0.6961 0.6964 0.6974 0.6978 0.6988 0.6984 0.6995
Sell 0.6968 0.6977 0.6976 0.6991 0.7019 0.7034 0.7030 0.7018 0.7034 0.7045 0.7050 0.7054 0.7055 0.7052 0.7061
USD
Buy 0.5334 0.5392 0.5273 0.5218 0.5207 0.5375 0.5352 0.5355 0.5280 0.5327 0.5238 0.5233 0.5122 0.5170 0.5102
Sell 0.5383 0.5437 0.5324 0.5254 0.5236 0.5408 0.5393 0.5398 0.5326 0.5371 0.5284 0.5268 0.5163 0.5215 0.5146
GBP
Buy 0.8517 0.8481 0.8427 0.8288 0.8007 0.8061 0.8131 0.8141 0.8122 0.8037 0.8055 0.8218 0.8186 0.8271 0.8272
Sell 0.8645 0.8676 0.8577 0.8439 0.8146 0.8182 0.8254 0.8252 0.8240 0.8144 0.8166 0.8350 0.8314 0.8392 0.8413
100 JPY
Buy 0.6392 0.6489 0.5860 0.5725 0.5379 0.5481 0.5397 0.4810 0.5232 0.5186 0.5185 0.5101 0.5001 0.5117 0.4837
Sell 0.6917 0.6597 0.6256 0.5923 0.5719 0.5736 0.5637 0.5292 0.5375 0.5364 0.5373 0.5309 0.5256 0.5261 0.4988
SEK
Buy 0.0797 0.0796 0.0789 0.0794 0.0808 0.0826 0.0817 0.0806 0.0796 0.0796 0.0792 0.0799 0.0791 0.0778 0.0767
Sell 0.0813 0.0811 0.0807 0.0817 0.0825 0.0842 0.0832 0.0821 0.0816 0.0813 0.0812 0.0812 0.0810 0.0798 0.0791
RUB
Buy 0.0171 0.0169 0.0170 0.0170 0.0171 0.0173 0.0170 0.0169 0.0162 0.0161 0.0157 0.0159 0.0159 0.0157 0.0154
Sell 0.0174 0.0173 0.0173 0.0173 0.0174 0.0176 0.0173 0.0172 0.0166 0.0164 0.0161 0.0162 0.0162 0.0160 0.0157
CHF
Buy 0.5670 0.5695 0.5680 0.5618 0.5607 0.5638 0.5663 0.5530 0.5602 0.5588 0.5600 0.5601 0.5622 0.5639 0.5641
Sell 0.5785 0.5803 0.5789 0.5718 0.5709 0.5744 0.5759 0.5661 0.5698 0.5691 0.5716 0.5722 0.5716 0.5720 0.5764
27.
86
STRUCTURE OF GOVERNMENT SECURITIES
(at end of period; millions of lats)
2012 2013
X XI XII I II III IV V VI VII VIII IX X XI XII
Stock of government securities
outstanding 670.9 675.1 675.1 665.1 581.0 594.2 574.5 596.7 606.7 606.7 631.7 636.7 653.1 667.3 679.3
Residents 651.5 655.9 654.5 643.2 559.0 571.5 551.6 570.2 578.5 577.9 601.3 607.4 624.5 639.4 651.1
Non-financial corporations 20.9 20.9 20.8 20.8 21.4 84.7 20.5 20.0 20.0 20.0 20.0 20.0 20.0 20.0 20.4
Credit institutions 371.2 363.7 364.5 347.2 272.2 277.4 264.9 282.9 290.5 295.3 307.8 312.5 315.3 319.7 336.5
Money market funds 18.8 23.6 21.5 22.7 17.5 17.9 12.8 13.9 12.7 11.1 11.7 10.9 8.5 9.6 3.0
MFIs excluding central banks,
credit institutions and money
market funds 0 0 0 0 0 0 0 0 0 0 0 0 0 0 0
Other financial intermediaries
excluding investment funds 72.5 72.5 72.5 72.5 69.3 4.9 62.2 62.2 62.2 62.2 62.2 62.2 62.2 62.2 62.2
Financial auxiliaries 0.1 0.1 0.1 0.1 0 0 0 0 0 0 0 0 0 0 0
Insurance corporations and
pension funds 159.0 166.1 166.1 170.8 174.0 182.4 187.1 186.5 188.4 184.6 194.9 197.0 213.9 222.7 223.7
Central government 0 0 0 0 0 0 0 0 0 0 0 0 0 0 0
Households 3.5 3.5 3.5 3.6 2.9 2.5 2.5 3.0 3.0 3.1 3.1 3.1 3.1 3.1 3.1
Non-profit institutions serving
households 5.5 5.5 5.5 5.5 1.7 1.7 1.6 1.6 1.6 1.6 1.6 1.6 1.6 2.1 2.2
Non-residents 19.4 19.2 20.6 21.9 22.0 22.7 22.9 26.5 28.1 28.8 30.4 29.3 28.6 28.0 28.2
Non-financial corporations 0 0 0 0 0 0 0 0 0 0 0 0 0 0 0
Credit institutions 12.4 13.9 13.9 13.9 15.2 15.7 15.2 18.7 21.0 22.3 23.8 22.8 22.0 21.7 21.7
Money market funds 0 0 0 0 0 0 0 0 0 0 0 0 0 0 0
MFIs excluding central banks,
credit institutions and money
market funds 0 0 0 0 0 0 0 0 0 0 0 0 0 0 0
Other financial intermediaries
excluding investment funds 0 0 0 0 0 0 0 0 0 0 0 0 0 0 0
Financial auxiliaries 7.0 5.3 6.7 8.0 6.8 7.0 7.8 7.8 7.2 6.5 6.6 6.5 6.6 6.3 6.5
Insurance corporations and
pension funds 0 0 0 0 0 0 0 0 0 0 0 0 0 0 0
Central government 0 0 0 0 0 0 0 0 0 0 0 0 0 0 0
Households 0 0 0 0 0 0 0 0 0 0 0 0 0 0 0
Non-profit institutions serving
households 0 0 0 0 0 0 0 0 0 0 0 0 0 0 0
28.
87
AUCTIONS OF GOVERNMENT SECURITIES IN THE PRIMARY MARKET
(Q4 2013)
Date (dd.mm.) Initial maturity (months) Supply (thousands of lats) Demand (thousands of lats) Purchase (thousands of lats) Weighted average discount rate
(%)
Competitive multi-price auctions
02.10. 60 8 000 22 210 8 000 2.216
09.10. 12 9 000 22 000 9 000 0.353
23.10. 60 9 000 22 570 9 000 2.294
30.10. 12 10 000 24 000 10 000 0.376
13.11. 12 10 000 24 000 10 000 0.386
27.11. 60 8 000 34 400 8 000 1.959
04.12. 6 8 000 27 500 8 000 0.228
11.12. 12 10 000 33 100 10 000 0.372
Primary placement of government securities via outright sales of securities
03.10. 60 2 000 5 330 2 000 2.216
10.10. 12 1 000 1 170 1 000 0.353
24.10. 60 1 000 2 410 1 000 2.294
31.10. 12 2 000 3 750 2 000 0.376
14.11. 12 2 000 4 220 2 000 0.386
28.11. 60 2 000 8 000 2 000 1.959
05.12. 6 2 000 5 160 2 000 0.228
12.12. 12 2 000 6 100 2 000 0.372
29.
DYNAMICS OF GDP
2012 2013
Q1 Q2 Q3 Q4 Q2 Q3 Q4Q1
At current prices; millions of lats 15 519.8 3 406.7 3 808.4 4 042.4 4 262.3 4 032.3² 4 303.5² 4 449.216 386.2 3 601.2²
At constant prices1
; millions of lats 14 164.8 3 128.1 3 526.4 3 675.2 3 835.1 3 680.4² 3 844.9² 3 974.014 747.0 3 247.7²
Annual growth rate (%) 5.2 7.1 4.9 4.6 4.6 4.4² 4.6² 3.64.1 3.8
Gross value added 4.7 5.7 4.6 4.7 3.9 3.8² 4.4² 3.23.7 3.5
Goods-producing sector 6.7 10.1 7.1 5.3 5.0 0.3² 3.3² 1.10.9 –1.7²
Services sector 4.0 3.6 3.7 4.5 4.0 5.4 5.0 4.35.0 5.6
1
Chain-linked; average prices in 2010.
2
Data have been revised.
31.
LATVIJAS BANKA TRANSACTIONS IN THE SECONDARY MARKET FOR GOVERNMENT SECURITIES
(millions of lats)
2012 2013
X XI XII I II III IV V VI VII VIII IX X XI XII
Securities purchased 0 0 0 0 0 0 0 0 0 0 0 0 0 0 0
Securities sold 0 0 0 0 0 0 0 0 0 0 0 0 0 0 0
30.
88
20121
2013
X XI XII I1
II1
III1
IV1
V1
VI1
VII1
VIII1
IX1
X XI XII
Exports 698.3 698.2 562.2 531.7 544.4 566.8 586.1 573.0 555.2 541.9 595.8 645.0 690.9 644.4 565.8
Imports 862.3 795.9 698.0 684.5 673.0 762.7 767.0 702.7 674.1 763.5 759.1 780.6 794.4 723.1 691.6
Balance –164.0 –97.7 –135.8 –152.8 –128.6 –195.9 –180.9 –129.7 –118.9 –221.6 –163.3 –135.6 –103.5 –78.7 –125.8
1
Data have been revised.
CHANGES IN THE AVERAGE MONTHLY WAGES AND SALARIES AND UNEMPLOYMENT
2012 2013
X XI XII I II III IV V VI VII VIII IX X XI XII
Average gross wages and salaries
LVL per month 486 477 513 485 475 492 503 503¹ 502¹ 528 501 494¹ 508 499 545
Year-on-year changes (%) 105.3 102.8 102.6 104.5 103.4 103.6 105.0¹ 105.2¹ 103.5¹ 106.8 103.3¹ 105.1 104.5 104.5 106.1
Real net wage index
(year-on-year basis; %) 103.7 101.3 100.8 104.9 104.1 104.3 106.1¹ 106.0¹ 103.8¹ 107.7¹ 104.7 106.7¹ 105.6 106.0 107.7
Number of registered unemployed persons
At end of month 105 670 104 414 104 052 107 488 107 687 107 063 102 760 97 769 94 754 92 975 91 202 89 435 89 616 91 619 93 321
Year-on-year changes (%) 80.9 80.2 79.9 81.1 80.7 81.0 80.4 80.1 80.6 81.1 81.8 82.6 84.8 87.7 89.7
1
Data have been revised.
32.
LATVIAN FOREIGN TRADE BALANCE
(millions of lats; exports – in FOB prices, imports – in CIF prices)
20121
2013
Q1 Q2 Q3 Q4 Q11
Q21
Q31
Q4
Exports 6 937.4 1 518.7 1 616.3 1 843.6 1 958.7 7 041.0 1 642.8 1 714.3 1 782.8 1 901.1
Imports 8 793.7 2 008.4 2 153.0 2 276.1 2 356.2 8 776.3 2 120.2 2 143.8 2 303.2 2 209.1
Balance –1 856.3 –489.7 –536.6 –432.4 –397.5 –1 735.3 –477.3 –429.5 –520.4 –308.0
33.
89
MAIN IMPORT GOODS OF LATVIA
(in CIF prices)
201320121
Q11
Q21
Q31
Q4
Millions
of lats
% Millions
of lats
% Millions
of lats
% Millions
of lats
% Millions
of lats
% Millions
of lats
%
Total 8 793.7 100.0 8 776.3 100.0 2 120.2 100.0 2 143.8 100.0 2 303.2 100.0 2 209.1 100.0
Agricultural and food products 1 356.3 15.4 1 389.1 15.8 316.6 14.9 345.0 16.1 355.2 15.4 372.3 16.8
Mineral products 1 552.9 17.7 1 499.2 17.1 409.1 19.3 342.4 16.0 394.3 17.1 353.4 16.0
Products of the chemical and allied
industries 780.0 8.9 827.6 9.4 208.4 9.8 203.5 9.5 199.7 8.7 216.0 9.8
Plastics and articles thereof; rubber
and articles thereof 453.9 5.2 486.1 5.5 109.9 5.2 123.9 5.8 141.8 6.1 110.6 5.0
Wood and articles of wood 139.6 1.6 175.6 2.0 42.2 2.0 45.1 2.1 43.0 1.9 45.3 2.1
Pulp of wood; paper and paperboard 187.7 2.1 215.3 2.5 49.7 2.4 51.1 2.4 55.2 2.4 59.2 2.7
Textiles and textile articles 370.4 4.2 417.7 4.8 104.1 4.9 99.6 4.6 122.7 5.3 91.3 4.1
Articles of stone, plaster, cement,
glassware and ceramic products 138.9 1.6 150.7 1.7 29.8 1.4 38.8 1.8 44.9 1.9 37.2 1.7
Base metals and articles of base
metals 916.2 10.4 781.0 8.9 200.8 9.5 186.9 8.7 199.4 8.7 193.9 8.8
Machinery and mechanical
appliances; electrical equipment 1 605.3 18.2 1 615.4 18.4 367.9 17.4 402.5 18.8 424.4 18.4 420.6 19.0
Transport vehicles 757.8 8.6 648.8 7.4 153.6 7.2 178.3 8.3 162.6 7.1 154.3 7.0
Miscellaneous manufactured
articles 190.7 2.2 198.6 2.3 42.9 2.0 47.9 2.2 52.0 2.3 55.9 2.5
Other goods 343.9 3.9 371.1 4.2 85.2 4.0 78.9 3.7 108.0 4.7 99.0 4.5
1
Data have been revised.
35.
MAIN EXPORT GOODS OF LATVIA
(in FOB prices)
20121
2013
Q11
Q21
Q31
Q4
Millions
of lats
% Millions
of lats
% Millions
of lats
% Millions
of lats
% Millions
of lats
% Millions
of lats
%
Total 6 937.4 100.0 7 041.0 100.0 1 642.8 100.0 1 714.3 100.0 1 782.8 100.0 1 901.1 100.0
Agricultural and food products 1 423.1 20.5 1 422.0 20.2 307.6 18.7 310.0 18.1 349.8 19.6 454.5 23.9
Mineral products 603.6 8.7 617.4 8.8 126.5 7.7 147.4 8.6 184.4 10.3 159.0 8.4
Products of the chemical and allied
industries 447.6 6.5 472.2 6.7 115.0 7.0 102.6 6.0 111.8 6.3 142.8 7.5
Plastics and articles thereof; rubber
and articles thereof 210.6 3.0 209.3 3.0 48.2 2.9 56.0 3.3 56.4 3.2 48.7 2.5
Wood and articles of wood 1 030.9 14.9 1 134.6 16.1 261.2 15.9 293.7 17.1 288.5 16.2 291.1 15.3
Pulp of wood; paper and paperboard 138.5 2.0 155.4 2.2 38.6 2.3 35.9 2.1 39.2 2.2 41.8 2.2
Textiles and textile articles 271.7 3.9 299.6 4.2 68.4 4.2 75.6 4.4 81.0 4.5 74.6 3.9
Articles of stone, plaster, cement,
glassware and ceramic products 132.0 1.9 152.0 2.2 32.6 2.0 40.6 2.4 42.8 2.4 36.1 1.9
Base metals and articles of base
metals 970.6 14.0 757.3 10.7 218.3 13.3 184.5 10.7 182.1 10.2 172.4 9.1
Machinery and mechanical
appliances; electrical equipment 950.6 13.7 1 088.0 15.4 254.1 15.5 277.1 16.2 266.5 14.9 290.2 15.3
Transport vehicles 375.3 5.4 314.1 4.5 82.6 5.0 90.8 5.3 70.7 4.0 70.0 3.7
Miscellaneous manufactured articles 183.3 2.6 208.3 3.0 47.5 2.9 52.2 3.0 54.4 3.1 54.2 2.9
Other goods 199.6 2.9 210.8 3.0 42.2 2.6 47.9 2.8 55.2 3.1 65.6 3.4
1
Data have been revised.
34.
90
LATVIAN FOREIGN TRADE PARTNERS
(exports – in FOB prices, imports – in CIF prices)
20121
2013
Millions of lats % of the total Millions of lats % of the total
Exports Imports Balance Exports Imports Exports Imports Balance Exports Imports
Total 6 937.4 8 793.7 –1 856.3 100.0 100.0 7 041.0 8 776.3 –1 735.3 100.0 100.0
EU15 countries 2 185.5 3 237.7 –1 052.2 31.5 36.8 2 187.9 3 251.4 –1 063.5 31.1 37.0
EU27 (EU28 as of Q3 of
2013) countries
4 823.0 6 803.0 –1 980.0 69.5 77.4 5 000.1 6 973.7 –1 973.6 71.0 79.5
incl. Germany 550.0 1 015.3 –465.3 7.9 11.5 513.8 988.7 –474.9 7.3 11.3
Sweden 359.3 296.4 62.9 5.2 3.4 358.3 297.5 60.9 5.1 3.4
UK 225.7 141.1 84.6 3.3 1.6 253.8 139.6 114.2 3.6 1.6
Finland 188.6 399.9 –211.3 2.7 4.5 186.8 408.9 –222.1 2.7 4.7
Denmark 273.1 198.5 74.6 3.9 2.3 291.3 194.8 96.5 4.1 2.2
Netherlands 189.0 298.3 –109.3 2.7 3.4 154.9 323.7 –168.7 2.2 3.7
Lithuania 1 110.2 1 747.3 –637.1 16.0 19.9 1 205.3 1 765.2 –559.9 17.1 20.1
Estonia 904.8 681.3 223.5 13.0 7.7 896.6 724.4 172.1 12.7 8.3
Poland 417.1 757.1 –340.0 6.0 8.6 462.6 867.6 –405.0 6.6 9.9
CIS 1 069.6 1 320.4 –250.8 15.4 15.0 1 118.2 1 091.7 26.5 15.9 12.4
incl. Russia 791.2 827.8 –36.6 11.4 9.4 811.5 743.7 67.8 11.5 8.5
Other countries 1 044.8 670.3 374.5 15.1 7.6 922.6 710.8 211.8 13.1 8.1
incl. USA 77.0 66.1 10.9 1.1 0.8 82.6 58.4 24.2 1.2 0.7
Norway 182.7 48.8 133.9 2.6 0.6 186.9 41.8 145.1 2.7 0.5
China 32.7 244.7 –212.0 0.5 2.8 59.0 236.6 –177.6 0.8 2.7
1
Data have been revised.
36.
91
CONVENIENCE AND EXTENDED CREDIT, REVOLVING LOANS AND OVERDRAFT TO RESIDENT NON-FINANCIAL
CORPORATIONS AND HOUSEHOLDS
(at end of period; millions of lats)
Non-financial corporations Households
In lats In euro In lats In euro
Revolving
loans and
overdraft
Convenience
credit
Extended
credit
Revolving
loans and
overdraft
Convenience
credit
Extended
credit
Revolving
loans and
overdraft
Convenience
credit
Extended
credit
Revolving
loans and
overdraft
Convenience
credit
Extended
credit
2012
X 251.7 1.0 0.9 501.1 0.3 0.1 50.5 15.9 98.6 17.2 1.3 2.6
XI 263.1 0.8 0.9 485.5 0.2 0.1 49.4 15.7 97.3 16.5 1.2 2.5
XII 267.8 0.9 0.9 451.9 0.2 0.1 47.9 14.1 95.7 14.5 1.2 2.4
2013
I 265.6 0.9 0.9 465.9 0.2 0.1 48.8 14.2 96.2 13.9 1.2 2.5
II 277.4 0.8 0.8 466.8 0.2 0.1 47.8 13.9 94.6 13.4 1.2 2.4
III 265.1 0.8 0.8 442.2 0.2 0.1 47.0 13.8 94.2 13.5 1.2 2.4
IV 269.8 0.9 0.9 441.3 0.2 0.1 46.6 13.8 94.0 13.6 1.2 2.5
V 276.9 0.8 0.9 436.9 0.2 0.1 42.9 13.8 94.5 13.3 1.2 2.5
VI 279.6 0.7 0.9 410.5 0.2 0.2 41.1 13.5 92.9 13.0 1.2 2.4
VII 271.6 0.8 0.9 421.1 0.2 0.1 40.9 13.5 92.5 12.8 1.2 2.5
VIII 270.2 0.8 0.9 435.7 0.2 0.1 40.9 13.3 91.8 12.9 1.2 2.4
IX 261.5 0.8 0.9 426.5 0.2 0.1 41.0 13.2 90.5 12.7 1.2 2.4
X 255.1 0.9 0.9 413.3 0.2 0.1 38.4 13.2 90.6 12.0 1.2 2.5
XI 260.1 0.9 0.9 412.4 0.3 0.1 37.3 13.1 89.1 12.2 1.2 2.5
XII 263.7 1.0 0.8 401.4 0.3 0.1 34.9 8.4 86.3 11.7 1.0 2.4
37.
LOANS TO RESIDENT NON-FINANCIAL CORPORATIONS IN THE BREAKDOWN BY RESIDUAL MATURITY AND BY
INTEREST RATE RESET PERIOD
(at end of period; millions of lats)
In lats In euro
With original maturity of over 1 year With original maturity of over 2 years With original maturity of over 1 year With original maturity of over 2 years
with a
residual
maturity of
up to 1 year
with a
residual
maturity of
over 1 year
and interest
rate reset
period
≤1 year
with a
residual
maturity of
up to
2 years
with a
residual
maturity of
over 2 years
and interest
rate reset
period
≤2 years
with a
residual
maturity of
up to 1 year
with a
residual
maturity of
over 1 year
and interest
rate reset
period
≤1 year
with a
residual
maturity of
up to
2 years
with a
residual
maturity of
over 2 years
and interest
rate reset
period
≤2 years
2012
XII 515.2 51.4 363.2 485.6 111.4 239.1 3 356.1 711.7 2 215.0 3 125.9 887.3 1 991.0
2013
III 527.0 66.4 360.1 500.0 124.6 240.0 3 267.2 655.8 2 193.0 3 071.9 894.2 1 949.7
VI 419.8 56.5 269.5 397.0 110.3 243.1 3 211.0 648.9 2 207.1 3 050.4 908.3 1 979.0
IX 434.1 59.9 256.9 404.3 116.1 223.6 3 181.4 607.3 2 240.8 3 028.7 862.7 2 008.4
XII 437.4 60.1 282.0 408.3 120.9 245.9 3 188.3 567.5 2 280.3 3 045.4 842.2 2 039.1
38.a
92
LOANS TO RESIDENT HOUSEHOLDS IN THE BREAKDOWN BY RESIDUAL MATURITY AND BY INTEREST RATE RESET
PERIOD
(at end of period; millions of lats)
In lats In euro
With original maturity of over 1 year With original maturity of over 2 years With original maturity of over 1 year With original maturity of over 2 years
with a
residual
maturity of
up to 1 year
with a
residual
maturity of
over 1 year
and interest
rate reset
period
≤1 year
with a
residual
maturity of
up to
2 years
with a
residual
maturity of
over 2 years
and interest
rate reset
period
≤2 years
with a
residual
maturity of
up to 1 year
with a
residual
maturity of
over 1 year
and interest
rate reset
period
≤1 year
with a
residual
maturity of
up to
2 years
with a
residual
maturity of
over 2 years
and interest
rate reset
period
≤2 years
2012
XII 336.3 33.2 158.2 317.8 52.2 168.2 3 746.0 157.4 3 118.4 3 705.6 248.2 3 167.7
2013
III 342.3 30.5 169.1 324.1 52.4 175.4 3 665.3 148.1 3 032.5 3 626.1 239.4 3 070.9
VI 349.4 29.9 178.3 330.9 53.8 183.2 3 603.4 147.6 2 977.6 3 564.7 242.8 3 007.5
IX 355.6 31.9 209.8 338.0 60.1 210.9 3 532.7 135.3 2 920.5 3 495.7 243.2 2 940.2
XII 349.7 32.1 215.0 333.9 61.5 210.8 3 453.2 125.3 2 870.7 3 416.8 238.7 2 879.6
38.b
Additional Information
General notes
The cut-off date for the information used in this report is 25 March 2014.
The Macroeconomic Developments Report published by Latvijas Banka is based on data
provided by the CSB, Ministry of Finance of the Republic of Latvia, FCMC, NASDAQ
OMX Riga and Latvijas Banka.
Data sources for charts are EC (Charts 1.1, 1.4, 3.4, 3.5, 4.3, 4.4, 4.14 and 5.5), CSB
(Charts 1.2–1.4, 3.1–3.4, 3.7–3.9, 4.1, 4.2, 4.5–4.9, 4.11–4.13, 5.1 and 5.2), Bloomberg
(Charts 2.1–2.4 and 2.6–2.8), Treasury (Charts 2.5 and 3.10–3.12)), Latvijas Banka (Charts
2.9–2.22, 4.9, 4.13, 5.1, 5.2, 6.1–6.4, 7.1 and 7.2), ECB (Chart 2.10), Road Traffic Safety
Directorate (Chart 3.6), SEA (Chart 4.9–4.11), Reuters (Chart 5.3) and Food and Agriculture
Organisation of the United Nations (Chart 5.4).
Data sources for Statistics tables are Latvijas Banka (Tables 1, 3–28, 30, 37 and 38),
NASDAQ OMX Riga (Table 1), Ministry of Finance of the Republic of Latvia (Tables 2ab
and 29) and CSB (Tables 2ab and 31–36).
Details may not add because of rounding-off.
FOB value is the price of a commodity on the border of the exporting country, including the
transportation and insurance costs only up to the border.
CIF value is the price of a commodity on the border of the importing country, including the
transportation and insurance costs only up to the border.
"–" – no transactions in the period; "x" – no data available, no computation of indicators
possible or insufficient number of respondents to publish information.
Money and banking sector
Calculation of monetary aggregates includes the balance sheet data of Latvijas Banka and
information from the financial position reports of other MFIs, prepared using methodology
of Latvijas Banka (see Latvijas Banka Regulation No. 40 "Regulation for Compiling the
Monthly Financial Position Report of Monetary Financial Institutions" of 16 July 2009,
based on Regulation (EC) No. 25/2009 of the ECB of 19 December 2008 concerning the
balance sheet of the monetary financial institutions sector (recast; ECB/2008/32).
In the publication, the following terms have been used:
MFIs – financial institutions forming the money-issuing sector. In Latvia, MFIs include
Latvijas Banka, credit institutions and other MFIs in compliance with the List of Monetary
Financial Institutions of the Republic of Latvia compiled by Latvijas Banka. In the EU,
MFIs include the ECB, the national central banks of the euro area, credit institutions and
other monetary financial institutions (money market funds) in compliance with the original
List of Monetary Financial Institutions published by the ECB.
Non-MFIs – entities other than MFIs.
Financial institutions – other financial intermediaries, excluding insurance corporations and
pension funds, (hereinafter, OFIs), financial auxiliaries, insurance corporations and pension
funds.
93
Additional InformationMACROECONOMIC DEVELOPMENTS REPORT
March 2014
OFIs – financial corporations that are primarily engaged in financial intermediation by
incurring liabilities in forms other than currency, deposits and close substitutes for deposits
from their customers other than MFIs, or insurance technical reserves. OFIs are corporations
engaged in lending (e.g. financial leasing companies, factoring companies, export/import
financing companies), investment funds, investment brokerage companies, financial vehicle
corporations, financial holding corporations, and venture capital corporations. OFIs data
include also financial auxiliaries' data.
Financial auxiliaries – financial corporations that are primarily engaged in auxiliary financial
activities, i.e. activities that are closely related to financial intermediation but are not
financial intermediation themselves, e.g. investment brokers who do not engage in financial
intermediation services on their own behalf, corporations that provide infrastructure for
financial markets, central supervisory institutions of financial institutions and the financial
market provided that they are separate institutional units. The Financial and Capital Market
Commission and the NASDAQ OMX Riga shall be regarded as financial auxiliaries.
Financial auxiliaries' data are included in OFIs data.
Non-financial corporations – economic entities producing goods or providing non-financial
services with the aim of gaining profit or other yield.
Households – natural persons or groups of natural persons whose principal activity is
consumption and who produce goods and services exclusively for their own consumption,
as well as non-profit institutions serving households. The following are also regarded as
households in the Republic of Latvia: persons engaged in individual entrepreneurship
provided that they have not registered their activity with the Commercial Register of the
Enterprise Register of the Republic of Latvia.
Holdings of securities other than shares – financial assets, which are instruments of the
holder, usually negotiable and traded or compensated on secondary markets and which do
not grant the holder any ownership rights over the issuing institutional unit.
The following information is published in accordance with the ECB methodology:
1) Assets and liabilities of Latvijas Banka (Table 6), expanding the range of reported
financial instruments;
2) Aggregated balance sheet of MFIs (excluding Latvijas Banka), i.e. the sum of the
harmonised balance sheets of Latvia's MFIs, excluding Latvijas Banka (Table 7);
3) Consolidated balance sheet of MFIs, obtained by netting out inter-MFI positions on the
aggregated MFI balance sheet (Table 8). Due to slight differences in accounting techniques,
the sum of inter-MFI positions does not always equal zero; therefore, the balance is included
in the item "Excess of inter-MFI liabilities";
4) Monetary aggregates and counterparts (Table 4) comprise Latvia's monetary aggregates
and their balance sheet counterparts derived from the consolidated balance sheet of MFIs.
See Table 5 for seasonally adjusted monetary aggregates. When seasonally adjusting the
time series, DEMETRA + Version 1.0.21605 of the programme is used. The following
monetary aggregates are calculated and published:
M1 – narrow monetary aggregate, comprising currency in circulation (the lats banknotes and
coins issued by Latvijas Banka excluding vault cash of MFIs) plus overnight deposits in all
currencies held with MFIs.
M2 – intermediate monetary aggregate comprising M1 and deposits redeemable at a period
of notice of up to and including 3 months (i.e. short-term savings deposits) made in all
94
Additional InformationMACROECONOMIC DEVELOPMENTS REPORT
March 2014
currencies and deposits with an agreed maturity of up to and including 2 years (i.e. short-
term time deposits) in all currencies held with MFIs.
M3 – broad monetary aggregate comprising M2, repurchase agreements, and debt securities
with a maturity of up to and including 2 years issued by MFIs, and money market fund
shares and units.
In compliance with the methodology of Latvijas Banka, the monetary base (Table 3) and
monetary survey (Table 10) is published. According to this methodology, the calculated
monetary aggregates comprise the following:
M0 – monetary base calculated on the basis of the methodology of Latvijas Banka and
comprising the lats banknotes and coins issued by Latvijas Banka and demand deposits of
resident MFIs and financial institutions (overnight deposits) with Latvijas Banka.
M2X – broad money, comprising currency in circulation (the lats banknotes and coins issued
by Latvijas Banka less vault cash of MFIs), MFI overnight deposits and time deposits in lats
(including deposits redeemable at notice and repos), as well as foreign currency deposits
with MFIs. M2X incorporate deposits made by local governments as a net item on the
demand side.
In view of the fact that Latvijas Banka collects more comprehensive information, the
following is also published:
1) Aggregated balance sheet of Latvia's MFIs (excluding Latvijas Banka) which is the sum
of the harmonised balance sheets (Tables 9ab);
2) Information characterising foreign assets and foreign liabilities of MFIs (excluding
Latvijas Banka; Tables 11ab), including a breakdown of selected balance sheet items by
country (Table 12);
3) Information characterising the maturity profile and types of deposits (including repos)
of Latvia's financial institutions, non-financial corporations and households with MFIs
(excluding Latvijas Banka; Tables 13 and 14abc) as well as Government and non-resident
deposits (Table 14d). Deposits redeemable at notice have been grouped by period of
notice. Long-term deposits include deposits with the original maturity of over 1 year. The
breakdown of MFI (excluding Latvijas Banka) deposits by currency is provided in Tables
20ab;
4) Information characterising the maturity profile and types of MFI (excluding Latvijas
Banka) loans to Latvia's financial institutions, non-financial corporations and households
(Tables 15, 16ab, 17 and 18) as well as Government and non-resident loans (Table 16c). The
breakdown of MFI (excluding Latvijas Banka) loans by currency is provided in Tables 20cd;
5) Information characterising MFI (excluding Latvijas Banka) securities holdings other than
shares (Tables 19ab and 20ef);
6) Information characterising debt securities issued by MFIs (excluding Latvijas Banka;
Table 20g).
Interest rates
In June 2010, Latvijas Banka introduced new methodology for interest rate statistics (see
Latvijas Banka Regulation No. 42 "Regulation for Compiling Interest Rate Reports of
Monetary Financial Institutions" of 10 September 2009). Using this methodology, credit
institutions, branches of foreign credit institutions and particular credit unions registered
95
Additional InformationMACROECONOMIC DEVELOPMENTS REPORT
March 2014
in the Republic of Latvia have to provide information on interest rates on deposits and
loans applied in transactions with resident non-financial corporations and households.
Introduction of the new methodology enabled harmonisation of the interest rate statistics
with the ECB requirements laid down in Regulation (EC) No. 290/2009 of the ECB of 31
March 2009 amending Regulation (EC) No. 63/2002 (ECB/2001/18) concerning statistics
on interest rates applied by monetary financial institutions to deposits and loans vis-à-vis
households and non-financial corporations (ECB/2009/7). The interest rate statistics provide
considerably wider information on macroeconomic development and structural changes.
Information on interest rates on deposits and loans applied in transactions with non-financial
corporations and households provided by credit institutions, branches of foreign credit
institutions and credit unions registered in the Republic of Latvia is collected (Table 21).
Interest rate statistics is collected on new business and outstanding amounts. All rates
included in the interest rate statistics are weighted average rates. When preparing the interest
rate statistics, credit institutions use annualised agreed rates (AAR) or narrowly defined
effective rates (NDER) and annual percentage rate of charge (APRC). Credit institutions
have to select the calculation of the AAR or the NDER based on the terms and conditions
of the agreement. The NDER can be calculated on any deposit or loan. In addition to the
AAR or the NDER, the APRC is reported for loans to households for house purchase and
consumer credits.
The interest rates on new business with overnight deposits and deposits redeemable at notice
and their outstanding amounts coincide.
Interest rates on new loans are reported on the basis of the initial rate fixation period set in
the agreement, whereas overdraft interest rates are reported on loan balances.
When reporting the interest rates on consumer credit and other credit to households with the
maturity of up to 1 year and loans to non-financial corporations with the maturity of up to
1 year, interest rates on overdraft are included.
Interbank market lending interest rates (Table 23a) are reported as weighted average
interest rates on new business, aggregating the information submitted by credit institutions,
prepared based on the methodology of Latvijas Banka (see Latvijas Banka Regulation No.
46 "Regulation for Compiling the "Report on Money Market Transactions" of 5 November
2009.)
Foreign exchange and exchange rates
Information characterising the foreign currency selling and buying transactions is reported
based on the methodology of Latvijas Banka (see Latvijas Banka Regulation No. 36
"Regulation for Purchasing and Selling Cash Foreign Currency" of 13 May 2009 and the
Latvijas Banka Regulation No. 41 "Regulation for Compiling Reports on Foreign Currency
Purchases and Sales" of 16 July 2009). The principal foreign exchange transactions (Table
24) comprise the cash and non-cash transactions conducted by credit institutions and
branches of foreign credit institutions, reported by transaction type and counterparty, and
currency. Non-cash foreign exchange transactions (Table 25) comprise non-cash transactions
performed by credit institutions and branches of foreign credit institutions, reported by major
currency.
Exchange rates set by Latvijas Banka (Table 26) are reported as monthly mathematical
averages. Weighted average exchange rates (cash transactions; Table 27) are reported based
on the information provided by credit institutions and branches of foreign credit institutions
as well as currency exchange bureaus.
96
Additional InformationMACROECONOMIC DEVELOPMENTS REPORT
March 2014

More Related Content

PDF
Monthly Newsletter 04/2016
PDF
"Macroeconomic Developments Report", January 2014
PDF
Macroeconomic Developments Report. June 2014
PDF
Macroeconomic Developments Report. December 2014
PDF
Macroeconomic Developments Report. June, 2015
PDF
Monthly Newsletter 03/2016
PDF
Monthly Newsletter 01/2016
PDF
Monthly Newsletter 05/2016
Monthly Newsletter 04/2016
"Macroeconomic Developments Report", January 2014
Macroeconomic Developments Report. June 2014
Macroeconomic Developments Report. December 2014
Macroeconomic Developments Report. June, 2015
Monthly Newsletter 03/2016
Monthly Newsletter 01/2016
Monthly Newsletter 05/2016

What's hot (20)

PDF
Macroeconomic Developments Report. December 2015
PDF
Macroeconomic Developments Report. June 2016
PDF
Latvijas Banka Monthly Newsletter 12/2016
PDF
Latvijas Bankas "Monthly Newsletter", 10/2016
PDF
Monthly Newsletter 11/2014
PDF
Latvijas Banka Monthly Newsletter 06/2017
PDF
Monthly Newsletter 9/2014
PDF
Monthly Newsletter 3/2014
PDF
Macroeconomic Developments Report, December 2016
PDF
Macroeconomic Developments Report, June 2017
PDF
"Macroeconomic Developments Report", October 2013
PDF
Latvijas Banka Monthly Newsletter 07/2017
PDF
Latvijas Banka Monthly Newsletter 01/2017
PDF
Monthly Newsletter 6/2014
PDF
Macroeconomic Developments Report. April 2013
PDF
Latvijas Banka Monthly Newsletter 04/2017
PDF
Latvijas Banka Monthly Newsletter 09/2017
PDF
Monthly Newsletter 1/2015
PDF
Latvijas Banka Monthly Newsletter 05/2017
PDF
Monthly Newsletter 2/2015
Macroeconomic Developments Report. December 2015
Macroeconomic Developments Report. June 2016
Latvijas Banka Monthly Newsletter 12/2016
Latvijas Bankas "Monthly Newsletter", 10/2016
Monthly Newsletter 11/2014
Latvijas Banka Monthly Newsletter 06/2017
Monthly Newsletter 9/2014
Monthly Newsletter 3/2014
Macroeconomic Developments Report, December 2016
Macroeconomic Developments Report, June 2017
"Macroeconomic Developments Report", October 2013
Latvijas Banka Monthly Newsletter 07/2017
Latvijas Banka Monthly Newsletter 01/2017
Monthly Newsletter 6/2014
Macroeconomic Developments Report. April 2013
Latvijas Banka Monthly Newsletter 04/2017
Latvijas Banka Monthly Newsletter 09/2017
Monthly Newsletter 1/2015
Latvijas Banka Monthly Newsletter 05/2017
Monthly Newsletter 2/2015
Ad

Viewers also liked (20)

PDF
Monthly Newsletter 7/2014
PDF
Monthly Newsletter 5/2014
PDF
Monthly Newsletter 10/2015
PDF
"Makroekonomisko Norišu Pārskats" 2015. gada jūnijs
PDF
Bezskaidras naudas maksājumi 2013
PPTX
Eiro zonas makroekonomiskās, monetārās un finanšu norises
PDF
Lekcija "Monetārā politika eiro zonā"
PDF
Lessons from Adjustment in Ireland
PPTX
Eiropas fiskālais ietvars: Quo vadis?
PDF
Lekcija "Pasaules tautsaimniecības attīstības tendences un tuvākās nākotnes p...
PDF
Lekcija "Konkurētspējas jēdziens mūsdienu ekonomiskās izaugsmes teorijās"
PDF
Mājsaimniecību-kredītņēmēju analīze: aptauja un finanšu ievainojamības novērt...
PDF
"Makroekonomisko Norišu Pārskats" 2015. gada decembris
PDF
Fx 5800 p
PDF
Tautsaimniecības konkurētspējas uztvere un tās analīzes veidi
PDF
Lekcija: Pasaules tautsaimniecības izaicinājumi un perspektīvas
PDF
Eiro zonas ekonomika un monetārā politika
PPTX
Lekcija: Eirozonas ekonomika un monetārā politika (ENG)
PPTX
Latvijas makroekonomiskās attīstības tendences un nākotnes izaicinājumi
PDF
Taximedia
Monthly Newsletter 7/2014
Monthly Newsletter 5/2014
Monthly Newsletter 10/2015
"Makroekonomisko Norišu Pārskats" 2015. gada jūnijs
Bezskaidras naudas maksājumi 2013
Eiro zonas makroekonomiskās, monetārās un finanšu norises
Lekcija "Monetārā politika eiro zonā"
Lessons from Adjustment in Ireland
Eiropas fiskālais ietvars: Quo vadis?
Lekcija "Pasaules tautsaimniecības attīstības tendences un tuvākās nākotnes p...
Lekcija "Konkurētspējas jēdziens mūsdienu ekonomiskās izaugsmes teorijās"
Mājsaimniecību-kredītņēmēju analīze: aptauja un finanšu ievainojamības novērt...
"Makroekonomisko Norišu Pārskats" 2015. gada decembris
Fx 5800 p
Tautsaimniecības konkurētspējas uztvere un tās analīzes veidi
Lekcija: Pasaules tautsaimniecības izaicinājumi un perspektīvas
Eiro zonas ekonomika un monetārā politika
Lekcija: Eirozonas ekonomika un monetārā politika (ENG)
Latvijas makroekonomiskās attīstības tendences un nākotnes izaicinājumi
Taximedia
Ad

Similar to "Macroeconomic Developments Report", March 2014 (20)

PDF
Monthly Newsletter 1/2014
PDF
Monthly Newsletter 2/2014
PDF
Macroeconomic Developments Report. July 2013
PDF
Macroeconomic Developments Report, December 2017
PDF
Macroeconomic Developments Report. June 2019
PDF
Monthly Newsletter 7/2013
PDF
Monthly Newsletter 5/2013
PDF
Monthly Newsletter 3/2015
PDF
Monthly Newsletter 6/2015
PDF
Monthly Newsletter 4/2013
PDF
Macroeconomic Developments Report. December 2019
PDF
Monthly Newsletter 4/2015
PDF
Monthly Newsletter 4/2014
PDF
Baltic Outlook November 2008
PDF
J.P. Morgan - "Spain is back"
PDF
Monthly Newsletter 5/2015
PDF
Macroeconomic Developments Report. June 2018
PDF
Monthly Newsletter 02/2016
PDF
Latvijas Banka Monthly Newsletter 02/2018
PDF
Monthly Newsletter 10/2013
Monthly Newsletter 1/2014
Monthly Newsletter 2/2014
Macroeconomic Developments Report. July 2013
Macroeconomic Developments Report, December 2017
Macroeconomic Developments Report. June 2019
Monthly Newsletter 7/2013
Monthly Newsletter 5/2013
Monthly Newsletter 3/2015
Monthly Newsletter 6/2015
Monthly Newsletter 4/2013
Macroeconomic Developments Report. December 2019
Monthly Newsletter 4/2015
Monthly Newsletter 4/2014
Baltic Outlook November 2008
J.P. Morgan - "Spain is back"
Monthly Newsletter 5/2015
Macroeconomic Developments Report. June 2018
Monthly Newsletter 02/2016
Latvijas Banka Monthly Newsletter 02/2018
Monthly Newsletter 10/2013

More from Latvijas Banka (20)

PDF
Ekspertu sarunas prezentācija 2024. gada 13. marts
PDF
MNI Connect
PDF
Latvijas cilvēkkapitāls ekonomikas mainīgajos apstākļos
PDF
Human capital as the key to economic development
PDF
Ekspertu saruna Latvijas Bankā 19.10.2023.
PDF
Makroekonomisko Norišu Pārskats. 2023. gada septembris
PDF
Latvijas tautsaimniecības makroekonomiskā attīstība | Septembris 2023
PDF
Digitālo finanšu drošība
PDF
Darba tirgus apskats un aktualitātes 2023
PDF
Nodokļu politika un tās iespējas 2023
PDF
Procentu likmju celšana inflācijas mazināšanai
PDF
Inflācijas ietekme uz personīgajām finansēm
PDF
Ekonomikas aktualitātes 2023
PDF
Makroekonomisko Norišu Pārskats. 2023. gada marts
PDF
MNI Connect
PDF
Ekspertu saruna par finanšu pratību
PPTX
Tautsaimniecības aktualitātes
PDF
Latvia`s Macro Profile 2023
PDF
Kurā pusē sētai zāle zaļāka
PDF
Latvijas tautsaimniecības makroekonomiskā attīstība | Marts 2023
Ekspertu sarunas prezentācija 2024. gada 13. marts
MNI Connect
Latvijas cilvēkkapitāls ekonomikas mainīgajos apstākļos
Human capital as the key to economic development
Ekspertu saruna Latvijas Bankā 19.10.2023.
Makroekonomisko Norišu Pārskats. 2023. gada septembris
Latvijas tautsaimniecības makroekonomiskā attīstība | Septembris 2023
Digitālo finanšu drošība
Darba tirgus apskats un aktualitātes 2023
Nodokļu politika un tās iespējas 2023
Procentu likmju celšana inflācijas mazināšanai
Inflācijas ietekme uz personīgajām finansēm
Ekonomikas aktualitātes 2023
Makroekonomisko Norišu Pārskats. 2023. gada marts
MNI Connect
Ekspertu saruna par finanšu pratību
Tautsaimniecības aktualitātes
Latvia`s Macro Profile 2023
Kurā pusē sētai zāle zaļāka
Latvijas tautsaimniecības makroekonomiskā attīstība | Marts 2023

Recently uploaded (20)

PDF
Unkipdf.pdf of work in the economy we are
PDF
HCWM AND HAI FOR BHCM STUDENTS(1).Pdf and ptts
PDF
Chapter 9 IFRS Ed-Ed4_2020 Intermediate Accounting
PPTX
social-studies-subject-for-high-school-globalization.pptx
PPT
Chap 1PP.ppt introductory micro economics
PDF
The Role of Islamic Faith, Ethics, Culture, and values in promoting fairness ...
PDF
Why Ignoring Passive Income for Retirees Could Cost You Big.pdf
PPTX
The discussion on the Economic in transportation .pptx
PPTX
PPT-Lesson-2-Recognize-a-Potential-Market-2-3.pptx
PPT
KPMG FA Benefits Report_FINAL_Jan 27_2010.ppt
PDF
Dialnet-DynamicHedgingOfPricesOfNaturalGasInMexico-8788871.pdf
PDF
DTC TRADIND CLUB MAKE YOUR TRADING BETTER
PDF
1a In Search of the Numbers ssrn 1488130 Oct 2009.pdf
PPTX
IGCSE ECONOMICS 0455 Foreign Exchange Rate
PPTX
Module5_Session1 (mlzrkfbbbbbbbbbbbz1).pptx
PDF
How to join illuminati agent in Uganda Kampala call 0782561496/0756664682
PDF
Lecture1.pdf buss1040 uses economics introduction
PDF
discourse-2025-02-building-a-trillion-dollar-dream.pdf
PDF
3a The Dynamic Implications of Sequence Risk on a Distribution Portfolio JFP ...
PPTX
2. RBI.pptx202029291023i38039013i92292992
Unkipdf.pdf of work in the economy we are
HCWM AND HAI FOR BHCM STUDENTS(1).Pdf and ptts
Chapter 9 IFRS Ed-Ed4_2020 Intermediate Accounting
social-studies-subject-for-high-school-globalization.pptx
Chap 1PP.ppt introductory micro economics
The Role of Islamic Faith, Ethics, Culture, and values in promoting fairness ...
Why Ignoring Passive Income for Retirees Could Cost You Big.pdf
The discussion on the Economic in transportation .pptx
PPT-Lesson-2-Recognize-a-Potential-Market-2-3.pptx
KPMG FA Benefits Report_FINAL_Jan 27_2010.ppt
Dialnet-DynamicHedgingOfPricesOfNaturalGasInMexico-8788871.pdf
DTC TRADIND CLUB MAKE YOUR TRADING BETTER
1a In Search of the Numbers ssrn 1488130 Oct 2009.pdf
IGCSE ECONOMICS 0455 Foreign Exchange Rate
Module5_Session1 (mlzrkfbbbbbbbbbbbz1).pptx
How to join illuminati agent in Uganda Kampala call 0782561496/0756664682
Lecture1.pdf buss1040 uses economics introduction
discourse-2025-02-building-a-trillion-dollar-dream.pdf
3a The Dynamic Implications of Sequence Risk on a Distribution Portfolio JFP ...
2. RBI.pptx202029291023i38039013i92292992

"Macroeconomic Developments Report", March 2014

  • 2. MACROECONOMIC DEVELOPMENTS REPORT March 2013 MACROECONOMIC DEVELOPMENTS REPORT March 2014, No 18 © Latvijas Banka, 2014 The source is to be indicated when reproduced. Latvijas Banka K. Valdemāra iela 2A, Riga, LV-1050, Latvia Tel.: +371 67022300 Fax: +371 67022420 http://www.bank.lv [email protected]
  • 3. 2 MACROECONOMIC DEVELOPMENTS REPORT March 2014 CONTENTS Contents Abbreviations 3 Executive Summary 4 1. External sector and exports 6 1.1 External economic environment 6 1.2 Latvia's competitiveness and dynamics of goods exports 7 2. Monetary Policy and Financial Markets 10 2.1 Global financial markets 10 2.2 Securities market 12 2.3 The ECB monetary policy decisions, Eurosystem operations, liquidity and money market developments 14 2.4 Lending and deposit rates 15 2.5 Dynamics of domestic loans and deposits 17 3. Domestic Demand 21 3.1 Private consumption and investment 21 3.2 Government expenditure and budget 24 4. Aggregate Supply 25 4.1 Industry and construction 25 4.2 Services 28 4.3 Labour market 30 5. Costs and Prices 33 6. Balance of Payments 36 7. Conclusions and Forecasts 38 7.1 Economic developments 38 7.2 Inflation 39 Statistics 41 Additional Information 93
  • 4. 3 MACROECONOMIC DEVELOPMENTS REPORT March 2014 Abbreviations CIF – cost, insurance and freight at the importer's border CIS – Commonwealth of Independent States CPI – Consumer Price Index CSB – Central Statistical Bureau of Latvia EC – European Commission ECB – European Central Bank EMU – Economic and Monetary Union ESA 95 – European System of Accounts 1995 EU – European Union EU15 – EU countries before 1 May 2004 EU27 – EU countries from 1 January 2007 to 30 June 2013 EU28 – EU countries from 1 July 2013 EURIBOR – Euro Interbank Offered Rate Eurostat – Statistical Office of the European Union FCMC – Financial and Capital Market Commission FOB – free on board at the exporter's border FRS – Federal Reserve System GDP – gross domestic product HICP – Harmonised Index of Consumer Prices IMF – International Monetary Fund JSC – joint stock company MFI – monetary financial institution NA – no answer n.i. – no information OFI – other financial intermediary (other than an insurance corporation or a pension fund) OMXR – NASDAQ OMX Riga index PMI – Purchasing Managers Index RIGIBOR – Riga Interbank Offered Rate SEA – State Employment Agency SJSC – state joint stock company ULC – unit labour costs UK – United Kingdom UN – United Nations US – United States of America VAT – value added tax WTO – World Trade Organisation ABBREVIATIONS
  • 5. 4 MACROECONOMIC DEVELOPMENTS REPORT March 2014 EXECUTIVE SUMMARY Executive Summary In January 2014, the IMF revised upward the global GDP growth perspective for 2014 in comparison with October 2013 and downgraded the respective forecast for 2015. Of Latvia's major trade partners, the growth forecast was lowered significantly for Russia, since, with the depreciation of the Russian ruble persisting, the slowdown of the economic growth continued at the end of 2013. As a result of the political crisis in Ukraine, the negative trends in its economy grew more pronounced. Unfavourable dynamics was also observed in Estonia, with its GDP moving down by 0.1% in the fourth quarter. As to the euro area, the seasonally and working-day adjusted GDP picked up stronger-than-expected in the fourth quarter. At the end of 2013, Latvia's foreign trade activity weakened due to the high base and seasonal factors; however, high competitiveness of the Latvian economy persisted. The current account deficit of Latvia's balance of payments decreased to 0.8% of GDP in 2013. In the fourth quarter, the market shares of Latvian exports in global imports continued to expand. With the economy of EU countries strengthening gradually, Latvian exports to EU countries resumed their growth. In 2014, higher external demand in EU countries, the sustainable capability of Latvian manufacturers to compete in markets with weak demand, and the anticipated pick-up in investment activity are expected to ensure an increase in the growth of exports of goods. Still the external environment in general, inter alia investment activity, is likely to be affected by uncertainty and the negative sentiment effects related to the developments in Russia and Ukraine. As of 1 January 2014, Latvijas Banka became a full-fledged member of the Eurosystem, implementing the single monetary policy of the Economic and Monetary Union together with other national central banks of the euro area and the ECB. In January–March, the ECB did not change the interest rate on the main refinancing operations and the interest rates on the marginal lending facility and the deposit facility also remained unchanged at 0.25%, 0.75% and 0.00% respectively. Despite the low level of interest rates, Latvian credit institutions have been active participants in fixed-term deposit tenders with a maturity of 1 week since the beginning of 2014. December was the last month when the lats was the sole legal tender in Latvia. In line with expectations, with the euro changeover approaching, the amount of cash in lats in circulation shrank sharply as savings were deposited with credit institutions and the volume of non-cash transactions increased. And January 2014 – the first month since the introduction of the euro – saw the anticipated trend that the changeover to the euro was also a changeover to a more active employment of non-cash settlements. Most of the funds households and enterprises deposited with credit institutions in December were also kept there in January. Loans granted to resident households, financial institutions and non-financial corporations continued on a downward trend in December and January. Households are expected to refrain from taking new loans also in the future, and their debt level will gradually fall, while lending to selected businesses, e.g. exporting companies, traders and service providers is likely to increase. Overall, however, sustainable loan portfolio growth could rebound only over the next couple of years. Latvia's GDP growth remained among the strongest in the EU in the fourth quarter. Private consumption was the main growth engine throughout the year. On the supply side, the services sector was the major contributor to the annual GDP growth. Latvijas Banka's GDP growth forecast for 2014 remained unchanged at 4.0%. Risks related to the external environment are on the downside, and they have increased significantly; consequently, risks to the forecast are generally considered to be on the downside.
  • 6. 5 MACROECONOMIC DEVELOPMENTS REPORT March 2014 EXECUTIVE SUMMARY The rate of real unemployment continued to moderate in the fourth quarter. The decline in unemployment in Latvia, having been quite notable in the previous three years, is expected to decelerate in 2014. In the future, sustainable decrease in unemployment will take place mostly on account of a fall in structural unemployment, and it cannot happen quickly. A moderate increase in the average monthly gross nominal wage in the fourth quarter suggests there is no reason for concern over deterioration of competitiveness and pressure on inflation at this stage. Both the nominal and the real unit labour cost levels still remain considerably lower than in 2008. Although annual core inflation posted a rise in January and February, neither the monthly nor the annual price rises exceeded the averages observed in the respective months over the last ten years. We will be able to draw conclusions regarding the impact of the euro changeover on prices only at the end of the year; nevertheless, the data available to date suggest that the effect of the euro changeover on the average consumer prices could be at the level estimated in 2013 (approximately 0.2 percentage point). In January and February 2014, annual inflation still remained low (0.4% and 0.5% respectively), while approaching inflation rates associated with economic growth. Inflation continued to be low due to supply-side factors – the annual rate of increase in prices of fuel and heating energy still remained negative. Currently Latvijas Banka's forecast of the average annual inflation for 2014 remains unchanged at 1.7%; however, risks to the above forecast are considered to be on the downside, mostly on account of the postponement of electricity market liberalisation for households.
  • 7. 6 MACROECONOMIC DEVELOPMENTS REPORT March 2014 Table 1 GDP GROWTH FORECASTS FOR LATVIA'S MAJOR TRADE PARTNERS IN 2013 AND 2014 (%) 20141 20142 20143 20151 20152 20153 Total global economy 4.0 3.6 3.7 4.4 4.0 3.9 US 3.0 2.6 2.8 3.6 3.4 3.0 Euro area 1.1 1.0 1.0 1.4 1.4 1.4 Germany 1.5 1.4 1.6 1.3 1.4 1.4 UK 1.5 1.9 2.4 1.8 2.0 2.2 Russia 3.8 3.0 2.0 3.7 3.5 2.5 Denmark 1.3 1.2 n.i. 1.5 1.5 n.i. Sweden 2.2 2.3 n.i. 2.3 2.3 n.i. Finland 1.2 1.1 n.i. 1.5 1.4 n.i. Estonia 3.2 2.5 n.i. 3.4 3.5 n.i. Lithuania 3.3 3.4 n.i. 3.5 3.5 n.i. Poland 2.2 2.4 n.i. 2.7 2.7 n.i. Sources: April 2013 (1), October 2013 (2) and January 2014 (3) World Economic Outlook (IMF). 1. EXTERNAL SECTOR AND EXPORTS 1. External Sector and Exports 1.1 External economic environment In January 2014, the IMF revised upward the global GDP growth perspective for 2014 in comparison to October 2013 and downgraded the respective forecast for 2015. The 2014 downward revisions particularly affected Russia, while those for 2015 concerned Russia and the US. At the same time, projections were upgraded for the UK and, for 2014, also for Germany (see Table 1). In the fourth quarter of 2013, the euro area seasonally and working-day adjusted GDP picked up stronger- than-expected 0.3% quarter-on-quarter (see Chart 1.1). The contribution to the GDP growth from private consumption (0.1 percentage point), investment (0.2 percentage point) and net exports (0.4 percentage point) was positive, while that from inventories was negative (03.percentage point). The growth in the euro area was enhanced by the advancing French and German economies. In addition, the euro area unemployment declined somewhat. The euro area peripheral countries sent likewise positive signals. The rating agency Moody's revised Spain's credit rating upward in February, the fourth quarter GDP in Italy picked up for the first time since the second quarter of 2011, and Portugal bought back 1.3 billion euro in bonds, due to be redeemed in 2014 and 2015, to ease the debt repayment time frame. In Greece, in turn, the 2013 current account of the payment balance recorded a surplus for the first time over almost 70 years. Germany's GDP posted a 0.4% quarter-on-quarter increase in the fourth quarter. Even though the domestic demand was falling in the fourth quarter, the GDP growth was on account of exports, which were expanding, albeit were also subdued by weak growth in Germany's trade partner countries. Export growth might weaken in 2014, while the domestic demand is likely to strengthen due to anticipated income rise. In Estonia, the fourth quarter GDP dropped 0.1% quarter-on-quarter in 2013. In the face of a sluggish external demand, Estonia's exports contracted towards the end of the year. Despite a year-on-year lower overall unemployment level, the decline in unemployment slowed down quarter-on-quarter, with even a slight rise recorded in the fourth quarter. Chart 1.1 annual and QUARTERLY GDP GROWTH RATE IN Q4 2013 in latvia's MAJOR trade partner countries (%)
  • 8. 7 MACROECONOMIC DEVELOPMENTS REPORT March 2014 In the fourth quarter, Lithuania's GDP accelerated by 1.2% quarter-on-quarter. The rise in GDP was driven by private consumption augmented by rising wages. In the meantime, the role of exports in economic growth diminished due to external demand losing momentum. In the fourth quarter of 2013, Poland recorded a 0.6% quarter-on-quarter GDP pickup. At the close of the year, the labour market situation eased somewhat, yet the unemployment rate still lingered at a relatively high level (10.1% in December). The quarter-on-quarter rise in UK's GDP was 0.7% in the fourth quarter of 2013, with the sustainability of economic activity being spurred by more favourable lending standards and improved confidence. Unemployment rate decelerated at the end of the year almost reaching the Bank of England's target of 7%. In Sweden in the fourth quarter of 2013, GDP gained 1.7% quarter-on-quarter. The economic development was strengthened by the expansion in industrial production, and consumption, both private and government, grew. With private consumption and investment shrinking in Denmark, its GDP contracted by 0.5% quarter-on- quarter in the fourth quarter of 2013. Despite an overall GDP growth over the year in Russia, its pace lagged notably behind that of the previous year. Towards the end of the year, depreciation of the Russian ruble continued. Export growth was curbed by the relatively weak external demand and somewhat low oil and gas prices, while, with unemployment soaring, the demand weakened also domestically. Russia's involvement in the events in Ukraine resulted in a further depreciation of the Russian ruble and also stock market price falls. In an attempt to mitigate the risks related to financial stability and inflation, the Central Bank of the Russian Federation raised its main refinancing rate. Taking into account the previous downgrading of Russia's economic forecast for 2014 and 2015 (more impressive than for other countries), a further escalation of the situation in Ukraine and the uncertainty about the future direction of developments herein may figure as an extra obstruction to Russia's economic growth. 1.2 Latvia's competitiveness and dynamics of goods exports Towards the close of 2013, Latvia's foreign trade activity moderated due to the high basis and effects of 1. External Sector and Exports
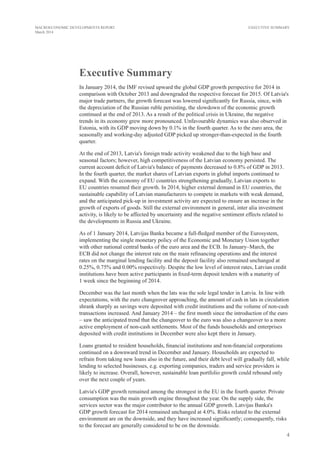
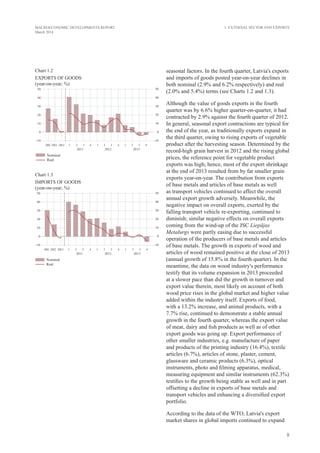
  • 9. 8 MACROECONOMIC DEVELOPMENTS REPORT March 2014 seasonal factors. In the fourth quarter, Latvia's exports and imports of goods posted year-on-year declines in both nominal (2.9% and 6.2% respectively) and real (2.0% and 5.4%) terms (see Charts 1.2 and 1.3). Although the value of goods exports in the fourth quarter was by 6.6% higher quarter-on-quarter, it had contracted by 2.9% against the fourth quarter of 2012. In general, seasonal export contractions are typical for the end of the year, as traditionally exports expand in the third quarter, owing to rising exports of vegetable product after the harvesting season. Determined by the record-high grain harvest in 2012 and the rising global prices, the reference point for vegetable product exports was high; hence, most of the export shrinkage at the end of 2013 resulted from by far smaller grain exports year-on-year. The contribution from exports of base metals and articles of base metals as well as transport vehicles continued to affect the overall annual export growth adversely. Meanwhile, the negative impact on overall exports, exerted by the falling transport vehicle re-exporting, continued to diminish; similar negative effects on overall exports coming from the wind-up of the JSC Liepājas Metalurgs were partly easing due to successful operation of the producers of base metals and articles of base metals. The growth in exports of wood and articles of wood remained positive at the close of 2013 (annual growth of 15.8% in the fourth quarter). In the meantime, the data on wood industry's performance testify that its volume expansion in 2013 proceeded at a slower pace than did the growth in turnover and export value therein, most likely on account of both wood price rises in the global market and higher value added within the industry itself. Exports of food, with a 13.2% increase, and animal products, with a 7.7% rise, continued to demonstrate a stable annual growth in the fourth quarter, whereas the export value of meat, dairy and fish products as well as of other export goods was going up. Export performance of other smaller industries, e.g. manufacture of paper and products of the printing industry (16.4%), textile articles (6.7%), articles of stone, plaster, cement, glassware and ceramic products (6.3%), optical instruments, photo and filming apparatus, medical, measuring equipment and similar instruments (62.3%) testifies to the growth being stable as well and in part offsetting a decline in exports of base metals and transport vehicles and enhancing a diversified export portfolio. According to the data of the WTO, Latvia's export market shares in global imports continued to expand 1. External Sector and Exports Chart 1.2 EXPORTS OF GOODS (year-on-year; %) Chart 1.3 IMPORTS OF GOODS (year-on-year; %)
  • 10. 9 MACROECONOMIC DEVELOPMENTS REPORT March 2014 1. External Sector and Exports in the fourth quarter. As the EU economy gradually strengthened, Latvia's exports to the EU countries recommenced expanding (see Chart 1.4). In the fourth quarter, imports of goods contracted more than did the respective exports. Regarding imports, shrinkages were reported by almost all commodity groups, except wood. Imports of the latter continued on an upward trend, thus testifying to limited accessibility to raw materials and offsetting their shortages by imported resources on an ever larger scale. At the end of the year, imports of goods contracted primarily on account of the completion of major investment projects as well as a weak new investment activity, underpinned by external uncertainties. The dampening effect on imports of intermediate goods of the wind-up of the JSC Liepājas Metalurgs continued, whereas the contractions in imports of mineral products resulted from dropping oil prices. It is true however, that these contractions in goods imports may also evidence that Latvia's dependence on imports has diminished, for imported goods can be well replaced by the local output on an ever growing scale. The declining imports of goods also signal a narrowing of the re-exporting activities, for instance, in the car market. In the fourth quarter, export and import prices decreased somewhat year-on-year (by 0.9%). The respective prices for vegetable products fell most. Overall terms of trade posted a slight quarter-on- quarter improvement in the fourth quarter (0.1%). The terms of trade in transport vehicles improved notably, whereas those for machinery and mechanical appliances, electrical equipment deteriorated most. Confidence indicators published by the EC show that Latvia's economic sentiment, including also so far volatile business sentiment, has improved. The domestic demand has served as a primary driver, as the export order volume assessment deteriorated in January. In the first quarter of 2014, the assessment of both export order volumes and competitiveness worsened, businesses' future perception of competitiveness within and outside the EU including. All above said notwithstanding, it can be expected that the rising external demand in several Latvia's export market countries, sustained competitiveness of Latvia's producers in markets where the demand is weak, and anticipated buoyancy of investment activity all will contribute to a more resilient growth in exports of goods in 2014. Chart 1.4 LATVIA'S EXPORTS AGAINST MAJOR TRADE PARTNER countries' IMPORTS (moving average; Q1 2010–Q3 2013; %) * Estonia and Lithuania – right-hand scale.
  • 11. 10 MACROECONOMIC DEVELOPMENTS REPORT March 2014 2. Monetary Policy and Financial Markets 2.1 Global financial markets In the first two months of 2014, a number of central banks continued to pursue accommodative monetary policy. This move was determined by low inflation and inflation expectations as well as gradually recovering economic activity. The FRS was an exception, for it proceeded with the wind-down of the asset purchase programme. Similar to the ECB, other central banks kept their refinancing rates close to zero as well (see Chart 2.1). Following a decision passed in December 2013, the FRS tapered its government bond-buying programme from 85 billion US dollars to 75 billion US dollars in January 2014, and to 65 billion US dollars from February. Hence, beginning in February, the volume of the US government bond-buying programme is 35 billion US dollars per month in longer-term Treasury securities and 30 billion US dollars per month in agency mortgage-backed securities. The FRS based this decision on the US economy continuing to show progress. Analysts' forecasts suggest that market participants expect the FRS to keep up such monthly pace of asset-buying tapering. The global financial market experienced high volatility and a change in investors' risk perceptions in January when China, a significant driver of global economy, reported falling production activity. Along with other factors, like moderating growth rate in the emerging markets and further tapering of stimulus measures in the US, the weakening of China's manufacturing sector at the beginning of the year gave rise to investors' worries about the prospects of economic recovery in all emerging market countries and spurred up the outflow of investment from the latter countries. Investors returned to investing in safer-deemed government bonds of developed countries, which caused a sizable price drop in stock markets where investing was considered more risky, while the government bond prices of developed countries soared. With the outflow of capital from emerging market economies, the demand for currencies of these countries weakened, thus making them depreciate against the currencies of developed countries. Against the euro, the Turkish lira depreciated by 2.9%, whereas the Ukrainian hryvnia, affected by the political crisis, lost 17% of its 2. Monetary Policy and Financial Markets Chart 2.1 EuRO money market interest rates (%)
  • 12. 11 MACROECONOMIC DEVELOPMENTS REPORT March 2014 value in the reference period. Similarly, the Russian ruble depreciated sharply against the currencies of developed countries. It was driven by several factors, among them weak performance data of Russia's economy, dropping commodity prices, and the national central bank's transition from managed floating exchange rate regime to floating exchange rate regime, hence increasing the market's role in exchange rate determination. In the period between 1 January and 25 February, the exchange rate of the Russian ruble against the euro fell by 8.0%. The value continued to decrease, with investors responding to Russia's intervention in Crimea, the latter causing international community to condemn it and give warnings of eventual sanctions against Russia. The value of the Russian ruble was adversely affected by the growing concerns about Ukrainian solvency, considering substantial linkages of the Russian economy with the crisis-hit country. Sensing devaluation danger, investors and the Russian people hurried to dispose of the Russian ruble, thus making its value slip to a record-low level (50.64 rubles per 1 euro). Under the impact of financial market turmoil, the Central Bank of the Russian Federation raised the main refinancing rate from 5.5% to 7%. From the beginning of 2014 to 4 March overall, the Russian ruble depreciated against the euro by 11.0%. In contrast to significant exchange rate fluctuations in emerging market economies, the developed countries saw marginal exchange rate fluctuations. In the reporting period, the US dollar fluctuated against the euro within the margin of 1.35 US dollars per euro to 1.38 US dollars per euro. The euro preserved stability also against the Swiss franc and the British pound sterling (see Chart 2.2). As in the reporting period overall the investors opted for investing in safer-deemed securities, the yields on the government bonds of developed countries tended to go down along with the increasing demand. The yield on the US government 2-year bonds dropped from 0.38% to 0.32%, whereas that on the 10-year bonds decreased from 3.0% to 2.7% in the reporting period. Meanwhile, the yield on the German government short-term bonds from 0.21% declined to 0.13%, whereas that on the respective long-term bonds contracted from 1.93% to 1.62% (see Chart 2.3). 2. Monetary Policy and Financial Markets Chart 2.2 euro Exchange rate against US dollar, Swiss franc and UK pound sterling (index: 1 January 2014 = 100) Chart 2.3 10-YEAR GERMAN AND US GOVERNMENT BOND YIELDS (%)
  • 13. 12 MACROECONOMIC DEVELOPMENTS REPORT March 2014 2. Monetary Policy and Financial Markets 2.2 Securities market The primary tenders of the Latvian government securities were not organised in January, but in December 2013 the primary tenders of 6-month and 12-month Treasury bills were held, while in February 2014 – the primary tenders of 12-month Treasury bills and 5-year bonds (see Chart 2.4). The total amount supplied amounted to 66.3 million equivalent in euro, the demand reached 218.6 million euro, and the entire amount supplied was sold. The average yield on 6-month Treasury bills remained unchanged (0.23%) in comparison with the previous tenders. It decreased by 2 basis points for 12-month Treasury bills (to 0.37%), but for 5-month bonds – by 17 basis points (to 1.79%). At the end of February, the overall issuance in net terms in circulation was 972.4 million euro (by 2.4% more than at the end of November). In January, Latvia issued 7-year eurobonds in the external market. The demand was 4.5 billion euro but the issued amount – 1 billion euro. The average bond selling rate applied was 2.815% (the mid-swap rate plus 120 basis points) and the coupon rate – 2.625%. The bonds were bought by approximately 300 investors; majority of them were from Europe and the rest – from the US. This rate was lower than that for the EC loan maturing at the end of March (3.125%). The Treasury data suggest that at the end of January the balance of the Treasury accounts with credit institutions, including Latvijas Banka, was 2.3 billion euro. The bid yield on Latvian government euro- denominated bonds maturing in 2018 decreased from 1.71% at the end of November to 1.43% on 28 February (see Chart 2.5); the spread between the above and the German government bonds of the respective maturity narrowed from 118 basis points to 98 basis points. The bid yield on Latvian government bonds denominated in US dollars and maturing in 2021 declined from 4.04% to 3.65%, and the spread between the above and that of the US government bonds of the same maturity shrank from 177 basis points to 141 basis points. Comparing yields on 10-year government bonds in EU countries in the national currency, in December and January the EU countries can be divided into two groups. In the first group of countries this yield on 10-year bonds edged up (the strongest growth was in December, however, in January it also remained below 2.5%). Bond yields rose as a result of the FRS decision Chart 2.4 AUCTIONS OF GOVERNMENT DEBT SECURITIES (millions of euro) Chart 2.5 Latvian GOVERNMENT BOND bid YIELDS (%)
  • 14. 13 MACROECONOMIC DEVELOPMENTS REPORT March 2014 to reduce the amount of the securities purchased, better sentiment indicators and economic growth forecasts in Europe in 2014. In the second group of countries the yields on 10-year government bonds (with a few exceptions) decreased, standing within the range of 2.5%–8.7% in December and January. Latvia ranked 16th among the 27 EU countries (Estonia does not have government long-term securities). In November, the weighted average yield on Latvian government 10-year bonds was 3.71%, it stood at 3.62% in December and in January it was down to 3.48%. In January, compared to November, the spreads between Latvian government bonds vis-à-vis German, Swedish and French government bonds shrank by 31 basis points, 30 basis points and 34 basis points respectively. When comparing Latvia with the countries where the yield level of government 10-year bonds is higher, it should be concluded that the spread between Italian and Latvian government bonds remained unchanged, it decreased by 9 basis points between Spanish and Latvian government bonds, and it dropped 54 basis points between Portuguese and Latvian government bonds. The yield risk premium on bonds of the euro area countries facing difficulties continued to decline as these countries started to see signs of economic recovery. Developments in Greece and other peripheral countries sent positive signals to financial markets. The preliminary data suggested that in 2013 Greece showed better GDP and fiscal surplus data than expected. In the fourth quarter of 2013, Portugal experienced economic growth, and it continued negotiations on exiting the international bailout programme already in May 2014. Of the euro area countries facing difficulties, the spread between the yield on long-term government bonds of Portugal, Slovenia and Greece and that of the German government bonds of the respective maturity decreased most notably (see Chart 2.6). On 28 February, NASDAQ OMX Riga share price index OMXR increased by 3.5% in comparison with 1 January. At the same time, the Baltic share price index OMXBBGI rose by 2.5%. In contrast, higher volatility was observed in foreign stock markets in January primarily associated with developments in emerging market economies, but in February stock prices slightly stabilised. From 1 January to 28 February the European stock market index DJ EURO STOXX 50 edged up by 1.3%, the US stock market index S & P 500 augmented a little by 0.6%, but the Japanese stock market index Nikkei 225 2. Monetary Policy and Financial Markets Chart 2.6 SPREAD BETWEEN 10-YEAR GOVERNMENT BOND yields OF EURO AREA PERIPHERAL COUNTRIES AND the respective GERMAN GOVERNMENT BOND yield (percentage points)
  • 15. 14 MACROECONOMIC DEVELOPMENTS REPORT March 2014 experienced correction going down by 8.9% during the first two months of 2014 after the astoundingly high rise in 2013 (see Chart 2.7). 2.3 The ECB monetary policy decisions, Eurosystem operations, liquidity and money market developments In January–March, the ECB did not change the interest rate on the main refinancing operations and the interest rates on the marginal lending facility and the deposit facility also remained unchanged at 0.25%, 0.75% and 0.00% respectively. The ECB did not employ other monetary policy instruments either, although inflation in the euro area remained low. The ECB's decisions were based on signals that the situation in the euro area was quite controversial: on the one hand, consumer and producer confidence was gradually improving; on the other hand, economic recovery was slow and uneven. In turn, medium- term inflation expectations still remain stable at the level in line with the Governing Council's target. ECB representatives also continued to show their commitment to keep interest rates low in the future, and expressed their readiness to use all available instruments at the ECB's disposal when necessary to meet its primary objective of maintaining price stability in the euro area. Decisions of the ECB Governing Council were no surprise to market participants, therefore, they did not have a significant impact on behaviour of financial market participants. The ECB carried out the main refinancing operations (on a weekly basis) as fixed rate tenders with full allotment and a maturity of 1 week. Interest of Eurosystem credit institutions in the main refinancing operations declined; the amount allotted in tenders contracted from 169 billion euro at the end of 2013 to 94 billion euro at the end of February 2014. 2. Monetary Policy and Financial Markets Chart 2.7 STOCK PRICE INDICES (1 January 2014 = 100)
  • 16. 15 MACROECONOMIC DEVELOPMENTS REPORT March 2014 With regard to longer-term refinancing operations, the ECB lent funds to euro area credit institutions twice a month with full allotment and a maturity of 1 month and 3 months, with an interest rate equal to the average interest rate on the main refinancing operations during the life of the respective longer- term refinancing operation. During the reporting period credit institutions took the opportunity to make an early partial repayment of funds borrowed in December 2011 and March 2012 when the ECB carried out longer-term refinancing operations with a maturity of 3 years. In February 2014, credit institutions of the euro area countries had repaid the ECB 487.7 billion euro or 48% of funding allotted through these operations. Once a week the ECB organised fixed-term deposit tenders with a maturity of 1 week to sterilise the increase in the money supply associated with the Securities Markets Programme. The maximum amount of deposits accepted from Eurosystem credit institutions within this operation on 8 and 15 January were 179.0 billion euro and 175.5 billion euro in all February tenders. The weighted average interest rate on time deposits in the tenders organised during the reporting period was 0.17%–0.24%. Excess liquidity (the reserve account of credit institutions plus the deposit facility minus the marginal lending facility minus reserve requirements) in the euro area fell from 283.5 billion euro on 3 January to 125.3 billion euro on 28 February. This deceleration was caused by several factors: the decline (88.3 billion euro) in the main and longer-term refinancing operations, the increase in time deposits (70.7 billion euro), the growth of government deposits (43.8 billion euro) and the cutback of banknotes in circulation (19.1 billion euro). Consequently, the fall in liquidity was not on account of the autonomous factors but on account of credit institutions themselves by participating in ECB monetary operations. The contraction in excess liquidity in the Eurosystem had an upward impact on the euro money market rates. Although interest rates on short-term interbank loans gradually stabilised after the volatility caused by the end of 2013 effect, they remained close to the high level of the post-crisis period. EONIA fluctuated within the range of 0.10%–0.45% (averaging 0.18% from 1 January to 28 February). At the same time, fluctuations of the 3-month EURIBOR were considerably less pronounced (within the range of 0.28%–0.30%), and EONIA volatility did not have a direct impact on EURIBOR (see Chart 2.8). Chart 2.8 base ratES (%) 2. Monetary Policy and Financial Markets
  • 17. 16 MACROECONOMIC DEVELOPMENTS REPORT March 2014 2.4 Lending and deposit rates With lending supply and demand factors remaining basically unchanged, lending rates continued to fluctuate within a small range, remaining, however, higher than deposit rates, and thus ensuring profitability of credit institutions (see Chart 2.9). After joining the euro area, interest rates on new euro loans in the Latvian financial market were lower than in the euro area countries hardest hit by the European sovereign debt crisis; however, they were higher than in other euro area countries not so badly affected by the crisis (see Chart 2.10). This leads to the conclusion that convergence possibilities of Latvian lending rates still exist, and if the Latvian government continues to implement a prudent and sustainable fiscal policy and economic competitiveness improves further, interest rates on loans granted in Latvia should decrease in the medium-term approaching the interest rate level of the euro area countries less affected by the European sovereign debt crisis. The weighted average interest rate on new loans in all currencies to non-financial corporations increased in December 2013, while in January 2014 it dropped to 3.5% reaching a lower level than in November (3.9%). Overall, the weighted average interest rate on new loans in euro to non-financial corporations continued to fluctuate within a small range (see Chart 2.11) as the lending supply and demand factors did not change significantly: in 2013 the interest rate on large size loans (exceeding 1 million euro) was 2.6%–4.3% but on loans of up to 1 million euro it was higher (4.0%–4.9%). The weighted average interest rate on new loans in all currencies to households for house purchase moderated in comparison with November (3.5%) shrinking to 3.1% in January as the respective interest rate on loans granted in euro fell, and loans granted in lats with a higher interest rate were replaced by loans in other currencies with a lower interest rate. The weighted average interest rate on loans in euro to households for house purchase also tended to fluctuate within a small range (3.1%–3.5%) in 2013. In January, the interest rate on loans to households for house purchase reached the lowest level since 2004 (3.1%), i.e. from the moment when statistics on these interest rates is available. The weighted average interest rate on new consumer credit in all currencies in comparison with November recorded a slight increase (from 20.2% in November to 21.0% in January). The upward trend of interest 2. Monetary Policy and Financial Markets Chart 2.9 SPREAD BETWEEN INTEREST RATES ON NEW LOANS AND NEW DEPOSITS (percentage points) Chart 2.10 INTEREST RATES ON MFI new loans in EURO to non-financial corporations in 2013 (%) Chart 2.11 INTEREST RATES ON MFI SHORT-TERM LOANS IN euro* (%) * Floating interest rates and interest rates with an initial interest rate fixation period of up to 1 year.
  • 18. 17 MACROECONOMIC DEVELOPMENTS REPORT March 2014 rates on consumer credits observed since the beginning of 2013 persisted as new loans in the consumer credit market were increasingly granted by smaller credit institutions having lower credit risk requirements. Although interest rates on new deposits made by households and non-financial corporations remained low, they increased somewhat in December 2013 and January 2014 as credit institutions carried out seasonal campaigns to attract new deposits by offering slightly more favourable rates. At the end of 2013, credit institutions increased interest rates particularly on deposits in euro at a slightly accelerated pace to facilitate timely replacement of deposits in lats with those in euro. The rising interest rates of these deposits were also affected by the upward fluctuations of the euro money market index at the close of 2013 and in January 2014 as excess liquidity in the euro area money market contracted. Overall, the weighted average interest rate on new deposits attracted in all currencies from households and non-financial corporations edged up from 0.2% in November 2013 to 0.3% in January 2014. 2.5 Dynamics of domestic loans and deposits December was the last month when the lats was the only legal tender in Latvia. In line with expectations, with the euro changeover approaching, the amount of cash in lats in circulation shrank sharply as both households and enterprises deposited their savings with credit institutions and the number of non-cash transactions increased. In December, the total money supply augmented due to a rise in government spending and economic growth. In turn, January 2014 – the first month since the introduction of the single European currency – confirmed the forecast that the changeover to the euro was also a changeover to a more active employment of non-cash settlements. Most of the funds households and enterprises deposited with credit institutions in December were kept there also in January suggesting that cash was losing the important role it played in settlements before. The monetary aggregate M3 grew by 2.7% in December, and its annual growth rate reached 2.8% (see Chart 2.12). The amount of lats in circulation declined by 360.3 million euro in the last month of 2013 and in comparison with the end of 2012 it decreased by 56.6%, but the cash component in broad money shrank to 6.7% in December (15.8% in December 2012; see Chart 2.13). This was one of the 2. Monetary Policy and Financial Markets Chart 2.12 ANNUAL RATE OF CHANGE IN MONETARY AGGREGATES (%) Chart 2.13 Currency in circulation (%)
  • 19. 18 MACROECONOMIC DEVELOPMENTS REPORT March 2014 2. Monetary Policy and Financial Markets Chart 2.14 ANNUAL RATE OF CHANGE IN RESIDENT DEPOSITs (%) Chart 2.15 ANNUAL RESIDENT DEPOSIT dynamics (billions of euro) Chart 2.16 non-mfi deposit dynamics (billions of euro) factors determining the record high monthly growth of deposits by financial institutions, non-financial corporations and households (721.8 million euro). Household deposits posted a rapid increase of 6.3% in December, with the annual growth rate amounting to 13.2%, and deposits of non-financial corporations grew at an even faster pace by 11.7% and 14.8% month-on-month and year-on-year respectively. At the end of December, domestic deposits with credit institutions reached 9.2 billion euro overall. In January, deposits seasonally decreased, albeit standing at significantly higher levels than in November. Household deposits went down by a mere 1.4% month-on-month, with the annual growth rate remaining unchanged, but deposits by non-financial corporations declined by 5.8%, and their annual rate of increase was 6.1% (see Charts 2.14 and 2.15). Although funds attracted from foreign parent credit institutions continued to diminish, the uplift of the total foreign liabilities of credit institutions was determined by non-resident non-MFI deposits (see Charts 2.16 and 2.17).
  • 20. 19 MACROECONOMIC DEVELOPMENTS REPORT March 2014 Although December was characterised by a significant decrease in the loan portfolio for several years due to both increased repayment of loans and write- off of bad loans, it was only the household loans that dropped modestly in December 2013, with the aggregate loan portfolio decreasing by a mere 0.6%. In turn, loans to financial institutions and non- financial corporations augmented; their annual rate of decrease and the negative annual growth rate of the total deposits reached 4.9% and 6.4% respectively. In January 2014, the aggregate loan portfolio of credit institutions contracted by 3.5%; however, two thirds of the decline were on account of structural changes – the SJSC Latvijas Hipotēku un zemes banka and JSC UniCredit Bank gave up their credit institution licences as of January. Loans to non-financial corporations and households in January decreased by 4.8% and 1.5% respectively. Thus, in January the annual rate of decrease of loans reached 9.4% (see Charts 2.18 and 2.19); however, excluding data on the credit institutions which surrendered their licences, the annual rate of decrease of loans was only 3.4%, and household indebtedness continued on a slow but steady downward trend as household loans gradually contracted. After the merger of the lats and euro loan portfolios, at the end of January 95.1% of all domestic loans were granted in euro and 4.9% – in foreign currencies thus minimising borrowers' currency risk. Chart 2.17 CREDIT INSTITUTION FOREIGN LIABILITIES (billions of euro) Chart 2.18 ANNUAL RATE OF CHANGE IN LOANS TO RESIDENTS (%) Chart 2.19 MONTHLY CHANGE IN LOANS TO RESIDENT HOUSEHOLDS AND NON-FINANCIAL CORPORATIONS (millions of euro) 2. Monetary Policy and Financial Markets
  • 21. 20 MACROECONOMIC DEVELOPMENTS REPORT March 2014 In November and December 2013, credit investments in forestry, individual subsectors of manufacturing (wood production and printing), energy, water supply, wholesale and retail trade, storage, information and financial services increased. The annual growth rate of loans in forestry, fishing, individual subsectors of manufacturing, water supply, wholesale trade, land transport and other sectors was positive in December (for changes in the structure of the domestic loan portfolio see Charts 2.20 and 2.21). With GDP increasing, the ratio of loans to GDP continued to decline (in 2013 – 58.1%; in 2012 – 65.5%). Since the total resident deposits increased and the loan portfolio contracted, the ratio of loans to residents and resident deposits dropped to 1.46 in January (1.61 in November; see Chart 2.22). The positive economic growth and changes in habits enhanced by the introduction of the euro will foster an increasing elimination of cash settlements by boosting popularity of payment card transactions and internet banking. Against the background of improving external demand and ongoing positive economic growth, deposits by non-financial corporations and households with credit institutions will continue to expand in 2014; however, the rate of increase will not be fast. Development trends of loans to enterprises will determine the lending dynamics, while households will still refrain from taking new loans, and their debt level will gradually fall. Although the aggregate loan portfolio of credit institutions will continue to diminish, statements by representatives of individual major credit institutions suggest that exporting companies, traders and service providers could be creditworthy customers. Overall, however, sustainable loan portfolio growth could rebound only over the next couple of years. Chart 2.20 CHANGES IN the STRUCTURE OF the DOMESTIC LOAN PORTFOLIO (millions of euro) Chart 2.21 CHANGES IN LOANS TO RESIDENTS (billions of euro) Chart 2.22 RESIDENT LOAN TO DEPOSIT RATIO 2. Monetary Policy and Financial Markets
  • 22. 21 MACROECONOMIC DEVELOPMENTS REPORT March 2014 Chart 3.1 CHANGES IN GDP (constant prices; %) Chart 3.2 contribution to ANNUAL CHANGES IN GDP (demand side; percentage points) Chart 3.3 Indicators characterising consumption (2010 = 100; consumer confidence, net responses; %) 3. Domestic Demand Latvia's GDP growth remained one of the strongest in the EU in the fourth quarter. The GDP increased by 0.8% quarter-on-quarter in seasonally non- adjusted terms and by 3.6% year-on-year (see Chart 3.1). Private consumption remained the main growth engine throughout the year (see Chart 3.2). The purchasing power of households continued to improve, primarily on account of rising employment and real wages. Household confidence improved more notably towards the turn of the year, supported by the well-organised euro changeover in combination with the prevalence of consumer-friendly price developments. Investment growth was weak in 2013 and gross fixed capital formation contracted by 10.3% in the fourth quarter. In 2013, investment developments were affected by external uncertainties, the "wait-and-see" attitude with regard to the euro changeover and the completion of some major investment projects. The growth of the real exports of goods and services decelerated and even entered a negative territory in the third quarter. In the fourth quarter, the exports were at the level observed a year ago. Considering the high base (including the good harvest of 2012) and the decline in exports by JSC Liepājas Metalurgs, the performance of exports and the manufacturing sector in the fourth quarter should be viewed as decent. Real imports of goods and services continued to contract in the fourth quarter, falling by 3.0% and, given the unchanged level of exports, made a positive contribution to GDP growth (1.8 percentage points). 3.1 Private consumption and investment Private consumption remained the main driver of economic growth in 2013 (see Chart 3.3), increasing further by 4.3% in the fourth quarter and contributing 2.6 percentage points to the overall GDP growth. At the turn of the year, price developments were consumer-friendly. Consumption increased towards the end of the year inter alia on account of reducing the previously-accumulated savings. Although households placed part of their cash savings on current accounts in anticipation of the euro changeover, a certain share of those savings was spent, thereby resulting in higher consumption (see Chart 3.4). Consumer confidence (see Chart 3.5) improved more notably in the last two months of the 3. Domestic Demand
  • 23. 22 MACROECONOMIC DEVELOPMENTS REPORT March 2014 3. Domestic Demand year, implying that the euro changeover proceeded more smoothly than expected. The developments in retail trade turnover also pointed to rising consumption: the increase in sales towards the turn of the year was more substantial in the case of food (includes all sales, inter alia the sales of non- food items at shops primarily selling food), clothing and furniture. The developments with regard to the number of cars newly-registered with the Road Traffic Safety Department (see Chart 3.6) and car sales were volatile: following a more notable increase in September and October, the sales volumes dropped in November and December. Chart 3.4 CHANGES IN GDP AND PRIVATE CONSUMPTION (year-on-year; %) Chart 3.5 CONSUMER CONFIDENCE AND UNDERLYING FACTORS (net responses; percentage points) Chart 3.6 NUMBER OF vehicles NEWLY REGISTERED WITH THE ROAD TRAFFIC SAFETY DEPARTMENT (thousands)
  • 24. 23 MACROECONOMIC DEVELOPMENTS REPORT March 2014 Investment growth was weak in 2013 overall (see Charts 3.7 and 3.8), and a 10.3% fall was reported in the fourth quarter. According to the data on non- financial investment, the drop was slightly more pronounced for investment in public administration and public services; nevertheless, private investment also contracted as suggested by the shrinking imports of capital goods (see Chart 3.9). The decline of investment was affected by external uncertainties, the "wait-and-see" attitude with regard to the euro changeover and the completion of some major investment projects. Better industrial and export performance towards the end of the year allowed hoping for more favourable investment developments in the future. However, the events in Ukraine have renewed and even exacerbated the concerns with regard to the opportunities to attract investment. Therefore, the EU funding inflows will be particularly important to support development. Chart 3.7 Indicators characterising investment (2010 = 100; %) Chart 3.8 CONTRIBUTION OF PRIVATE AND GOVERNMENT INVESTMENT TO GDP (%) Chart 3.9 NON-FINANCIAL INVESTMENT BY SECTOR (% of total non-financial investment) 3. Domestic Demand
  • 25. 24 MACROECONOMIC DEVELOPMENTS REPORT March 2014 3.2 Government expenditure and budget According to the official information by the Treasury, the surplus of the consolidated general government budget estimated on a cash flow basis amounted to 91.3 million euro or 0.4% of the forecast GDP in January 2014, representing a year-on-year increase of 10.5 million euro (see Chart 3.10). However, there was a deficit of 128.3 million euro or 0.6% of GDP in 2013 overall in the consolidated general government budget estimated on a cash flow basis as opposed to a 27.2 million euro surplus accumulated at the end of 2012. The rise in the revenue of the consolidated general government budget decelerated to 1.1% in January 2014 in comparison with the 4.0% increase reported a year ago. Although the VAT revenue grew by 23.6%, the revenue from social insurance contributions and personal income tax, albeit rising towards the end of 2013, was overall smaller. January tax collections (see Chart 3.11) were broadly as planned: the revenue target was exceeded, although less than in the respective period of the previous year (100.3% and 104.9% of the target in January 2014 and January 2013 respectively). Non-tax revenue was 13.5 million euro smaller year-on-year, mainly on account of the shrinking repayments of the unspent funding from the EU funds to the central government basic budget. The general government consolidated budget expenditure decreased by 0.6% year-on-year in January (see Chart 3.12). The decline in spending was largely a result of lower disbursements of social benefits (by 27.8 million euro or 14.4%), as part of them were made at the end of 2013. The general government debt totalled 9 195.2 million euro on a cash flow basis at the end of January 2014 (37.0% of the forecast GDP for 2014; estimated as 39.8% of the forecast GDP for 2014 according to ESA 95 methodology). There is an increase of 923.0 million euro in comparison with January 2013 which is largely attributable to the 7-year Eurobonds issued by Latvia in January 2014 in the amount of 1 billion euro and maturing in January 2021. Debt is expected to decrease due to a partial repayment (1 billion euro) of the principal amount of the loan received from the EC scheduled for the end of March and the maturing of 10-year government bonds in the amount of 400 million euro in April. Chart 3.10 ACCRUED BALANCE OF THE CONSOLIDATED GENERAL GOVERNMENT BUDGET BY level (billions of euro) Chart 3.11 SELECTED TAX REVENUE (January; millions of euro) Chart 3.12 RATE OF CHANGE IN CONSOLIDATED GENERAL GOVERNMENT BUDGET EXPENDITURE (year-on-year; %) 3. Domestic Demand
  • 26. 25 MACROECONOMIC DEVELOPMENTS REPORT March 2014 4. Aggregate Supply 4.1 Industry and construction In the fourth quarter, the value added of manufacturing at constant prices recorded a year-on- year expansion of 2.6% (contribution to the annual GDP growth – 0.3 percentage point). At the same time, the value added of manufacturing (seasonally adjusted) recorded a quarter-on-quarter rise of 1.5% in the fourth quarter. In the fourth quarter, the volume of output in manufacturing at constant prices increased by 2.0% quarter-on-quarter and grew by 2.7% year-on-year (see Chart 4.1). Higher output (6.2%) of the largest subsector of manufacturing – the manufacture of products of wood – accounted for the major positive contribution to the development of manufacturing in the fourth quarter. Expanding manufacture of food products (2.7%), basic metals (18.3%) and chemicals (8.9%) also supported the manufacturing growth. At the same time, the quarterly decline in the output of the volatile manufacture of other transport equipment (51.9%) as well as a reduction in the manufacture of beverages (9.4%) and wearing apparel (5.1%) exerted a negative impact. Year-on-year, the manufacture of food products, products of wood as well as the manufacture of computer, electronic and optical products had a positive impact on the growth of manufacturing in the fourth quarter. The manufacture of basic metals exerted the most pronounced adverse effect in annual terms. The manufacture of basic pharmaceutical products and pharmaceutical preparations and other transport equipment and the repair and installation of machinery and equipment also affected the dynamics of manufacturing negatively (see Chart 4.2 for the changes in the manufacturing output in the fourth quarter of 2013 in comparison with the respective period of the previous year). After falling for two quarters the turnover in manufacturing at current prices recorded a year-on- year rise of 1.4% in the fourth quarter. Meanwhile, the turnover in the external market continued on a downward trend for the third consecutive quarter (a 3.1% drop in the fourth quarter). The turnover rose by 9.2% in the domestic market, and this was the highest increase since the beginning of 2012, pointing to a growth in the domestic demand. Chart 4.1 DYNAMICS OF MANUFACTURING OUTPUT (at constant prices; %) Chart 4.2 ANNUAL INDUSTRIAL OUTPUT CHANGES IN THE FouRTh quarter OF 2013 (working-day adjusted; %) 4. Aggregate Supply
  • 27. 26 MACROECONOMIC DEVELOPMENTS REPORT March 2014 4. Aggregate Supply The industrial confidence indicator of manufacturing aggregated by the EC for the fourth quarter was 0.8 point higher quarter-on-quarter. It was primarily attributable to a higher assessment of order volume as well as the assessment of output volume for the coming months. The sales prices and employment assessment for the coming months improved considerably, while the assessment of the export order volume recorded the only subdued decline. Hence the signals from Latvia's business surveys regarding the fourth quarter are to be considered positive overall. Production capacity utilisation projected for the first quarter of 2014 has remained almost unchanged (72.2% in the fourth quarter of 2013 and 72.1% in the first quarter of 2014; see Chart 4.3). In the breakdown by sector, production capacity utilisation was high in the manufacture of wood and of products of wood and cork (80.2%), paper products (78.3%), printing and reproduction of recorded media (78.1%) and electrical equipment (76.8%). Production capacity utilisation recorded the most buoyant expansion in the manufacture of electrical equipment (an increase of 9.8 percentage points), motor vehicles, trailers and semi-trailers (a rise of 9.0 percentage points) and pharmaceutical preparations (a growth of 7.3 percentage points). At the same time, the manufacture of basic metals (41.6%; 6.5 percentage points – the sharpest drop in this sector), beverages (59.8%), non-metallic mineral products (64.2%) as well as the manufacture of textile articles (64.6%) accounted for low projected production capacity utilisation. A notable decline in the production capacity utilisation has also been projected in the food industry (4.4 percentage points; to 66.0%). Businesses reported the lack of demand as a growth- restrictive factor also in the first quarter of 2014 (37.7% of the total number of respondents; see Chart 4.4); however, this indicator continued on a downward trend. A larger number of respondents than in the previous quarter pointed to the lack of equipment (11.9%) and the lack of available financing (5.7%). In the latest business survey, however, the number of respondents identifying no substantial constraint for the production was an all-time high (35.5%). As regards manufacturing, preliminary data for January were particularly negative. In January, the volume of output shrank by 17.3% in comparison with December (seasonally adjusted), whereas the annual fall was 11.3%. In the post-crisis period seasonality of manufacturing changed every year, this being the Chart 4.3 PRODUCTION CAPACITY UTILISATION IN MANUFACTURING (%) Chart 4.4 GROWTH-RESTRICTIVE factors IN mANUFACTURING (% of replies from respondents)
  • 28. 27 MACROECONOMIC DEVELOPMENTS REPORT March 2014 most likely reason why the seasonality filters allowed the drop in the non-adjusted data to be as strongly reflected in the seasonally adjusted data. However, not all can be explained by seasonality. The deterioration of the non-adjusted data this January has been considerable even for the usually volatile beginning of the year. The negative development of manufacturing was attributable to the subsector of the manufacture of basic metals, showing a very steep fall in output. In annual terms, it was still mainly on account of the impact of the wind-up of JSC Liepājas Metalurgs, since January 2013 was the last month when the company operated at full capacity. At the same time, the decline against December 2013 is in line with the information published recently in mass media about the problems encountered by some metalworking companies as well as the long-term stagnation in the metallurgical industry of the EU. However, other data do not point to any serious problems in the industry. The Latvian business confidence indicators improved in January and February due to a lower assessment of the inventories of finished goods. High business confidence indicator is consistent with the one observed at the beginning of 2008. In 2014, the growth in manufacturing will depend to a large extent on the developments in the external environment, since exports account for about 62% of the overall turnover. The development outlook for the euro area gives rise to hopes that the external demand for Latvia's export goods will follow an upward path. The construction sector in the major trade partner countries is also recovering, suggesting that, for instance, the wood industry could be expected to expand further also in 2014, if the access to raw materials is sufficient. However, in 2014 the domestic developments are expected to play a more significant role in manufacturing than before. Private consumption has become the main driver of GDP growth as a result of a rise in disposable income and more active spending of savings. In line with that, data on manufacturing also reflect an ever increasing rise in turnover in the domestic market, whereas the turnover in exports has shrunk over the last quarters. In 2014, the recovery of investment activity may be reasonably anticipated in the sector since a new round of inflows of financing from the EU funds begins. Successful implementation of the investment projects should lead to an expanding volume of output and higher value added in the sector. In the fourth quarter, the value added of the construction sector recorded a year-on-year rise of 4. Aggregate Supply
  • 29. 28 MACROECONOMIC DEVELOPMENTS REPORT March 2014 3.9%. The value added (seasonally adjusted) of the construction sector declined by 0.5% quarter-on- quarter. The contribution of the construction sector to the annual GDP growth was 0.3 percentage point. At the same time, construction output at current prices recorded a year-on-year increase of 5.2% in the fourth quarter (see Chart 4.5). The construction of engineering structures (3.5 percentage points), including that of pipelines and communication lines (3.9 percentage points) and bridges and tunnels (1.1 percentage points), accounted for the major contribution to the annual growth. The construction of apartment blocks (contribution – 3.1 percentage points) was the main driver of the expanding construction of residential buildings (contribution – 3.3 percentage points). The negative contribution of non-residential buildings segment, observed in the previous two quarters, persisted (1.6 percentage points); however, the construction of administrative buildings was a notable positive contributor (3.2 percentage points) to the sector. The construction confidence indicator assessed by the EC declined by 1.6 percentage points in the fourth quarter. This development was mainly attributable to a sharply deteriorating assessment of employment expectations for the next three months. Builders primarily pointed to a lack of demand (43.2%) and weather conditions (23.8%) as the constraint for business growth. One-fourth of builders did not refer to any construction hampering factors. In January the construction confidence indicator improved (associated with a higher assessment of employment for the next three months); however, in February the confidence indicator deteriorated moderately, mainly on account of a lower order assessment. 4.2 Services In the fourth quarter of 2013, the value added of the services sector at constant prices recorded a year- on-year increase of 4.3%. The overall contribution of the services sector to the annual GDP growth was 2.7 percentage points (see Chart 4.6 for the changes in value added of the main types of services). Public administration (0.6 percentage point), real estate activities (0.5 percentage point) and professional services (0.4 percentage point) were the major positive contributors to GDP growth in the fourth quarter of 2013. Growth in retail trade turnover also continued in the fourth quarter (see Chart 4.7). Retail trade turnover Chart 4.5 CONTRIBUTION OF SOME TYPES OF CONSTRUCTION objects TO ANNUAL CONStRUCTION GROWTH AT CURRENT PRICES (percentage points) Chart 4.6 CHANGES IN VALUE ADDED BY MAIN TYPES OF SERVICES (year-on-year; seasonally adjusted data; %) 4. Aggregate Supply
  • 30. 29 MACROECONOMIC DEVELOPMENTS REPORT March 2014 Chart 4.7 BREAKDOWN BY QUARTERLY CHANGES IN RETAIL TRADE TURNOVER (percentage points) Chart 4.8 ANNUAL CHAnGES IN FREIGHT TURNOVER BY MAIN TYPE OF FREIGHT TRAFFIC (%) increased by 1.0% quarter-on-quarter (including the sales of motor vehicles – by 0.8%). The rise was mainly attributable to an increasing sales volume of food products, furniture and household goods, probably on account of the households spending their lats savings prior to the euro changeover. It should be noted that the breakdown is based on the main operating activity of the companies; hence the expanding sales volume of supermarkets may be associated not only with the purchase of food products, but also with the purchase of household goods, wearing apparel and other consumer durables. Retail trade turnover rose by 4.0% year-on-year (including the sales of motor vehicles – by 6.0%). In the fourth quarter, the value added of the transportation and storage sector reported a year- on-year rise of 0.1% (see Chart 4.8 for the annual changes in freight turnover by the main types of transport). The value added of the sector shrank by 0.6% quarter-on-quarter (seasonally adjusted data), increasing by 1.3% in 2013 overall. With the negative trend observed at the end of 2012 persisting, cargoes loaded and unloaded overall at Latvia's ports in the fourth quarter of 2013 declined by 0.8% year-on-year. The situation had improved more over the last quarter of the year than was usually observed. The sharply declining volume of cargoes loaded and unloaded at Liepāja port (34.3%) contributed most to the shrinking overall cargo traffic, albeit the ports of Riga and Ventspils recorded a pickup (4.7% and 3.2% respectively). A notable reduction in cargo volume at Liepāja port is, most likely, associated with both the wind-up of the JSC Liepājas Metalurgs and the fact that harvests were smaller in 2013 than in 2012. The turnover of freight traffic by rail (indicator based on the distance covered and freight weight) grew by 4.9% in the fourth quarter, discontinuing the downward trend that started in the fourth quarter of 2012. The increasing turnover was on account of a rise in international freightage (6.1%). At the same time, the turnover of domestic freight shrank steeply (by 30.7%). The volume of freight traffic by rail (indicator based on the freight weight only) rose more than the turnover (by 6.3%) over the year. It was underpinned by expanding imports (11.6%). However, exports and freight transit declined (by 14.2% and 19.2% respectively). In the fourth quarter, the volume of freight traffic by road increased by 11.7% year-on-year, whereas the 4. Aggregate Supply
  • 31. 30 MACROECONOMIC DEVELOPMENTS REPORT March 2014 turnover of freight traffic by road (indicator based on the distance covered and freight weight) fell by 3.4%. The overall annual reduction was for the most part determined by the decreasing turnover of international freight traffic by road (3.0%); however, the domestic turnover of road freight also shrank (by 4.6%). Preliminary data for the first quarter of 2014 point to a minor improvement of the situation. The increase in the volume and turnover of rail freight that started in the fourth quarter of 2013 continued in January and February. Freight traffic at ports also recorded an expansion. Improving performance of the transport sector might be associated with the trend of a gradual economic recovery observed in the EU; however, concern about the sustainability of the situation persists. 4.3 Labour market Real unemployment or the rate of jobseekers continued to decline in the fourth quarter of 2013 reaching 11.3% of the economically active population, despite of the lay-offs at JSC Liepājas Metalurgs (the estimated impact of the wind-up of this company on unemployment is about 0.2 percentage point). Consequently, the rise in registered unemployment observed in the last three months (9.8% at the end of January; see Chart 4.9) reflects the impact of the problems associated with the wind-up of JSC Liepājas Metalurgs and the seasonal effects rather than suggests any shifts in the underlying labour market trends. The rate of jobseekers in the euro area stabilised towards the turn of 2013 at the level of 12%, close to the historical maximum. The high unemployment rate of the euro area, however, was determined by the rates reported by individual Member States (e.g. Spain and Greece), as their competitiveness deteriorated sharply during the period of the economic boom and they attempted to postpone the fiscal austerity measures after the onset of the crisis. In several other euro area Member States (including Latvia), the current unemployment rate is close to the average of the last 15 years, whereas in some Member States (e.g. Germany and Estonia) it is considerably below the historical average. An increase in job vacancies also points to improved employment opportunities. As at the end of January 2014, there were 4.7 thousand vacancies registered in the SEA databases (about 1 000 vacancies more than Chart 4.9 registered unemployment rate and RATE OF jobseekers (%) 4. Aggregate Supply
  • 32. 31 MACROECONOMIC DEVELOPMENTS REPORT March 2014 in January 2013; see Chart 4.10). On average, 5% of the registered unemployed found a permanent job in a period of one month, the same as in 2006. The number of long-term unemployed decreased gradually as well as their proportion in the total number of unemployed (see Chart 4.11). Average monthly gross nominal wage continued to increase moderately in the fourth quarter, rising by 4.8% and thereby easing the concerns over potential deterioration of competitiveness and creating no significant upward pressure on inflation. Both private and public sector wages increased at a similar rate (see Chart 4.12). One of the factors suggesting that Latvia is currently in a state of a macroeconomic balance is the fact that the average wage is in line with the labour productivity (see Chart 4.13). Consequently, sustainable wage increases can only be achieved through raising productivity. 4. Aggregate Supply Chart 4.10 BEVERidGE CURVE: NUMBER OF UNEMPLOYED PERSONS REGISTERED WITH THE SEAAND THAT OF VACANCIES (in thousands) Chart 4.11 long-term unEMPLOYEd* (%) * Persons registered with the SEA for a period of over 1 year. Chart 4.12 ANNUAL CHAnGES IN average nominal and real full-time monthly wage (%)
  • 33. 32 MACROECONOMIC DEVELOPMENTS REPORT March 2014 Businesses' views on the presence of labour shortage have stabilised at a moderate level, suggesting that any wage increases will be based on productivity gains; hence they will be sustainable and will not impair the competitiveness of the economy (see Chart 4.14). Nominal unit labour costs followed a gradual upward trend, confirming the sustainability of the revival in competitiveness. Both nominal and real unit labour costs were notably lower than in 2008. The decline in unemployment in Latvia which was quite notable in the previous three years is expected to decelerate in 2014. A sustainable decrease in Latvia's unemployment can only be achieved through reducing the structural unemployment, which could be supported by both robust economic development as well as the implementation of active labour market policy initiatives. Yet this cannot happen quickly. Therefore, Latvia's medium-term economic growth will be increasingly more based on productivity gains rather than higher employment. According to the CSB labour survey, the annual rise in the number of employed was 0.8% in the fourth quarter, which is one of the weakest performances since overcoming the economic crisis. The SRS data on the number of employed also point to decelerating employment growth. Considering the notable GDP growth, the annual increase of labour productivity could reach about 3% which, in turn, is one of the best achievements of late. Consequently, Latvia's economic growth is gradually shifting from an extensive development to an intensive one, supporting sustainable wage increases. 4. Aggregate Supply Chart 4.13 REAL WAGE AND SALARY AND LABOUR PRODUCTIVITY INDEx (historical average = 100; seasonally adjusted data) Chart 4.14 THE RATE OF BUSINESSES WHO FIND LABOUR SHORTAGE THE MAIN OBSTACLE FOR BUSINESS GROWTH (%)
  • 34. 33 MACROECONOMIC DEVELOPMENTS REPORT March 2014 5. Costs and Prices 5. Costs and Prices In January and February 2014, annual inflation remained low (0.4% and 0.5% respectively), while approaching inflation rates associated with economic growth. Inflation continued to be low due to supply- side factors – the annual rate of increase in fuel and heating prices still remained negative (see Chart 5.1). The negative contribution of energy prices (see Chart 5.2) is related to both the base effect of the cogeneration projects launched or expanded in 2013 and offering a lower heating tariff and the price level of fuel resources (oil products) which remained relatively stable and did not affect the dynamics of fuel prices significantly. Although the contribution of heating prices was still negative, it declined somewhat as contrary to January 2013, a moderate heating price increase (e.g. in Valmiera) was observed in January 2014. However, already in February the dynamics of the prices of resources (natural gas) contributed to a further decrease in heating prices in Latvia, while in March the heating tariff was reduced in Daugavpils under the impact of the factors unrelated to fuel resources, and this will be reflected in inflation data in the future. The price of Brent crude oil fluctuated in a relatively narrow band (107–112 US dollars per barrel) in January–March, falling slightly at the end of the reporting period (see Chart 5.3). The price of Brent crude oil was primarily affected by the demand and supply ratio. According to the International Energy Agency's estimates, the global demand for crude oil is projected to strengthen moderately in the second quarter of 2014. Likewise, an increase in supply which will be more rapid than an increase in demand, thus exerting a downward effect on crude oil prices is expected. Chart 5.1 CHANGES IN CPI BY COMPONENT (percentage points) Chart 5.2 IMPACT OF ENERGY AND FOOD PRICE CHANGES ON ANNUAL CONSUMER PRICE INFLATION (percentage points) Chart 5.3 OIL PRICES ON GLOBAL MARKET
  • 35. 34 MACROECONOMIC DEVELOPMENTS REPORT March 2014 5. Costs and Prices The global food price developments had a stabilising effect on food prices in Latvia in January, with only prices of dairy products recording a rise due to the growing demand. Other major food commodity groups posted a minor price drop, which was favourably affected by the harvest estimates in the countries having the harvest season at the beginning of the year (see Chart 5.4). In January, the seasonal increase in potato and vegetable prices in Latvia exceeded the seasonal price rise in this group in 2013, accounting for 0.2 percentage point (half) of annual consumer price inflation. The majority of food commodity groups recorded an increase in prices on the global market in February. There are concerns about the expected harvest in several regions of the northern hemisphere due to unusual winter weather conditions, and this could be one of the reasons why the prices of agricultural commodity futures have followed an upward trend somewhat. Although annual core inflation rose to 1.3% in January and 1.4% in February along with an increase in non-administered service prices, neither the monthly nor the annual price rise in total consumption and services exceeded the average level observed in January and February 2004–2013 in January and February 2014. The data for the beginning of the year is too small an amount of information to estimate the impact of the introduction of the euro on prices as many price changes may be temporary. Thus, it will be possible to estimate the impact of the price changes untypical for the season (e.g. the introduction of the euro) on inflation during the year. However, the flash impact assessment made by using the data of price monitoring and the price changes typical for January suggests that the price changes which are not underpinned by concrete factors or are related to maintaining attractive prices may have influenced the average consumer price level, without exceeding the amount estimated in 2013 (approximately 0.2 percentage point of total inflation both between September 2013 and January 2014 and only in January 2014). The share of the respondents who considered that consumer prices would rise rapidly during the year, affecting overall inflation expectations favourably decreased temporarily in January (see Chart 5.5). At the same time, the share of the respondents whose answers indicate that a moderate price rise is expected increased. The share of the respondents who considered that consumer prices had risen rapidly during the year declined in December and January. Chart 5.4 GLOBAL FOOD PRICES (average monthly indicator of 2002–2004 = 100) Chart 5.5 BREAKDOWN OF HOUSEHOLD EXPECTATIONS FOR CONSUMER PRICE CHANGES IN NEXT 12 MONTHS (%)
  • 36. 35 MACROECONOMIC DEVELOPMENTS REPORT March 2014 This indicator showed a slight increase in February (data on inflation in January that was higher than in December were available), but did not reach the level observed in November. At the same time, the share of the respondents who considered that consumer prices would rise rapidly during the year rebounded again to the December level in February. The decrease in heating prices observed in February did not improve the people's price perception, but it could become more optimistic in March and April, while knowing that the heating price is expected to decline further in several cities. Likewise, liberalisation of the electricity market has been postponed, thus limiting electricity price rises temporarily, and the Public Utilities Commission has approved reductions in the inter-operator tariffs for the providers of telecommunications services. 5. Costs and Prices
  • 37. 36 MACROECONOMIC DEVELOPMENTS REPORT March 2014 6. Balance of Payments The current account deficit of Latvia's balance of payments decreased to 134.3 million lats or 0.8% of GDP in 2013 (see Chart 6.1). It was driven by a decline in foreign trade deficit in goods and the growing foreign trade surplus in services. The goods and services foreign trade balance improved in 2013, with the foreign trade deficit decreasing to 305.9 million lats or 1.9% of GDP. At the same time, exports of services increased by 4.8%, while imports of services expanded merely by 0.3% (see Chart 6.2). Transportation services were dampened by the relative weakness of external demand, while exports of all other services posted a rise. The income account deficit dropped to 233.5 million lats or 1.4% of GDP in 2013 as profit earned by foreign direct investors in Latvia decreased somewhat. The surplus of the current transfers account and the capital account likewise declined (to 405.0 million lats or 2.5% of GDP and 402.7 million lats or 2.5% of GDP respectively) in comparison with 2012. The dynamics of the current transfers and capital accounts was primarily determined by a change in the amount of the EU funds received. 738.9 million lats were received from EU funds in 2013; however, albeit less than year-on-year, the amount corresponded to 4.5% of GDP. The financial account recorded a deficit of 135.2 million lats or 0.8% of GDP in 2013. Foreign direct investment inflows into Latvia amounted to 427.9 million lats or 2.6% of GDP in 2013 (see Chart 6.3). The amount of foreign direct investment recorded in financial and insurance activities increased in comparison with the previous year, while investment in real estate activities decreased. The contribution of investment to manufacturing expanded from approximately 10% in 2012 to approximately 15% of total foreign direct investment in 2013 (see Chart 6.4). The fourth quarter of 2013 when the largest inflows of investment were recorded in financial and insurance activities (from Russia, Sweden and the Netherlands), the energy sector (from Russia and Germany) as well as manufacturing (manufacture of food products – from Lithuania, Cyprus and Malta, woodworking – from Cyprus and the Netherlands, and manufacturing of chemicals and chemical products – from Russia and Czech Republic) was successful to attract foreign direct investment. 6. Balance of Payments Chart 6.1 CURRENT ACCOUNT OF LATVIA'S BALANCE OF PAYMENTS AND ITS COMPONENTS (% of GDP) Chart 6.2 GROWTH RATE OF EXPORTS AND IMPORTS OF GOODS AND SERVICES (year-on-year; %) Chart 6.3 FOREIGN DIRECT INVESTMENT IN LATVIA (% of GDP)
  • 38. 37 MACROECONOMIC DEVELOPMENTS REPORT March 2014 In late 2013 and early 2014, several international credit rating agencies have confirmed Latvia's credit rating at the present level, but Standard & Poor's raised Latvia's credit rating outlook from stable to positive, thus acknowledging stable economic development. The balance of payments financial flows at the beginning of 2014 will be also affected by the fact that Latvia successfully launched an issue of bonds in the amount of 1 billion euro on the international markets (the previous issue of the Latvian government bonds on the international markets took place in December 2012). The payments for the loan received from the EC within the framework of the international financial assistance programme and the bonds issued on the international markets previously are to be made in 2014. Chart 6.4 net flows of FOREIGN DIRECT INVESTMENT (millions of euro) 6. Balance of Payments
  • 39. 38 MACROECONOMIC DEVELOPMENTS REPORT March 2014 7. Conclusions and Forecasts 7.1 Economic developments In the fourth quarter of 2013, the economic growth in Latvia was slightly slower than projected. GDP grew by 3.6% year-on-year (0.8% over the previous quarter). Contribution of retail trade turnover and manufacturing allowed us to hope for more rapid GDP growth; however, the latter slightly moderated on account of weak performance in the energy and construction sectors. In 2014, the economic development prospects will be affected by domestic factors, generally favourable for further growth. The contribution of industry in 2013 and the publicly available investment projects suggest that growth in industrial output will also continue in 2014; however, new investments might be hindered by negative sentiment effects caused by the impact of the Russian–Ukrainian crisis. Retail trade turnover saw a robust increase, and there is no reason to expect it to fall significantly in 2014. As regards construction, its growth will mostly depend on the available funding and the overall investment activity in the private sector. Private and public funding will remain at approximately the same levels as in 2013, while the amount of EU funds will be cardinally different when broken down by subprogramme. Nevertheless, growth is generally expected to persist in construction as well. The growth prospects of the transportation and storage sector cause the most prominent concern. 2013 was quite unfavourable for the sector in general: the increase in the demand for freight transportation in the Baltic Sea region moderated and the mutual competition of ports for the freight flow became more pronounced. Moreover, several taxes and duties (port tax and road use duty) have been introduced in 2014; they might hinder more accelerated growth of the sector. With growth recovery in EU countries in the next few years, the demand for transportation services is also expected to increase gradually in the Baltic Sea region; however, it might be dampened by the slowdown of the Russian economic growth. Despite the persisting gradual improvement of the economic situation in the euro area countries, growing uncertainty regarding the developments in Russia and Ukraine is observed in the external environment. In 2014, the euro area GDP is expected to increase for the first time since 2011. At the beginning of the year 7. Conclusions and Forecasts
  • 40. 39 MACROECONOMIC DEVELOPMENTS REPORT March 2014 Chart 7.1 CHANGES in GDP (year-on-year; %; forecast of Latvijas Banka*) * The coloured area represents 90% of potential scenarios (the lighter the colour, the lower the scenario's probability). several economic confidence indicators (confidence indicators aggregated by the EC, PMI, etc.) suggested gradual economic recovery. Gradual strengthening of the US economic growth is also observed; nevertheless, the tapering of the FRS securities purchase programme might have a negative effect. The emerging market economies, having been the driving force of the global economic growth in recent years, have lately shown signs of moderating economic growth. In 2013, weaker growth was also observed in two Baltic Sea region countries (Estonia and Finland). The gradual moderation of the Russian economic growth rate is particularly significant for the economy of Latvia. The situation is aggravated by the accelerating tension and uncertainty about the mutual relationship of Ukraine and Russia that could lead to further weakening of the economic growth in the region, with a potentially unfavourable effect also on the Latvian economy, e.g. manufacturing exports and travel and transportation sectors in particular. Sectoral performance indicators for the fourth quarter of 2013 and the preliminary indicators for the first quarter of 2014 suggest sustainable economic growth. In view of the high production capacity utilisation, as well as intensive drawdown of selected EU funds from the previous planning period in 2014 and 2015, investment growth is likely to be more rapid than projected. External risks, however, are on the downside, and they have increased significantly. They are mostly related to the weakening of the Russian economic activity and uncertainty regarding the future developments in Russia and Ukraine. Consequently, the medium-term risks to the national economic growth outlook are generally considered to be on the downside (see Chart 7.1). At this stage, the development of the new forecasts is in progress; they will be published in June 2014. 7.2 Inflation Annual inflation remained low mostly on account of supply side factors. Nevertheless, the inflation rate became positive and was closer to a level characteristic of economic growth periods. The global raw material prices have a favourable impact and inflation expectations are moderate. Annual core inflation rose to 1.3% and 1.4% in January and February respectively, including a pick- up in prices on non-administered services; however, neither the overall price rise (in monthly and annual 7. Conclusions and Forecasts
  • 41. 40 MACROECONOMIC DEVELOPMENTS REPORT March 2014 terms) nor the increase in service prices exceeded the averages observed in the respective months over the last ten years. The data for the beginning of the year is too small an amount of information to estimate the effect of the euro changeover on prices as many price changes may be temporary. Thus, it will be possible to estimate the impact of the price changes unusual for the season (e.g. the euro changeover) on inflation over a year. Risks to the average inflation (HICP) for 2014 mostly lie in the postponement of electricity market liberalisation for households. The impact of the above decision on the inflation rate forecast for 2014 is significant (even a decline of 0.6 percentage point could be reached), with a respective increase in the inflation forecast for 2015 (see Chart 7.2). The risks related to administered price dynamics might mutually offset each other. Public transport fares in Riga will be lower in 2014 in comparison with 2013. Inter-operator tariffs for telecommunications services have also been reduced. Heating tariffs continue on the downward trend in several cities and towns, both on account of the natural gas price and other factors. However, prices of water supply and sewage are likely to rise in several cities and towns, and the uncertain dynamics of the Ukrainian– Russian relationship might affect the energy price developments. Due to political factors and natural conditions, there is uncertainty regarding the levels of grain prices in this season. Overall, the risks to the inflation outlook currently could be considered to be on the downside. Chart 7.2 HICP CHANGES (year-on-year; %; forecast of Latvijas Banka*) * The coloured area represents 90% of potential scenarios (the lighter the colour, the lower the scenario's probability). 7. Conclusions and Forecasts
  • 42. 41 MACROECONOMIC DEVELOPMENTS REPORT March 2014 Statistics Statistics List of tables 1. Monetary Indicators and Interest Rates 43 2.ab Real Sector Indicators and Prices 44 3. Monetary Base 45 4. Monetary Aggregates and Counterparts 46 5. Seasonally Adjusted Monetary Aggregates 46 6. Assets and Liabilities of Latvijas Banka 47 7. Aggregated Balance Sheet of MFIs (excluding Latvijas Banka) 48 8. Consolidated Balance Sheet of MFIs 49 9.ab Aggregated Balance Sheet of MFIs (excluding Latvijas Banka) 50 10. Monetary Survey 51 11.ab Foreign Assets and Liabilities of MFIs (excluding Latvijas Banka) 54 12. Selected Items in the Monthly Financial Position Report of MFIs (excluding Latvijas Banka) by Group of Countries 55 13. Maturity Profile of Deposits of Resident Financial Institutions, Non-Financial Corporations and Households (in lats and foreign currencies) 55 14.a Deposits by Financial Institutions (in lats and foreign currencies) 56 14.b Deposits by Non-Financial Corporations (in lats and foreign currencies) 57 14.c Deposits by Households (in lats and foreign currencies) 59 14.d Deposits by Government and Non-Residents (in lats and foreign currencies) 59 15. Maturity Profile of Loans to Resident Financial Institutions, Non-Financial Corporations and Households (in lats and foreign currencies) 60 16.a Loans to Financial Institutions and Non-Financial Corporations 60 16.b Loans to Households 61 16.c Loans to Government and Non-Residents 61 17. Loans to Financial Institutions and Non-Financial Corporations in the National Economy 62 18. Lending to Resident Financial Institutions, Non-Financial Corporations and Households 62 19.a Holdings of Securities Other than Shares 63 19.b Holdings of Shares and Other Equity 63 20.a Currency Breakdown of Resident Deposits 64 20.b Currency Breakdown of Non-Resident Deposits 64 20.c Currency Breakdown of Loans to Residents 65 20.d Currency Breakdown of Loans to Non-Residents 65 20.e Currency Breakdown of Holdings of Resident Securities Other than Shares 66 20.f Currency Breakdown of Holdings of Non-Resident Securities Other than Shares 66 20.g Currency Breakdown of Debt Securities Issued by MFIs 67 21.a Weighted Average Interest Rates Charged by MFIs in Transactions with Resident Non-Financial Corporations and Households in Lats 67 21.b Weighted Average Interest Rates Charged by MFIs in Transactions with Resident Non-Financial Corporations and Households in Euro 71 21.c Weighted Average Interest Rates Charged by MFIs in Transactions with Resident Non-Financial Corporations and Households in US Dollars 75 21.d Weighted Average Interest Rates Charged by MFIs in Transactions with Resident Non-Financial Corporations (new business) 80
  • 43. 42 MACROECONOMIC DEVELOPMENTS REPORT March 2014 Statistics 22. Lending in the Interbank Markets 81 23.a Interest Rates in the Domestic Interbank Market 82 23.b Interest Rates Set by Latvijas Banka 82 23.c Interest Rates in Latvijas Banka Tenders of Repurchase Agreements and Short-Term Currency Swap Contracts 83 24. Principal Foreign Exchange Transactions (by type, counterparty and currency) 83 25. Non-cash Foreign Exchange Transactions 84 26. Monthly Averages of the Exchange Rates Set by Latvijas Banka 85 27. Weighted Average Exchange Rates (cash transactions) 85 28. Structure of Government Securities 86 29. Auctions of Government Securities in the Primary Market 87 30. The Bank of Latvia's Transactions in the Secondary Market for Government Securities 87 31. Dynamics of GDP 87 32. Changes in the Average Monthly Wages and Salaries and Unemployment 88 33. Latvian Foreign Trade Balance 88 34. Main Export Goods of Latvia 89 35. Main Import Goods of Latvia 89 36. Latvian Foreign Trade Partners 90 37. Convenience and Extended Credit, Revolving Loans and Overdraft to Resident Non-financial Corporations and Households 91 38.a Loans to Resident Non-financial Corporations in the Breakdown by Residual Maturity and by Interest Rate Reset Period 91 38.b Loans to Resident Households in the Breakdown by Residual Maturity and by Interest Rate Reset Period 92
  • 44. 43 MONETARY INDICATORS AND INTEREST RATES 2012 2013 Q1 Q2 Q3 Q4 Q1 Q2 Q3 Q4 M11 10.9 16.6 12.8 14.8 10.9 8.0 10.4 14.1 9.1 8.0 M21 3.8 0.5 2.4 1.9 3.8 1.9 2.1 1.2 –0.4 1.9 M31 2.8 –0.1 2.0 2.3 2.8 2.8 3.8 3.3 1.0 2.8 M2X1 4.5 1.3 2.3 2.6 4.5 2.0 3.3 2.7 1.0 2.0 Loans to resident financial institutions, non-financial corporations and households1 –10.6 –11.0 –11.6 –11.2 –10.6 –6.4 –6.7 –6.4 –7.6 –6.4 Deposits of resident financial institutions, non-financial corporations and households1 4.5 –2.5 –0.8 –0.2 4.5 13.2 4.1 4.2 5.1 13.2 Long-term interest rate for convergence assessment purposes2 4.57 5.45 5.11 4.35 3.36 3.34 3.20 3.14 3.32 3.70 RIGIBOR (3-month loans)3 0.9 1.4 1.0 0.6 0.5 0.4 0.5 0.4 0.3 0.3 Average yield on government bonds 4.94 4.35 5.24 4.14 3.14 2.25 1.46 1.16 1.26 2.25 OMXR3 383.9 388.3 379.4 382.8 384.7 432.5 405.8 416.5 457.7 448.2 1. 2012 2013 X XI XII I II III IV V VI VII VIII IX X XI XII M11 15.9 8.0 10.9 13.3 12.3 10.4 13.1 15.4 14.1 11.9 11.4 9.1 7.9 7.7 8.0 M21 3.7 4.4 3.8 4.7 3.7 2.1 2.3 2.4 1.2 0.4 –0.2 –0.4 –0.8 –0.6 1.9 M31 4.0 5.1 2.8 3.7 3.4 3.8 4.2 4.2 3.3 1.8 1.2 1.0 0.8 0.7 2.8 M2X1 5.1 8.9 4.5 5.4 4.2 3.3 3.4 3.9 2.7 2.0 1.4 1.0 0.1 –0.4 2.0 Loans to resident financial institutions, non-financial corporations and households1 –11.0 –10.9 –10.6 –10.4 –10.1 –6.7 –7.2 –4.5 –6.4 –6.6 –6.9 –7.6 –8.2 –7.7 –6.4 Deposits of resident financial institutions, non-financial corporations and households1 2.9 8.3 4.5 6.2 5.2 4.1 4.9 5.1 4.2 4.2 4.3 5.1 5.1 5.5 13.2 Long-term interest rate for convergence assessment purposes2 3.52 3.32 3.24 3.21 3.22 3.17 3.15 3.10 3.17 3.25 3.25 3.45 3.78 3.71 3.62 RIGIBOR (3-month loans)3 0.5 0.5 0.5 0.5 0.5 0.5 0.4 0.4 0.4 0.3 0.3 0.3 0.3 0.2 0.3 Average yield on government bonds 3.14 – – 1.46 1.46 1.26 1.26 1.16 1.16 1.16 1.26 – 2.35 2.05 – OMXR3 384.6 381.3 389.3 404.7 399.5 413.2 412.3 410.7 427.3 452.3 468.1 452.97 447.2 446.9 451.2 1 Year-on-year changes (%). 2 Average secondary market yield of 10-year government bonds. 3 Average of the period. 4 Weighted average primary market yield of 10-year government bonds. 5 Weighted average primary market yield of 5-year government bonds. 6 Weighted average primary market yield of 3-year government bonds. 7 Data have been revised.
  • 45. 44 REAL SECTOR INDICATORS AND PRICES 2012 2013 Q1 Q2 Q3 Q4 Q1 Q2 Q3 Q4 Industrial output1 Increase/decrease2 (at constant prices; working day adjusted data; %) 9.3 14.9 8.0 8.1 7.6 0.6 –1.7 –0.6 1.7 2.7 Cargoes loaded and unloaded at ports Turnover (thousands of tons) 75 193 20 032 20 309 17 722 17 129 70 480 18 969 17 990 16 523 16 999 Increase/decrease2 (%) 9.3 22.6 12.2 7.2 –4.0 –6.3 –5.3 –11.4 –6.8 –0.8 Retail trade turnover 1, 3 Turnover (at current prices; millions of lats) 4 273.3 946.9 1 047.7 1 147.9 1 130.8 4 407.8 984.3 1 084.1 1 177.1 1 162.3 Increase/decrease2 (at constant prices; %) 7.3 9.0 6.3 7.7 6.6 3.8 4.7 4.0 2.64 4.0 Unemployment rate (%) 10.5 11.7 11.9 11.0 10.5 9.5 10.8 9.6 9.1 9.5 Producer prices1 (increase/decrease compared with the previous period; %) 3.7 1.6 0.5 0.8 0.4 1.5 0.3 0.4 0.3 –0.1 Consumer price inflation Year-on-year basis (%) 2.3 3.4 2.3 1.8 1.6 0 0.3 –0.1 –0.1 –0.3 Quarter-on-quarter basis (%) x 1.1 0.9 –0.6 0.2 x –0.1 0.5 –0.6 0 Financial surplus/deficit in the consolidated general government budget Surplus/deficit (millions of lats) 19.1 –43.9 106.3 279.0 –322.2 –90.2 31.8 133.8 95.9 –351.7 Ratio to GDP (%) 0.1 1.3 2.8 6.9 7.6 0.6 0.9 3.3 2.2 7.9 1 Data are calculated according to the revised version of the EU Statistical Classification of Economic Activities (NACE Rev. 2). 2 Year-on-year basis. 3 Sale of motor vehicles and motorcycles not included. 4 Data have been revised. 2.a
  • 46. 45 REAL SECTOR INDICATORS AND PRICES 2012 2013 X XI XII I II III IV V VI VII VIII IX X XI XII Industrial output1 Increase/decrease2 (at constant prices; working day adjusted data; %) 5.5 7.4 10.2 –0.2 1.6 –5.6 –2.7 0 0.9 4.7 –1.3 1.9 2.2 2.6 3.3 Cargoes loaded and unloaded at ports Turnover (thousands of tons) 5 337 5 825 5 967 6 553 5 614 6 802 6 268 6 034 5 688 5 491 5 724 5 308 5 307 5 336 6 356 Increase/decrease2 (%) –9.3 0.4 –3.0 –6.4 –3.2 –6.0 –11.5 –12.7 –10.0 –7.1 –2.9 –10.3 –0.6 –8.4 6.5 Retail trade turnover 1, 3 Turnover (at current prices; millions of lats) 373.6 350.5 406.8 330.1 310.5 343.7 338.4 374.2 371.5 396.8 401.8 378.5 381.9 361.0 419.4 Increase/decrease2 (at constant prices; %) 6.9 4.3 8.4 4.0 4.0 5.9 3.4 6.0 2.74 3.4 2.14 2.24 2.6 5.3 4.2 Unemployment rate (%) 10.7 10.6 10.5 10.9 10.9 10.8 10.4 9.9 9.6 9.5 9.3 9.1 9.1 9.3 9.5 Producer prices1 (increase/decrease compared with the previous period; %) 0.2 –0.2 0.2 0.3 –0.2 0.1 0.1 0.3 0.1 –0.1 0.2 0.3 0 –0.2 –0.7 Consumer price inflation Year-on-year basis (%) 1.6 1.6 1.6 0.6 0.3 0.2 –0.4 –0.1 0.2 0.3 –0.2 –0.4 0 –0.4 –0.4 Month-on-month basis (%) 0 –0.1 0 –0.2 –0.1 0.5 0 0.1 0.2 –0.3 –0.8 0.3 0.3 –0.5 0 Annual core inflation (%) –0.5 0.1 –0.6 –0.5 –0.3 0 –0.2 –0.2 –0.1 0.2 0.4 0.5 1.2 0.4 0.6 Financial surplus/deficit in the consolidated general government budget (millions of lats) –63.1 –76.2 –182.9 56.8 –70.7 45.7 58.4 96.9 –21.5 32.0 53.0 10.9 6.8 –105.5 –253.0 1 Data are calculated according to the revised version of the EU Statistical Classification of Economic Activities (NACE Rev. 2). 2 Year-on-year basis. 3 Sale of motor vehicles and motorcycles not included. 4 Data have been revised. 2.b MONETARY BASE (at end of period; millions of lats) 2012 2013 X XI XII I II III IV V VI VII VIII IX X XI XII Currency in circulation 1 167.7 1 179.0 1 234.1 1 147.3 1 126.3 1 134.8 1 096.7 1 080.3 1 086.8 1 054.3 1 022.5 971.0 893.5 841.8 630.8 Currency as percent of the monetary base 50.5 48.2 46.3 46.7 43.1 44.8 43.1 41.1 40.3 40.5 39.1 37.9 34.1 32.2 20.0 Deposits with Latvijas Banka in lats 676.4 708.9 866.3 654.0 748.7 671.3 669.9 661.0 807.9 773.5 818.7 820.5 921.4 1 027.3 1 714.3 Deposits with Latvijas Banka in foreign currencies 466.6 555.7 567.2 657.7 736.6 724.5 776.4 889.4 805.2 777.0 771.9 770.8 806.1 749.0 813.3 Deposits as percent of the monetary base 49.5 51.8 53.7 53.3 56.9 55.2 56.9 58.9 59.7 59.5 60.9 62.1 65.9 67.8 80.0 M0 2 310.7 2 443.6 2 667.7 2 459.1 2 611.7 2 530.7 2 542.9 2 630.7 2 699.9 2 604.8 2 613.2 2 562.3 2 621.0 2 618.1 3 158.3 Net foreign assets 3 759.8 3 874.9 4 025.8 3 874.1 3 988.3 4 051.7 4 038.6 4 140.7 4 060.1 4 019.7 4 032.6 4 064.4 4 172.4 4 063.1 4 073.8 Loans to MFIs 0 0 0 0 0 0 0 0 0 0 0 0 0 0 10.0 Credit to central government (net) –766.7 –792.7 –761.2 –625.4 –528.7 –606.5 –600.8 –657.8 –591.0 –581.7 –617.0 –616.6 –624.3 –492.9 –239.2 Other items (net) –682.4 –638.5 –597.0 –789.6 –847.8 –914.6 –894.9 –852.3 –769.3 –833.2 –802.5 –885.4 –927.1 –952.1 –686.2 Total 2 310.7 2 443.6 2 667.7 2 459.1 2 611.7 2 530.7 2 542.9 2 630.7 2 699.9 2 604.8 2 613.2 2 562.3 2 621.0 2 618.1 3 158.3 3.
  • 47. 46 MONETARY AGGREGATES AND COUNTERPARTS (at end of period; millions of lats) 2012 2013 X XI XII I II III IV V VI VII VIII IX X XI XII Monetary aggregates M3 6 682.8 6 802.7 6 845.7 6 824.8 6 869.0 6 754.8 6 822.3 6 800.0 6 831.6 6 774.0 6 801.1 6 696.6 6 739.4 6 851.0 7 034.8 Repos 0 0 0 0 0 0 0 0 0 0 0 0 0 0 0 Money market fund shares and units 66.2 66.2 62.0 64.7 64.4 63.6 62.4 62.0 61.2 57.1 55.9 54.8 53.0 51.1 46.6 Debt securities issued with maturity of up to 2 years 50.0 72.8 77.7 77.6 96.9 120.7 130.2 130.3 152.3 149.8 153.0 150.4 172.3 176.8 154.7 M2 6 566.7 6 663.7 6 706.1 6 682.5 6 707.7 6 570.5 6 629.7 6 607.8 6 618.0 6 567.1 6 592.2 6 491.3 6 514.1 6 623.1 6 833.5 Deposits with an agreed maturity of up to 2 years 1 754.3 1 729.1 1 658.6 1 600.5 1 613.0 1 586.3 1 553.4 1 499.8 1 398.0 1 355.7 1 322.3 1 283.6 1 263.5 1 237.2 1 300.1 Deposits redeemable at notice of up to 3 months 209.9 212.9 215.7 220.1 225.0 234.2 236.6 240.2 245.0 251.3 260.0 270.3 286.2 299.0 314.4 M1 4 602.5 4 721.7 4 831.7 4 862.0 4 869.6 4 750.0 4 839.7 4 867.8 4 975.0 4 960.0 5 009.9 4 937.4 4 964.4 5 086.9 5 219.0 Currency outside MFIs 1 053.4 1 058.2 1 082.4 1 035.3 1 013.7 1 011.8 982.3 969.1 976.0 941.7 908.2 853.5 778.8 722.6 469.3 Overnight deposits 3 549.1 3 663.4 3 749.3 3 826.7 3 855.9 3 738.2 3 857.4 3 898.7 3 999.1 4 018.3 4 101.7 4 084.0 4 185.6 4 364.3 4 749.7 Counterparts of monetary aggregates and longer-term financial liabilities Deposits of central government 1 242.5 1 232.8 1 287.3 1 292.5 1 151.2 1 202.7 1 216.7 1 295.7 1 216.2 1 199.3 1 284.0 1 309.1 1 311.4 1 142.7 896.8 Longer-term financial liabilities 2 583.0 2 576.2 2 585.3 2 602.8 2 631.4 2 585.7 2 605.6 2 604.4 2 600.3 2 617.6 2 629.7 2 654.5 2 674.6 2 698.3 2 679.7 Deposits with an agreed maturity of over 2 years 246.0 247.5 250.6 255.8 258.9 267.2 262.1 257.6 255.7 254.0 247.8 242.3 243.8 232.1 223.7 Deposits redeemable at notice of over 3 months 0 0 0 0 0 0 2.4 2.4 2.4 2.4 2.4 2.4 2.4 2.5 2.5 Debt securities issued with maturity of over 2 years 63.5 65.9 61.9 61.5 62.5 67.1 66.0 65.2 79.9 79.8 80.4 79.7 79.6 101.4 79.9 Capital and reserves 2 273.6 2 262.8 2 272.8 2 285.6 2 310.0 2 251.4 2 275.0 2 279.2 2 262.3 2 281.3 2 299.0 2 330.1 2 348.8 2 362.4 2 373.7 Credit to residents 11 278.7 11 233.4 11 051.1 11 024.0 10 929.4 10 858.3 10 762.1 10 798.9 10 650.4 10 642.4 10 659.1 10 591.4 10 480.5 10 515.4 10 488.6 Credit to general government 542.2 542.8 554.0 549.5 476.7 484.6 462.4 491.7 507.5 515.3 525.7 529.9 527.0 535.5 547.0 Credit to other residents 10 736.5 10 690.7 10 497.1 10 474.5 10 452.7 10 373.7 10 299.7 10 307.1 10 142.9 10 127.1 10 133.4 10 061.5 9 953.5 9 979.9 9 941.5 Loans 10 408.8 10 367.1 10 165.4 10 138.1 10 111.9 10 025.5 9 949.6 9 953.9 9 768.9 9 735.4 9 726.6 9 630.3 9 557.2 9 567.2 9 514.4 Net external assets 202.8 378.0 613.7 577.3 610.8 642.1 786.2 771.4 820.1 763.1 837.7 845.4 967.2 915.3 844.1 Other items (net) 973.0 999.7 946.4 881.2 888.7 957.2 903.7 870.2 822.5 814.6 782.0 776.6 722.3 738.7 721.3 4. SEASONALLY ADJUSTED MONETARY AGGREGATES (at end of period; millions of lats) 2012 2013 X XI XII I II III IV V VI VII VIII IX X XI XII M1 4 643.4 4 720.3 4 727.4 4 841.3 4 841.4 4 790.0 4 881.8 4 915.9 4 938.2 4 949.7 5 012.8 4 976.1 5 003.6 5 093.0 5 085.0 M2 6 658.9 6 705.2 6 622.5 6 678.4 6 664.4 6 567.3 6 592.8 6 595.0 6 592.4 6 581.2 6 589.9 6 562.8 6 610.6 6 665.6 6 747.0 M3 6 778.8 6 846.0 6 768.2 6 825.3 6 824.3 6 744.6 6 784.0 6 786.3 6 803.4 6 785.2 6 794.2 6 772.8 6 842.0 6 898.9 6 956.2 5.
  • 48. 47 ASSETS AND LIABILITIES OF LATVIJAS BANKA (at end of period; millions of lats) 2012 2013 X XI XII I II III IV V VI VII VIII IX X XI XII ASSETS Loans to residents 0 0 0 0 0 0 0 0 0 0 0 0 0 0 10.0 General government 0 0 0 0 0 0 0 0 0 0 0 0 0 0 0 Other residents 0 0 0 0 0 0 0 0 0 0 0 0 0 0 0 MFIs 0 0 0 0 0 0 0 0 0 0 0 0 0 0 10.0 Holdings of securities other than shares issued by residents 0 0 0 0 0 0 0 0 0 0 0 0 0 0 0 General government 0 0 0 0 0 0 0 0 0 0 0 0 0 0 0 Other residents 0 0 0 0 0 0 0 0 0 0 0 0 0 0 0 MFIs 0 0 0 0 0 0 0 0 0 0 0 0 0 0 0 Holdings of shares and other equity issued by residents x x x x x x x x x x x x x x x External assets 3 786.5 3 892.9 4 053.5 3 925.7 4 046.8 4 083.1 4 078.6 4 165.9 4 107.9 4 055.8 4 056.4 4 098.9 4 198.4 4 107.3 4 098.4 Fixed assets 32.2 32.1 32.0 31.7 31.6 31.4 31.3 31.1 31.0 30.8 30.7 30.5 30.3 30.2 30.2 Remaining assets 0.7 0.8 0.9 0.8 1.1 1.1 1.0 1.0 1.0 0.9 0.9 0.9 0.8 0.8 0.7 Total 3 819.5 3 925.8 4 086.3 3 958.2 4 079.5 4 115.6 4 110.9 4 198.1 4 139.9 4 087.5 4 088.0 4 130.3 4 229.6 4 138.3 4 139.4 LIABILITIES Currency in circulation 1 167.7 1 179.0 1 234.1 1 147.3 1 126.3 1 134.8 1 096.7 1 080.3 1 086.8 1 054.3 1 022.5 971.0 893.5 841.8 630.8 Deposits of residents 2 261.2 2 364.5 2 460.3 2 399.7 2 529.5 2 565.3 2 617.6 2 754.4 2 671.7 2 664.0 2 715.2 2 790.3 2 969.5 2 912.4 3 150.2 Central government 766.7 792.7 761.2 625.4 528.7 606.5 600.8 657.8 591.0 581.7 617.0 616.6 624.3 492.9 239.2 Other residents 32.5 11.4 10.8 11.5 21.7 10.2 11.2 19.4 18.9 20.8 10.2 12.8 15.7 25.2 10.0 MFIs 1 462.0 1 560.3 1 688.3 1 762.8 1 979.0 1 948.7 2 005.6 2 077.3 2 061.8 2 061.5 2 088.1 2 160.9 2 329.6 2 394.3 2 901.0 Debt securities issued 0 0 0 0 0 0 0 0 0 0 0 0 0 0 0 Capital and reserves 361.4 362.3 362.0 356.7 362.3 359.8 342.4 335.8 330.8 330.4 324.4 331.8 337.7 337.6 330.3 External liabilities 26.7 18.1 27.7 51.6 58.5 31.4 40.0 25.2 47.8 36.1 23.8 34.5 26.1 44.3 24.7 Remaining liabilities 2.5 1.9 2.2 2.8 2.9 24.3 14.2 2.4 2.8 2.7 2.0 2.7 2.8 2.2 3.4 Total 3 819.5 3 925.8 4 086.3 3 958.2 4 079.5 4 115.6 4 110.9 4 198.1 4 139.9 4 087.5 4 088.0 4 130.3 4 229.6 4 138.3 4 139.4 6.
  • 49. 48 AGGREGATED BALANCE SHEET OF MFIs (EXCLUDING LATVIJAS BANKA) (at end of period; millions of lats) 2012 2013 X XI XII I II III IV V VI VII VIII IX X XI XII ASSETS Loans to residents 12 166.0 12 226.0 12 173.1 12 232.1 12 361.4 12 246.5 12 280.6 12 373.6 12 151.2 12 137.9 12 118.3 12 113.3 12 238.2 12 304.6 12 720.9 General government 70.5 70.6 73.0 75.7 75.2 74.6 76.0 79.8 81.3 83.0 83.6 83.6 83.5 84.5 86.7 Other residents 10 408.8 10 367.1 10 165.4 10 138.1 10 111.9 10 025.5 9 949.6 9 953.9 9 768.9 9 735.4 9 726.6 9 630.3 9 557.2 9 567.2 9 514.4 MFIs 1 686.6 1 788.4 1 934.7 2 018.3 2 174.4 2 146.4 2 255.0 2 339.9 2 301.0 2 319.5 2 308.1 2 399.4 2 597.4 2 652.9 3 119.7 Holdings of securities other than shares issued by residents 472.8 473.4 485.3 484.0 411.1 422.1 397.0 426.2 440.5 446.1 455.7 460.2 457.1 470.9 480.4 General government 471.7 472.2 481.0 473.8 401.5 410.0 386.4 411.9 426.2 432.3 442.1 446.3 443.5 451.0 460.3 Other residents 0.2 0.2 4.3 10.2 9.6 12.1 10.6 14.3 14.3 13.8 13.6 13.9 13.6 19.9 20.1 MFIs 1.0 1.0 0 0 0 0 0 0 0 0 0 0 0 0 0 Money market fund shares and units 0.4 0.4 0.4 0.4 0.4 0.4 0.4 0.4 0.4 0.4 0.4 0.4 0.4 0.4 0.4 Holdings of shares and other equity issued by residents 327.5 323.4 327.4 326.2 331.3 336.1 339.6 338.9 359.7 377.9 393.2 417.3 382.6 392.9 407.1 External assets 6 232.8 6 186.8 6 323.3 6 404.5 6 179.2 6 419.1 6 556.1 6 504.5 6 673.3 6 844.2 6 817.7 6 449.8 6 394.7 6 265.1 6 368.2 Fixed assets 87.1 88.4 87.2 85.1 89.6 89.8 89.9 90.4 90.4 90.8 91.4 92.0 90.0 91.8 93.7 Remaining assets 475.7 462.2 523.7 464.4 449.8 472.5 471.7 459.9 471.5 461.2 465.2 463.5 442.2 453.2 491.7 Total 19 762.2 19 760.7 19 920.5 19 996.7 19 822.8 19 986.5 20 135.3 20 194.0 20 187.0 20 358.5 20 341.9 19 996.5 20 005.2 19 978.8 20 562.3 LIABILITIES Deposits of residents 6 426.6 6 513.2 6 635.9 6 813.7 6 748.6 6 609.8 6 766.1 6 779.5 6 746.5 6 736.5 6 811.9 6 806.3 6 917.0 7 014.1 7 464.1 Central government 475.9 440.1 526.2 667.1 622.4 596.3 615.9 637.9 625.1 617.5 667.0 692.5 687.1 649.8 657.6 Other residents 5 726.8 5 841.5 5 863.5 5 891.4 5 931.2 5 815.8 5 900.7 5 879.3 5 881.3 5 861.0 5 924.0 5 869.9 5 965.9 6 109.9 6 580.4 MFIs 224.0 231.6 246.2 255.1 195.0 197.7 249.4 262.2 240.0 258.0 220.8 243.9 264.0 254.4 226.2 Money market fund shares and units 66.6 66.5 62.4 65.0 64.8 64.0 62.8 62.4 61.6 57.5 56.3 55.2 53.3 51.5 47.0 Debt securities issued 113.5 138.7 139.6 139.0 159.4 187.8 196.1 195.5 232.2 229.7 233.4 230.1 251.9 278.1 234.6 Capital and reserves 1 912.2 1 900.5 1 910.8 1 928.9 1 947.8 1 891.6 1 932.7 1 943.4 1 931.5 1 950.9 1 974.6 1 998.3 2 011.1 2 024.8 2 043.4 External liabilities 9 789.8 9 683.7 9 735.5 9 701.3 9 556.6 9 828.7 9 808.4 9 873.8 9 913.3 10 100.7 10 012.7 9 668.8 9 599.9 9 412.9 9 597.9 Remaining liabilities 1 453.6 1 458.1 1 436.4 1 348.7 1 345.6 1 404.6 1 369.1 1 339.5 1 302.0 1 283.2 1 253.0 1 237.8 1 172.0 1 197.3 1 175.4 Total 19 762.2 19 760.7 19 920.5 19 996.7 19 822.8 19 986.5 20 135.3 20 194.0 20 187.0 20 358.5 20 341.9 19 996.5 20 005.2 19 978.8 20 562.3 7.
  • 50. 49 CONSOLIDATED BALANCE SHEET OF MFIs (at end of period; millions of lats) 2012 2013 X XI XII I II III IV V VI VII VIII IX X XI XII ASSETS Loans to residents 10 479.3 10 437.6 10 238.5 10 213.8 10 187.0 10 100.1 10 025.6 10 033.7 9 850.3 9 818.4 9 810.2 9 713.9 9 640.8 9 651.7 9 601.1 General government 70.5 70.6 73.0 75.7 75.2 74.6 76.0 79.8 81.3 83.0 83.6 83.6 83.5 84.5 86.7 Other residents 10 408.8 10 367.1 10 165.4 10 138.1 10 111.9 10 025.5 9 949.6 9 953.9 9 768.9 9 735.4 9 726.6 9 630.3 9 557.2 9 567.2 9 514.4 Holdings of securities other than shares issued by other residents 471.8 472.4 485.3 484.0 411.1 422.1 397.0 426.2 440.5 446.1 455.7 460.2 457.1 470.9 480.4 General government 471.7 472.2 481.0 473.8 401.5 410.0 386.4 411.9 426.2 432.3 442.1 446.3 443.5 451.0 460.3 Other residents 0.2 0.2 4.3 10.2 9.6 12.1 10.6 14.3 14.3 13.8 13.6 13.9 13.6 19.9 20.1 Holdings of shares and other equity issued by other residents 327.5 323.4 327.4 326.2 331.3 336.1 339.6 338.9 359.7 377.9 393.2 417.3 382.6 392.9 407.1 External assets 10 019.3 10 079.8 10 376.8 10 330.2 10 225.9 10 502.2 10 634.6 10 670.5 10 781.2 10 899.9 10 874.2 10 548.7 10 593.2 10 372.4 10 466.6 Fixed assets 119.3 120.5 119.2 116.8 121.2 121.2 121.2 121.6 121.3 121.7 122.1 122.5 120.3 121.9 123.9 Remaining assets 362.1 342.2 372.9 353.1 338.3 350.6 358.4 349.7 361.9 349.5 351.8 346.9 328.3 334.8 331.0 Total 21 779.4 21 775.9 21 920.0 21 824.2 21 614.8 21 832.3 21 876.4 21 940.6 21 914.8 22 013.5 22 007.2 21 609.5 21 522.3 21 344.6 21 410.1 LIABILITIES Currency outside MFIs 1 053.4 1 058.2 1 082.4 1 035.3 1 013.7 1 011.8 982.3 969.1 976.0 941.7 908.2 853.5 778.8 722.6 469.3 Deposits of central government 1 242.5 1 232.8 1 287.3 1 292.5 1 151.2 1 202.7 1 216.7 1 295.7 1 216.2 1 199.3 1 284.0 1 309.1 1 311.4 1 142.7 896.8 Deposits of other general government and other residents 5 759.3 5 853.0 5 874.3 5 903.0 5 952.9 5 825.9 5 911.9 5 898.7 5 900.2 5 881.8 5 934.2 5 882.7 5 981.6 6 135.1 6 590.3 Money market fund shares and units 66.2 66.2 62.0 64.7 64.4 63.6 62.4 62.0 61.2 57.1 55.9 54.8 53.0 51.1 46.6 Debt securities issued 112.5 137.7 139.6 139.0 159.4 187.8 196.1 195.5 232.2 229.7 233.4 230.1 251.9 278.1 234.6 Capital and reserves 2 273.6 2 262.8 2 272.8 2 285.6 2 310.0 2 251.4 2 275.0 2 279.2 2 262.3 2 281.3 2 299.0 2 330.1 2 348.8 2 362.4 2 373.7 External liabilities 9 816.5 9 701.8 9 763.1 9 752.9 9 615.1 9 860.1 9 848.4 9 899.0 9 961.1 10 136.8 10 036.5 9 703.3 9 626.0 9 457.2 9 622.5 Remaining liabilities 1 456.1 1 459.9 1 438.5 1 351.5 1 348.5 1 429.0 1 383.5 1 341.9 1 304.8 1 285.8 1 255.0 1 240.5 1 174.8 1 199.6 1 178.8 Excess of inter-MFI liabilities –0.6 3.5 –0.1 –0.4 –0.3 0 0.1 –0.4 0.9 0 1.0 5.5 –3.9 –4.2 –2.5 Total 21 779.4 21 775.9 21 920.0 21 824.2 21 614.8 21 832.3 21 876.4 21 940.6 21 914.8 22 013.5 22 007.2 21 609.5 21 522.3 21 344.6 21 410.1 8.
  • 51. 50 AGGREGATED BALANCE SHEET OF MFIs (EXCLUDING LATVIJAS BANKA ) (at end of period; millions of lats) 2012 2013 X XI XII I II III IV V VI VII VIII IX X XI XII MFI reserves 1 576.3 1 681.1 1 840.1 1 874.8 2 091.7 2 071.7 2 120.0 2 188.4 2 172.6 2 174.1 2 202.4 2 278.4 2 444.3 2 513.5 3 062.5 Vault cash in national currency 114.3 120.8 151.8 112.0 112.7 123.0 114.4 111.2 110.8 112.6 114.3 117.5 114.7 119.2 161.4 Deposits with Latvijas Banka 1 462.0 1 560.3 1 688.3 1 762.8 1 979.0 1 948.7 2 005.6 2 077.3 2 061.8 2 061.5 2 088.1 2 160.9 2 329.6 2 394.3 2 901.1 Foreign assets 6 232.8 6 186.8 6 323.3 6 404.5 6 179.2 6 419.1 6 556.1 6 504.5 6 673.3 6 844.2 6 817.7 6 449.8 6 394.7 6 265.1 6 368.2 Claims on the central government 472.6 473.5 483.1 477.0 404.8 413.0 389.4 415.1 430.0 437.1 446.5 450.2 446.8 454.4 465.0 Loans 1.1 1.5 2.2 3.4 3.4 3.2 3.2 3.4 4.0 5.0 4.6 4.1 3.6 3.6 4.9 Holdings of securities other than shares 471.5 472.0 480.8 473.6 401.3 409.8 386.2 411.7 426.0 432.1 441.9 446.1 443.3 450.8 460.1 Claims on the local government 69.5 69.2 71.0 72.5 71.9 71.6 73.1 76.6 77.5 78.1 79.2 79.7 80.2 81.1 82.1 Loans 69.4 69.1 70.8 72.3 71.7 71.4 72.9 76.4 77.3 78.0 79.0 79.5 80.0 80.9 81.9 Holdings of securities other than shares 0.2 0.2 0.2 0.2 0.2 0.2 0.2 0.2 0.2 0.2 0.2 0.2 0.2 0.2 0.2 Claims on the financial institutions 539.8 529.3 529.1 543.7 547.9 562.2 543.0 547.9 582.3 597.1 614.1 641.0 592.0 607.9 631.9 Loans 285.4 277.1 279.5 295.4 294.5 304.4 287.6 293.3 303.3 298.6 300.6 298.2 284.9 287.4 302.8 Holdings of securities other than shares 0 0 0 0 0 0 0 0 0 0 0 0 0 6.6 6.8 Holdings of shares and other equity 254.4 252.2 249.6 248.3 253.4 257.8 255.4 254.6 279.0 298.5 313.5 342.8 307.1 313.9 322.3 Claims on public non-financial corporations 499.5 503.2 504.5 504.1 496.2 499.2 497.0 492.2 482.5 483.0 480.9 482.6 491.6 489.9 489.4 Loans 499.5 503.2 502.0 502.2 494.9 495.8 495.1 488.9 479.3 480.1 478.2 479.7 489.1 487.7 487.1 Holdings of securities other than shares 0 0 2.5 1.9 1.3 3.4 1.9 3.3 3.3 2.8 2.6 2.8 2.6 2.2 2.3 Holdings of shares and other equity 0 0 0 0 0 0 0 0 0 0 0 0 0 0 0 Claims on private non-financial corporations 4 979.4 4 972.2 4 830.4 4 828.3 4 833.6 4 764.1 4 735.1 4 773.5 4 615.0 4 611.5 4 625.4 4 553.1 4 521.7 4 559.4 4 568.7 Loans 4 906.2 4 900.8 4 750.8 4 742.2 4 747.5 4 677.1 4 642.3 4 678.2 4 523.4 4 521.1 4 534.6 4 467.5 4 435.1 4 469.4 4 472.9 Holdings of securities other than shares 0.2 0.2 1.8 8.3 8.3 8.7 8.7 11.0 11.0 11.0 11.0 11.1 11.1 11.1 11.1 Holdings of shares and other equity 73.1 71.2 77.8 77.8 77.9 78.4 84.1 84.4 80.6 79.4 79.7 74.5 75.5 79.0 84.7 Claims on households 4 717.7 4 686.0 4 633.1 4 598.4 4 575.0 4 548.2 4 524.6 4 493.6 4 463.0 4 435.5 4 413.1 4 384.8 4 348.2 4 322.7 4 251.6 Loans 4 717.7 4 686.0 4 633.1 4 598.4 4 575.0 4 548.2 4 524.6 4 493.6 4 463.0 4 435.5 4 413.1 4 384.8 4 348.2 4 322.7 4 251.6 Holdings of securities other than shares 0 0 0 0 0 0 0 0 0 0 0 0 0 0 0 Fixed assets 87.1 88.4 87.2 85.1 89.6 89.8 89.9 90.4 90.4 90.8 91.4 92.0 90.0 91.8 93.7 Other assets 361.4 341.5 372.0 352.4 337.1 349.5 357.4 348.7 360.8 348.6 350.9 346.0 327.5 333.9 330.1 Claims on resident MFIs 224.7 228.1 246.3 255.5 195.3 197.7 249.3 262.7 239.2 258.0 220.0 238.4 267.8 258.6 218.7 Holdings of MFI securities other than shares 1.0 1.0 0 0 0 0 0 0 0 0 0 0 0 0 0 Money market fund shares and units 0.4 0.4 0.4 0.4 0.4 0.4 0.4 0.4 0.4 0.4 0.4 0.4 0.4 0.4 0.4 Holdings of MFI shares and other equity 0 0 0 0 0 0 0 0 0 0 0 0 0 0 0 TOTAL ASSETS 19 762.2 19 760.7 19 920.5 19 996.7 19 822.8 19 986.5 20 135.3 20 194.0 20 187.0 20 358.5 20 341.9 19 996.5 20 005.2 19 978.8 20 562.3 9.a
  • 52. 51 AGGREGATED BALANCE SHEET OF MFIs (EXCLUDING LATVIJAS BANKA) (at end of period; millions of lats) 2012 2013 X XI XII I II III IV V VI VII VIII IX X XI XII Overnight deposits in lats 1 828.4 1 903.6 2 025.7 1 964.6 1 984.1 1 935.5 1 980.9 1 984.5 2 044.1 2 068.3 2 093.8 2 111.7 2 164.7 2 266.9 2 575.2 Financial institutions 69.5 60.1 67.1 63.7 59.8 52.1 61.2 58.5 68.5 72.9 80.8 90.1 98.8 103.3 95.6 Public non-financial corporations 107.1 125.2 121.6 126.3 143.4 144.3 144.6 142.8 154.2 147.6 134.7 146.9 125.8 143.0 135.6 Private non-financial corporations 773.7 812.4 877.2 847.7 838.4 784.7 805.1 811.2 804.9 827.9 851.6 834.5 873.2 894.3 1 041.3 Households 878.1 905.9 959.8 926.9 942.5 954.4 970.1 972.0 1 016.4 1 019.9 1 026.7 1 040.2 1 066.8 1 126.2 1 302.7 Time deposits in lats 643.4 623.8 593.6 588.8 582.4 583.3 572.0 539.6 510.7 462.8 455.6 457.5 460.0 442.0 418.5 Financial institutions 118.8 118.1 108.3 106.4 109.7 112.4 108.2 106.5 99.4 96.6 101.0 96.4 90.7 84.0 112.0 Public non-financial corporations 79.5 73.2 87.9 71.6 69.8 77.2 77.3 64.1 54.3 45.4 30.4 29.3 35.4 35.3 21.8 Private non-financial corporations 77.0 76.0 70.7 83.9 79.1 77.1 77.2 66.0 67.1 38.9 46.9 55.6 57.5 50.5 25.8 Households 368.0 356.4 326.7 327.0 323.8 316.6 309.4 303.0 289.9 281.9 277.3 276.2 276.3 272.2 258.9 Deposits redeemable at notice in lats 88.1 90.7 93.7 96.6 99.0 103.9 105.8 104.9 106.8 110.9 115.0 120.9 127.0 137.5 149.5 Financial institutions 7.4 7.4 7.3 7.4 7.3 7.2 7.3 7.2 7.2 7.1 7.2 7.2 7.3 7.3 7.3 Public non-financial corporations 0.6 0.6 0.6 0.6 0.7 0.7 0.7 0.5 0.5 0.5 0.5 0.5 0.9 0.9 0.9 Private non-financial corporations 5.3 5.1 5.2 5.1 5.4 8.6 8.6 6.5 5.5 5.7 6.0 6.6 5.9 9.8 10.3 Households 74.9 77.6 80.6 83.5 85.6 87.4 89.3 90.7 93.6 97.6 101.3 106.6 112.9 119.5 131.0 Repos in lats 0 0 0 0 0 0 0 0 0 0 0 0 0 0 0 Foreign currency deposits of residents 2 949.9 3 007.9 2 980.0 3 060.5 3 084.7 3 003.2 3 032.9 3 032.7 3 017.0 3 025.2 3 064.6 2 992.1 3 037.0 3 089.1 3 299.6 Financial institutions 275.2 271.1 280.4 300.0 331.5 291.9 274.1 254.1 275.6 272.2 270.5 255.3 244.0 254.0 270.5 Public non-financial corporations 131.0 156.8 150.2 156.9 153.9 134.1 188.1 207.0 187.6 179.6 165.3 140.9 159.8 183.8 242.6 Private non-financial corporations 939.9 972.8 925.0 989.8 977.2 948.6 929.4 925.5 906.6 924.7 969.1 936.4 973.5 982.4 1 091.6 Households 1 603.7 1 607.2 1 624.5 1 613.8 1 622.1 1 628.7 1 641.3 1 646.1 1 647.2 1 648.8 1 659.7 1 659.5 1 659.6 1 668.9 1 694.9 Deposits of central government 475.9 440.1 526.2 667.1 622.4 596.3 615.9 637.9 625.1 617.5 667.0 692.5 687.1 649.8 657.6 Overnight deposits in lats 17.7 16.1 13.6 12.8 12.7 11.9 14.0 13.4 10.7 17.1 14.1 13.9 12.1 9.4 9.9 Time deposits in lats 57.0 50.7 52.6 56.1 45.7 47.6 48.7 47.5 22.8 10.3 18.8 13.8 11.8 5.5 5.0 Deposits redeemable at notice and repos in lats 0 0 0 0 0 0 0 0 0 0 0 0 0.5 0.8 0.8 Foreign currency deposits 401.1 373.3 460.0 598.2 563.9 536.7 553.2 576.9 591.6 590.1 634.0 664.7 662.8 634.1 641.9 Deposits of local government 217.0 215.6 170.5 180.9 181.0 189.9 209.0 217.7 202.8 193.7 195.0 187.7 177.3 174.4 137.6 Overnight deposits in lats 145.0 145.4 106.6 120.7 124.7 130.7 153.0 153.9 143.8 138.1 140.5 139.7 125.4 122.9 90.6 Time deposits in lats 14.4 14.6 12.8 2.0 2.0 2.1 2.6 1.9 1.7 0.7 0.7 0.7 0.6 0.5 0.5 Deposits redeemable at notice and repos in lats 2.1 2.1 2.0 1.7 1.7 1.7 1.6 1.6 1.6 1.6 1.6 1.6 1.6 1.6 1.5 Foreign currency deposits 55.5 53.5 49.1 56.5 52.6 55.3 51.9 60.3 55.7 53.3 52.2 45.7 49.7 49.5 45.0 Transit funds x x x x x x x x x x x x x x x 9.b
  • 53. 52 AGGREGATED BALANCE SHEET OF MFIs (EXCLUDING LATVIJAS BANKA) (CONT.) (at end of period; millions of lats) 2012 2013 X XI XII I II III IV V VI VII VIII IX X XI XII Foreign liabilities 9 789.8 9 683.7 9 735.5 9 701.3 9 556.6 9 828.7 9 808.4 9 873.8 9 913.3 10 100.7 10 012.7 9 668.8 9 599.9 9 412.9 9 597.9 Liabilities to Latvijas Banka 0 0 0 0 0 0 0 0 0 0 0 0 0 0 10.0 Money market fund shares and units 66.6 66.5 62.4 65.0 64.8 64.0 62.8 62.4 61.6 57.5 56.3 55.2 53.3 51.5 47.0 Debt securities issued 113.5 138.7 139.6 139.0 159.4 187.8 196.1 195.5 232.2 229.7 233.4 230.1 251.9 278.1 234.6 Capital and reserves 1 912.2 1 900.5 1 910.8 1 928.9 1 947.8 1 891.6 1 932.7 1 943.4 1 931.5 1 950.9 1 974.6 1 998.3 2 011.1 2 024.8 2 043.4 Residents 512.2 500.5 493.4 511.5 529.2 471.3 516.0 531.9 520.2 539.6 563.3 581.3 594.1 607.3 580.4 Retained earnings of the reporting year 140.5 128.3 122.4 22.7 39.7 45.8 74.8 89.2 77.1 92.5 117.7 133.2 169.5 183.9 172.6 Non-residents 1 400.0 1 400.0 1 417.4 1 417.4 1 418.6 1 420.2 1 416.6 1 411.5 1 411.3 1 411.3 1 411.3 1 417.0 1 417.0 1 417.5 1 463.0 Provisions 1 126.4 1 115.3 1 053.3 1 033.4 1 027.6 1 015.3 998.8 1 006.7 967.5 956.6 929.8 876.8 846.5 837.2 791.4 Other liabilities (incl. subordinated liabilities) 327.0 342.7 383.1 315.4 318.0 389.3 370.3 332.8 334.5 326.6 323.3 361.0 325.5 360.2 383.8 Liabilities to resident MFIs 224.0 231.6 246.2 255.1 195.0 197.7 249.4 262.2 240.0 258.0 220.8 243.9 264.0 254.4 216.2 TOTAL LIABILITIES 19 762.2 19 760.7 19 920.5 19 996.7 19 822.8 19 986.5 20 135.3 20 194.0 20 187.0 20 358.5 20 341.9 19 996.5 20 005.2 19 978.8 20 562.3 Memo items Trust assets 578.8 688.7 686.0 647.3 704.3 716.2 668.0 802.1 696.4 834.0 782.3 839.8 901.6 667.4 895.4 Foreign 484.7 612.1 611.5 534.5 595.3 609.0 561.1 693.2 584.6 730.5 682.0 740.6 809.0 579.1 805.7 Domestic 94.0 76.6 74.5 112.8 108.9 107.2 106.9 109.0 111.8 103.5 100.3 99.2 92.6 88.4 89.7 Trust liabilities 578.8 688.7 686.0 647.3 704.3 716.2 668.0 802.1 696.4 834.0 782.3 839.8 901.6 667.4 895.4 Foreign 523.4 633.2 636.1 597.5 653.1 664.9 616.3 750.8 645.5 783.0 732.1 789.2 852.3 612.9 840.7 Domestic 55.4 55.4 49.9 49.8 51.2 51.3 51.7 51.3 50.9 51.0 50.2 50.6 49.2 54.6 54.7 9.b
  • 54. 53 Net foreign assets Net domestic assets Total (M2X) Credit to residents Other items (net) General government (net) Households Financial institutions and private non-financial corporations Public non-financial corporations 2012 X 202.8 9 819.2 –917.3 4 717.7 5 519.3 499.5 –3 458.8 6 360.4 6 563.2 XI 378.0 9 785.1 –905.6 4 686.0 5 501.5 503.2 –3 478.8 6 306.3 6 684.2 XII 613.7 9 593.3 –903.8 4 633.1 5 359.5 504.5 –3 431.6 6 161.7 6 775.4 2013 I 577.3 9 550.6 –923.9 4 598.4 5 372.0 504.1 –3 382.0 6 168.6 6 745.8 II 610.8 9 597.3 –855.4 4 575.0 5 381.5 496.2 –3 444.3 6 153.0 6 763.9 III 642.1 9 465.7 –908.0 4 548.2 5 326.3 499.2 –3 470.1 5 995.6 6 637.7 IV 786.2 9 336.4 –963.3 4 524.6 5 278.1 497.0 –3 448.6 5 887.8 6 674.1 V 771.4 9 285.6 –1 021.6 4 493.6 5 321.4 492.2 –3 426.3 5 859.3 6 630.7 VI 820.1 9 231.3 –911.5 4 463.0 5 197.3 482.5 –3 397.0 5 834.3 6 654.5 VII 763.1 9 249.5 –877.6 4 435.5 5 208.6 483.0 –3 403.6 5 845.9 6 609.0 VIII 837.7 9 180.2 –953.3 4 413.1 5 239.5 480.9 –3 380.7 5 799.5 6 637.1 IX 845.4 9 094.6 –966.9 4 384.8 5 194.1 482.6 –3 404.4 5 690.2 6 535.6 X 967.2 8 991.8 –961.7 4 348.2 5 113.7 491.6 –3 391.6 5 600.2 6 567.4 XI 915.3 9 198.3 –781.6 4 322.7 5 167.3 489.9 –3 455.5 5 742.8 6 658.0 XII 844.1 9 454.2 –487.4 4 251.6 5 200.6 489.4 –3 386.2 6 068.0 6 912.1 MONETARY SURVEY (at end of period; millions of lats) Currency outside MFIs Overnight deposits (resident) Time deposits (resident) Total (M2X) Households Financial institutions and private non-financial corporations Public non-financial corporations Households Financial institutions and private non-financial corporations Public non-financial corporations 2012 X 1 053.4 3 327.6 1 556.8 1 600.0 170.8 2 182.3 1 367.9 666.9 147.5 6 563.2 XI 1 058.2 3 457.1 1 614.3 1 643.1 199.7 2 168.9 1 332.8 680.0 156.1 6 684.2 XII 1 082.4 3 586.6 1 712.4 1 692.3 181.9 2 106.4 1 279.1 648.9 178.4 6 775.4 2013 I 1 035.3 3 647.0 1 668.7 1 774.2 204.1 2 063.4 1 282.4 629.8 151.2 6 745.8 II 1 013.7 3 667.1 1 686.0 1 775.5 205.6 2 083.2 1 288.1 632.9 162.2 6 763.9 III 1 011.8 3 550.6 1 709.4 1 649.5 191.7 2 075.3 1 277.7 633.0 164.6 6 637.7 IV 982.3 3 650.4 1 746.0 1 712.6 191.8 2 041.3 1 264.1 558.4 218.8 6 674.1 V 969.1 3 673.9 1 762.1 1 700.8 211.0 1 987.7 1 249.6 534.7 203.4 6 630.7 VI 976.0 3 788.1 1 831.7 1 722.6 233.8 1 890.4 1 215.4 512.2 162.8 6 654.5 VII 941.7 3 823.8 1 850.1 1 750.1 223.6 1 843.5 1 198.0 495.9 149.6 6 609.0 VIII 908.2 3 906.2 1 871.2 1 833.5 201.4 1 822.8 1 193.8 499.5 129.5 6 637.1 IX 853.5 3 893.0 1 891.6 1 786.8 214.6 1 789.1 1 190.9 495.2 103.0 6 535.6 X 778.8 4 002.5 1 928.5 1 881.5 192.5 1 786.2 1 187.2 469.5 129.5 6 567.4 XI 722.6 4 174.4 2 011.1 1 929.3 234.0 1 761.1 1 175.7 456.3 129.1 6 658.0 XII 469.3 4 611.5 2 239.6 2 141.2 230.7 1 831.4 1 148.0 513.2 170.2 6 912.1 10.
  • 55. 54 FOREIGN ASSETS AND LIABILITIES OF MFIs (EXCLUDING LATVIJAS BANKA) (at end of period; millions of lats) 2012 2013 X XI XII I II III IV V VI VII VIII IX X XI XII Claims on MFIs 3 792.7 3 760.7 3 953.6 4 088.7 3 734.2 3 891.4 3 956.7 3 831.0 4 137.0 4 339.1 4 228.1 3 846.4 3 927.2 3 774.4 3 764.8 Loans Overnight 2 326.3 2 283.4 2 332.3 2 456.9 2 190.6 2 262.4 2 180.9 2 301.4 2 519.9 2 621.7 2 305.5 2 100.3 2 195.9 2 042.7 2 170.6 Short-term 877.0 859.8 1 010.0 1 021.5 903.6 1 006.5 1 154.3 914.1 1 007.5 1 148.0 1 354.8 1 145.3 1 115.3 1 104.3 937.0 Long-term 15.2 15.3 15.1 15.0 22.1 22.5 21.6 17.1 20.4 18.1 19.7 19.4 18.6 15.3 31.0 Redeemable at notice 0 13.7 13.1 17.4 11.1 10.8 10.8 15.9 12.8 13.3 15.1 14.3 9.6 12.5 14.3 Holdings of securities other than shares 518.7 532.9 527.4 522.1 551.0 533.4 533.3 526.5 520.2 482.4 477.5 511.2 529.6 541.1 553.4 Holdings of shares and other equity 0.9 1.0 1.1 1.2 1.2 1.2 1.3 1.4 1.6 1.1 0.9 1.3 3.6 3.8 3.8 Other claims 54.6 54.6 54.6 54.6 54.6 54.6 54.6 54.6 54.6 54.6 54.6 54.6 54.6 54.6 54.6 Claims on non-MFIs 2 163.2 2 174.8 2 115.0 2 077.8 2 172.7 2 239.7 2 297.4 2 413.9 2 301.1 2 307.2 2 402.4 2 403.3 2 270.6 2 318.0 2 372.4 Loans Short-term 459.1 484.3 471.2 443.8 464.9 486.0 469.1 520.7 478.5 499.2 507.7 494.1 492.9 506.1 487.2 Long-term 702.3 706.3 702.8 700.1 717.3 742.1 815.9 888.0 874.4 886.5 881.9 852.2 849.5 855.8 866.1 Holdings of securities other than shares Government 620.2 578.1 537.9 539.3 573.4 592.1 577.7 576.5 534.0 522.1 590.2 634.9 496.4 509.6 575.9 Private sector 320.5 342.1 337.5 324.9 347.9 351.3 366.0 360.0 343.7 330.4 348.2 348.2 358.6 369.1 368.7 Holdings of shares and other equity 31.9 34.8 34.5 38.5 38.5 37.5 38.1 38.1 38.0 36.5 42.0 41.4 40.8 41.8 39.9 Other claims 29.3 29.3 31.1 31.1 30.6 30.6 30.6 30.6 32.5 32.4 32.4 32.4 32.4 35.6 34.5 Vault cash in foreign currencies 76.1 70.1 76.9 72.7 70.6 63.5 72.1 67.2 66.9 67.2 61.0 64.1 61.7 65.3 71.1 Other assets Other assets 200.7 181.2 177.8 165.3 201.7 224.6 229.9 192.4 168.3 130.7 126.2 136.1 135.3 107.4 160.0 Total foreign assets 6 232.8 6 186.8 6 323.3 6 404.5 6 179.2 6 419.1 6 556.1 6 504.5 6 673.3 6 844.2 6 817.7 6 449.8 6 394.7 6 265.1 6 368.2 Memo items Trust assets 484.7 612.1 611.5 534.5 595.3 609.0 561.1 693.2 584.6 730.5 682.0 740.6 809.0 579.1 805.7 11.a
  • 56. 55 SELECTED ITEMS IN THE MONTHLY FINANCIAL POSITION REPORT OF MFIs (EXCLUDING LATVIJAS BANKA) BY GROUP OF COUNTRIES (at end of period; millions of lats) Claims on MFIs Loans to non-MFIs Liabilities to MFIs Deposits by non-MFIs EU Other countries and international institutions EU Other countries and international institutions EU Other countries and international institutions EU Other countries and international institutions incl. euro area countries incl. euro area countries incl. euro area countries incl. euro area countries 2012 X 2 389.6 1 352.6 828.9 532.8 364.6 628.7 3 261.9 1 694.2 640.2 1 745.8 619.1 3 972.8 XI 2 287.8 1 189.2 884.4 548.8 349.2 641.8 3 169.1 1 688.5 690.5 1 714.3 614.7 3 954.3 XII 2 380.9 1 225.2 989.6 549.3 351.4 624.7 3 144.9 1 705.1 683.4 1 727.4 640.3 4 024.4 2013 I 2 548.1 1 555.1 962.7 546.0 355.5 597.9 2 933.0 1 647.3 703.5 1 790.5 642.7 4 095.8 II 2 178.9 1 320.1 948.5 541.4 352.5 640.8 2 814.7 1 626.7 637.5 1 772.6 609.3 4 162.4 III 2 187.4 1 339.2 1 114.8 575.0 363.9 653.1 2 943.8 1 670.9 634.2 1 872.3 667.9 4 217.4 IV 2 267.2 1 407.9 1 100.3 652.5 428.9 632.5 2 922.7 1 688.6 619.1 1 840.2 726.4 4 234.3 V 2 161.9 1 375.4 1 086.6 752.1 455.2 656.5 2 843.6 1 695.1 612.2 1 874.3 747.8 4 297.6 VI 2 461.3 1 557.5 1 099.3 713.1 446.9 639.8 2 948.4 1 697.2 613.8 1 873.2 760.8 4 314.9 VII 2 700.4 1 663.4 1 100.7 732.1 464.2 653.7 2 932.3 1 621.3 646.3 1 976.2 889.2 4 384.5 VIII 2 667.8 1 611.7 1 027.3 743.1 472.4 646.4 2 844.9 1 589.3 613.5 2 055.2 942.5 4 358.2 IX 2 283.2 1 377.4 996.1 709.9 443.6 636.4 2 603.2 1 416.8 604.9 1 931.0 801.9 4 335.4 X 2 332.5 1 437.9 1 006.9 700.3 436.9 642.0 2 407.9 1 359.8 604.8 2 023.4 869.7 4 376.0 XI 2 178.9 1 319.6 996.0 681.6 408.3 680.3 2 355.7 1 307.4 597.3 2 038.5 909.6 4 174.0 XII 1 969.6 1 240.7 1 183.4 683.9 400.0 669.5 2 403.9 1 283.3 608.0 2 082.2 913.4 4 267.1 FOREIGN ASSETS AND LIABILITIES OF MFIs (EXCLUDING LATVIJAS BANKA) (at end of period; millions of lats) 2012 2013 X XI XII I II III IV V VI VII VIII IX X XI XII Liabilities to MFIs Overnight 333.1 339.1 313.0 377.0 343.2 502.1 487.0 415.4 442.0 463.1 516.0 545.1 535.2 532.1 523.3 Short-term 545.9 511.8 552.2 372.7 345.9 373.1 389.4 409.6 503.1 636.0 528.3 502.4 363.0 365.6 546.2 Long-term 3 023.1 3 008.7 2 963.1 2 886.8 2 763.2 2 702.8 2 665.4 2 630.8 2 617.0 2 479.4 2 414.1 2 160.6 2 114.6 2 055.3 1 942.4 Redeemable at notice 0 0 0 0 0 0 0 0 0 0 0 0 0 0 0 From which liabilities to associated and affiliated MFIs 3 776.1 3 736.8 3 713.5 3 518.0 3 311.8 3 439.5 3 419.1 3 332.8 3 466.4 3 481.4 3 356.4 3 115.0 2 922.3 2 862.4 2 935.4 Non-MFI deposits Overnight 4 828.4 4 799.9 4 901.9 5 095.6 5 130.7 5 290.4 5 289.6 5 415.1 5 434.2 5 598.0 5 698.9 5 551.8 5 713.1 5 611.1 5 682.3 Short-term 341.1 324.3 326.9 294.3 309.9 288.8 279.5 248.4 254.6 269.2 231.2 236.5 216.3 199.6 258.4 Long-term 452.1 457.0 441.2 421.9 421.4 455.6 439.3 445.5 442.4 440.5 422.5 411.0 407.6 335.9 347.6 Redeemable at notice 97.0 87.3 81.8 74.4 72.9 73.4 66.2 62.9 56.9 53.1 60.8 67.2 62.4 65.9 61.0 Other liabilities Other liabilities1 169.2 155.5 155.5 178.7 169.4 142.5 192.1 246.1 163.0 161.5 140.9 194.2 187.8 247.3 236.7 Total foreign liabilities 9 789.8 9 683.7 9 735.5 9 701.3 9 556.6 9 828.7 9 808.4 9 873.8 9 913.3 10 100.7 10 012.7 9 668.8 9 599.9 9 412.9 9 597.9 Memo items Trust liabilities 523.4 633.2 636.1 597.5 653.1 664.9 616.3 750.8 645.5 783.0 732.1 789.2 852.3 612.9 840.7 1 Including subordinated liabilities. 11.b 12.
  • 57. 56 MATURITY PROFILE OF DEPOSITS OF RESIDENT FINANCIAL INSTITUTIONS, NON-FINANCIAL CORPORATIONS AND HOUSEHOLDS (IN LATS AND FOREIGN CURRENCIES) (at end of period; millions of lats) 2012 2013 X XI XII I II III IV V VI VII VIII IX X XI XII Overnight deposits Amount 3 327.5 3 457.1 3 586.6 3 647.1 3 667.0 3 550.6 3 650.4 3 673.9 3 788.2 3 823.8 3 906.2 3 893.1 4 002.5 4 174.4 4 611.4 %1 60.4 61.5 63.0 63.9 63.8 63.1 64.2 64.9 66.7 67.5 68.2 68.5 69.2 70.3 71.6 Time deposits Maturity of 1–6 months Amount 620.2 633.0 635.5 594.6 610.4 578.9 563.1 509.0 436.8 402.0 396.8 361.2 336.2 333.8 425.9 %1 11.2 11.3 11.2 10.4 10.6 10.3 9.9 9.0 7.7 7.1 6.9 6.4 5.8 5.6 6.6 Maturity of 6–12 months Amount 847.3 833.4 778.4 803.6 810.9 797.1 781.4 776.1 756.3 743.1 729.7 719.8 725.2 698.9 666.9 %1 15.4 14.8 13.7 14.1 14.1 14.2 13.7 13.7 13.3 13.1 12.7 12.7 12.5 11.8 10.4 Long-term Amount 506.9 491.7 479.0 446.9 438.5 466.9 459.5 461.8 451.4 446.4 435.6 437.0 437.7 428.6 423.3 %1 9.2 8.7 8.4 7.8 7.6 8.3 8.1 8.2 8.0 7.9 7.7 7.7 7.6 7.2 6.6 Maturity of 1–2 years Amount 260.9 244.2 228.4 191.1 179.6 199.6 197.4 204.2 195.7 192.4 187.8 194.7 194.0 196.6 199.7 %1 4.7 4.3 4.0 3.3 3.1 3.5 3.5 3.6 3.4 3.4 3.3 3.4 3.4 3.3 3.1 Maturity of over 2 years Amount 246.0 247.5 250.6 255.8 258.9 267.2 262.1 257.6 255.7 254.0 247.8 242.3 243.8 232.0 223.6 %1 4.5 4.4 4.4 4.5 4.5 4.7 4.6 4.6 4.5 4.5 4.4 4.3 4.2 3.9 3.5 Deposits redeemable at notice Up to 3 months Amount 207.8 210.8 213.7 218.3 223.3 232.5 234.9 238.4 243.3 249.6 258.3 268.6 284.6 297.4 312.8 %1 3.8 3.7 3.7 3.8 3.9 4.1 4.1 4.2 4.3 4.4 4.5 4.7 4.9 5.0 4.8 Over 3 months Amount 0 0 0 0 0 0 2.4 2.4 2.4 2.4 2.4 2.4 2.4 2.5 2.5 %1 0 0 0 0 0 0 0 0 0 0 0 0 0 0.1 0 Repos Amount 0 0 0 0 0 0 0 0 0 0 0 0 0 0 0 %1 0 0 0 0 0 0 0 0 0 0 0 0 0 0 0 Total deposits 5 509.8 5 626.0 5 693.0 5 710.5 5 750.2 5 625.9 5 691.7 5 661.7 5 678.5 5 667.3 5 729.0 5 682.2 5 788.6 5 935.5 6 442.7 1 As percent of total deposits of resident financial institutions, non-financial corporations and households. 13.
  • 58. 57 OFIs and financial auxiliaries Overnight With agreed maturity Redeemable at notice Repos In lats Up to 1 year 1–2 years Over 2 years Up to 3 months Over 3 months 2012 X 58.5 51.1 2.6 60.3 7.4 0 0 179.9 47.6 XI 61.6 27.6 1.1 59.0 7.4 0 0 156.8 47.7 XII 64.8 26.7 1.1 59.1 7.3 0 0 159.1 44.4 2013 I 65.5 25.9 4.9 58.6 7.4 0 0 162.2 47.4 II 66.7 25.7 5.1 58.8 7.3 0 0 163.6 41.1 III 57.2 18.7 5.1 65.0 7.2 0 0 153.2 36.2 IV 68.8 19.6 4.3 65.1 7.3 0 0 165.0 44.2 V 58.8 19.6 4.4 65.2 7.2 0 0 155.2 38.1 VI 73.3 31.0 4.4 65.8 7.2 0 0 181.7 40.2 VII 56.2 60.5 1.0 65.4 7.1 0 0 190.1 32.9 VIII 78.4 61.2 1.0 61.8 7.2 0 0 209.7 44.4 IX 60.0 62.3 4.1 59.6 7.2 0 0 193.2 48.8 X 72.4 27.6 6.2 59.6 7.2 0 0 173.1 51.5 XI 85.4 28.3 6.4 60.8 7.3 0 0 188.1 57.8 XII 119.2 21.3 6.9 56.0 7.2 0 0 210.7 80.3 DEPOSITS BY FINANCIAL INSTITUTIONS (IN LATS AND FOREIGN CURRENCIES) (at end of period; millions of lats) Insurance corporations and pension funds Overnight With agreed maturity Redeemable at notice Repos In lats Up to 1 year 1–2 years Over 2 years Up to 3 months Over 3 months 2012 X 84.9 108.5 46.1 51.0 0.5 0 0 291.0 148.1 XI 82.3 117.9 47.8 51.5 0.5 0 0 300.0 138.0 XII 88.4 117.6 45.1 52.5 0.4 0 0 304.0 138.3 2013 I 113.3 105.5 43.1 53.0 0.4 0 0 315.3 130.0 II 129.7 116.7 41.7 56.3 0.4 0 0 344.8 135.7 III 111.6 88.4 52.4 57.6 0.4 0 0 310.4 135.6 IV 106.7 73.9 50.5 54.3 0.3 0 0 285.8 132.4 V 97.5 68.1 56.3 48.8 0.3 0 0 271.1 134.2 VI 106.9 61.4 52.6 47.8 0.3 0 0 269.0 135.0 VII 95.5 62.7 54.0 46.1 0.3 0 0 258.6 143.7 VIII 92.7 58.3 55.7 42.7 0.3 0 0 249.8 144.6 IX 108.8 50.8 54.5 41.4 0.3 0 0 255.7 144.8 X 119.5 50.3 52.9 44.8 0.3 0 0 267.8 145.3 XI 126.1 43.7 54.9 35.5 0.3 0 0 260.5 136.7 XII 84.5 96.7 57.7 35.5 0.3 0 0 274.8 134.6 14.a
  • 59. 58 Private non-financial corporations Overnight With agreed maturity Redeemable at notice Repos In lats Up to 1 year 1–2 years Over 2 years Up to 3 months Over 3 months 2012 X 1 456.5 278.2 20.3 24.3 16.7 0 0 1 796.0 856.0 XI 1 499.1 306.4 21.0 24.7 15.1 0 0 1 866.3 893.4 XII 1 539.1 278.5 21.0 24.7 14.8 0 0 1 878.1 953.1 2013 I 1 595.5 274.5 15.8 25.9 14.7 0 0 1 926.5 936.7 II 1 579.1 265.0 14.9 26.0 15.1 0 0 1 900.1 922.9 III 1 480.8 270.3 20.6 26.5 20.7 0 0 1 818.9 870.4 IV 1 537.1 214.8 21.1 26.7 20.6 0 0 1 820.2 890.8 V 1 544.5 193.2 25.9 27.2 18.5 0 0 1 809.2 883.6 VI 1 542.5 174.0 23.2 26.4 18.0 0 0 1 784.1 877.5 VII 1 598.4 132.9 22.5 25.7 17.8 0 0 1 797.2 872.5 VIII 1 662.3 147.0 20.8 25.3 18.1 0 0 1 873.6 904.5 IX 1 618.0 143.6 27.4 24.9 19.2 0 0 1 833.1 896.7 X 1 689.5 151.4 28.4 22.0 18.9 0 0 1 910.2 936.6 XI 1 717.8 150.3 28.3 18.9 21.7 0 0 1 937.0 954.6 XII 1 937.4 167.3 25.7 15.2 23.3 0 0 2 168.9 1 077.3 DEPOSITS BY NON-FINANCIAL CORPORATIONS (IN LATS AND FOREIGN CURRENCIES) (at end of period; millions of lats) Public non-financial corporations Overnight With agreed maturity Redeemable at notice Repos In lats Up to 1 year 1–2 years Over 2 years Up to 3 months Over 3 months 2012 X 170.8 125.0 20.3 0.1 2.1 0 0 318.2 187.2 XI 199.7 138.1 15.8 0.1 2.2 0 0 355.8 199.0 XII 181.9 162.1 15.4 0.1 0.8 0 0 360.3 210.1 2013 I 204.1 141.0 9.2 0.1 0.9 0 0 355.4 198.5 II 205.6 151.8 9.2 0.1 1.1 0 0 367.7 213.8 III 191.7 153.1 10.2 0.1 1.2 0 0 356.3 222.2 IV 191.8 207.2 10.2 0.1 1.3 0 0 410.7 222.5 V 211.0 195.9 6.1 0.1 1.3 0 0 414.4 207.4 VI 233.8 155.9 5.4 0.1 1.4 0 0 396.6 209.0 VII 223.6 138.7 8.8 0.6 1.5 0 0 373.2 193.6 VIII 201.4 121.9 5.4 0.6 1.7 0 0 331.0 165.6 IX 214.6 95.9 4.6 0.6 1.9 0 0 317.6 176.7 X 192.5 116.6 2.3 0.6 10.0 0 0 322.0 162.2 XI 234.0 116.1 2.3 0.6 10.2 0 0 363.1 179.3 XII 230.7 158.7 2.3 0.6 8.6 0 0 400.8 158.3 14.b
  • 60. 59 DEPOSITS BY GOVERNMENT AND NON-RESIDENTS (IN LATS AND FOREIGN CURRENCIES) (at end of period; millions of lats) General government Non-residents Central government Local government In lats MFIs Non-MFIs In lats General government Other 2012 X 475.9 217.0 692.8 236.2 3 902.0 5 718.6 8.2 5 710.4 9 620.7 139.1 XI 440.1 215.6 655.7 228.9 3 859.6 5 668.6 8.2 5 660.4 9 528.2 137.6 XII 526.2 170.5 696.7 187.5 3 828.2 5 751.7 10.9 5 740.9 9 580.0 162.4 2013 I 667.1 180.9 848.0 193.4 3 636.5 5 886.2 7.9 5 878.3 9 522.7 187.3 II 622.4 181.0 803.4 186.9 3 452.3 5 935.0 4.0 5 930.9 9 387.2 171.7 III 596.3 189.9 786.1 194.1 3 578.0 6 108.2 4.2 6 104.0 9 686.2 171.2 IV 615.9 209.0 825.0 219.8 3 541.8 6 074.5 4.5 6 070.0 9 616.3 136.8 V 637.9 217.7 855.6 218.4 3 455.8 6 171.9 4.0 6 167.9 9 627.7 135.8 VI 625.1 202.8 827.9 180.6 3 562.2 6 188.1 3.5 6 184.7 9 750.3 114.6 VII 617.5 193.7 811.2 167.8 3 578.5 6 360.7 3.5 6 357.3 9 939.3 131.8 VIII 667.0 195.0 862.1 175.9 3 458.4 6 413.3 3.6 6 409.7 9 871.8 134.1 IX 692.5 187.7 880.2 169.7 3 208.1 6 266.4 3.6 6 262.9 9 474.6 180.4 X 687.1 177.3 864.4 151.9 3 012.8 6 399.4 3.2 6 396.1 9 412.1 165.1 XI 649.8 174.4 824.3 140.7 2 953.0 6 212.6 3.3 6 209.2 9 165.6 162.7 XII 657.6 137.6 795.2 108.3 3 011.9 6 349.3 3.0 6 346.3 9 361.2 96.6 14.d DEPOSITS BY HOUSEHOLDS (IN LATS AND FOREIGN CURRENCIES) (at end of period; millions of lats) Households Overnight With agreed maturity Redeemable at notice Repos In lats Up to 1 year 1–2 years Over 2 years Up to 3 months Over 3 months 2012 X 1 556.8 904.8 171.6 110.4 181.1 0 0 2 924.7 1 320.9 XI 1 614.3 876.5 158.5 112.2 185.7 0 0 2 947.1 1 339.9 XII 1 712.4 828.9 145.8 114.1 190.4 0 0 2 991.6 1 367.1 2013 I 1 668.7 851.4 118.1 118.0 194.9 0 0 2 951.1 1 337.4 II 1 686.0 862.0 108.8 117.7 199.4 0 0 2 974.0 1 351.9 III 1 709.4 845.5 111.3 117.9 202.9 0 0 2 987.1 1 358.5 IV 1 746.0 828.9 111.4 115.9 205.4 2.4 0 3 010.1 1 368.8 V 1 762.1 808.4 111.5 116.2 211.1 2.4 0 3 011.7 1 365.6 VI 1 831.7 770.9 110.2 115.5 216.3 2.4 0 3 047.1 1 399.9 VII 1 850.1 750.3 106.2 116.3 222.8 2.4 0 3 048.2 1 399.4 VIII 1 871.2 738.1 104.9 117.4 230.9 2.4 0 3 065.0 1 405.3 IX 1 891.6 728.3 104.2 115.8 240.1 2.4 0 3 082.5 1 423.0 X 1 928.5 715.7 104.2 116.8 248.1 2.4 0 3 115.6 1 456.0 XI 2 011.1 694.3 104.8 116.2 257.9 2.5 0 3 186.8 1 517.9 XII 2 239.6 648.8 107.1 116.3 273.4 2.5 0 3 387.6 1 692.7 14.c
  • 61. 60 LOANS TO FINANCIAL INSTITUTIONS AND NON-FINANCIAL CORPORATIONS (at end of period; millions of lats) Insurance corporations and pension funds OFIs and financial auxiliaries Public non-financial corporations Private non-financial corporations Up to 1 year In lats Up to 1 year In lats Up to 1 year 1–5 years Over 5 years In lats Up to 1 year 1–5 years Over 5 years In lats 2012 X 0 0 0 162.2 285.4 53.8 3.3 31.9 464.4 499.5 27.8 1 255.2 1 218.5 2 432.5 4 906.2 763.5 XI 0 0 0 144.1 277.1 59.4 3.3 30.7 469.2 503.2 30.0 1 246.9 1 239.7 2 414.2 4 900.8 777.0 XII 0 0 0 144.6 279.5 62.6 10.2 30.0 461.8 502.0 38.1 1 100.4 1 246.0 2 404.4 4 750.8 780.3 2013 I 0 0.1 0 140.7 295.3 69.0 11.1 31.6 459.4 502.2 43.2 1 115.7 1 229.2 2 397.3 4 742.2 779.2 II 0 0 0 142.8 294.5 66.9 10.8 31.1 453.0 494.9 42.4 1 155.8 1 216.3 2 375.3 4 747.5 794.2 III 0 0 0 144.9 304.4 70.9 10.3 30.4 455.1 495.8 41.6 1 094.5 1 231.4 2 351.1 4 677.1 785.8 IV 0 0 0 124.7 287.5 60.9 11.2 29.7 454.3 495.1 42.8 1 086.7 1 228.2 2 327.3 4 642.3 784.6 V 0 0 0 134.1 293.3 62.6 3.9 29.2 455.8 488.9 35.7 1 182.1 1 234.0 2 262.1 4 678.2 813.1 VI 0 0 0 148.3 303.2 63.6 4.1 28.8 446.4 479.3 35.5 1 111.7 1 276.9 2 134.8 4 523.4 706.2 VII 0 0 0 140.9 298.6 63.4 3.7 28.0 448.5 480.1 35.5 1 090.0 1 332.5 2 098.7 4 521.1 705.1 VIII 0 0 0 142.0 300.6 63.4 3.8 34.5 439.9 478.2 35.7 1 111.6 1 347.6 2 075.4 4 534.6 706.5 IX 0 0 0 134.0 298.2 63.5 4.1 34.1 441.5 479.7 35.6 1 078.9 1 355.0 2 033.6 4 467.5 698.2 X 0 0 0 118.8 284.9 59.8 2.9 35.2 450.9 489.1 36.5 1 080.9 1 345.9 2 008.3 4 435.1 693.5 XI 0 0 0 120.7 287.4 56.7 3.7 38.2 445.7 487.7 37.4 1 074.6 1 403.7 1 991.1 4 469.4 697.8 XII 0 0 0 136.3 302.7 40.1 4.3 43.3 439.5 487.1 37.5 1 093.1 1 404.3 1 975.6 4 472.9 696.8 16.a MATURITY PROFILE OF LOANS TO RESIDENT FINANCIAL INSTITUTIONS, NON-FINANCIAL CORPORATIONS AND HOUSEHOLDS (IN LATS AND FOREIGN CURRENCIES) (at end of period; millions of lats) 2012 2013 X XI XII I II III IV V VI VII VIII IX X XI XII Short-term Amount 1 856.4 1 825.2 1 671.6 1 685.4 1 723.8 1 657.7 1 625.5 1 716.4 1 648.4 1 613.8 1 637.8 1 593.5 1 570.8 1 556.1 1 566.7 %1 17.8 17.6 16.4 16.6 17.0 16.5 16.3 17.2 16.9 16.6 16.8 16.5 16.4 16.3 16.5 Maturity of 1–5 years Amount 1 646.2 1 695.1 1 694.7 1 692.3 1 676.3 1 692.2 1 693.7 1 671.2 1 707.6 1 764.6 1 778.3 1 785.9 1 779.2 1 824.8 1 819.8 %1 15.8 16.4 16.7 16.7 16.6 16.9 17.0 16.8 17.5 18.1 18.3 18.5 18.6 19.1 19.1 Maturity of over 5 years Amount 6 906.2 6 846.8 6 799.1 6 760.3 6 711.8 6 675.6 6 630.4 6 566.4 6 412.9 6 357.0 6 310.5 6 250.9 6 207.2 6 186.3 6 127.9 %1 66.4 66.0 66.9 66.7 66.4 66.6 66.7 66.0 65.6 65.3 64.9 65.0 65.0 64.6 64.4 Total loans 10 408.8 10 367.1 10 165.4 10 138.1 10 111.9 10 025.5 9 949.6 9 953.9 9 768.9 9 735.4 9 726.6 9 630.3 9 557.2 9 567.2 9 514.4 1 As percent of total loans to resident financial institutions, non-financial corporations and households. 15.
  • 62. 61 LOANS TO HOUSEHOLDS (at end of period; millions of lats) Households Consumer credit Lending for house purchase Other lending In lats Up to 1 year 1–5 years Over 5 years Up to 1 year 1–5 years Over 5 years Up to 1 year 1–5 years Over 5 years 2012 X 563.7 189.9 93.7 280.0 3 806.4 176.6 146.5 3 483.3 347.6 69.2 61.6 216.8 4 717.7 499.1 XI 554.8 186.9 92.7 275.3 3 785.0 176.0 165.2 3 443.9 346.1 68.1 62.7 215.4 4 686.0 499.7 XII 546.0 183.6 90.4 272.1 3 748.9 171.1 158.7 3 419.1 338.2 61.7 63.3 213.1 4 633.1 497.5 2013 I 545.6 184.9 90.4 270.4 3 717.5 170.4 151.3 3 395.8 335.2 62.5 62.8 209.9 4 598.4 499.4 II 502.6 181.4 89.7 231.4 3 700.4 170.6 152.0 3 377.8 372.0 62.4 62.6 247.0 4 575.0 500.0 III 500.5 179.6 89.5 231.4 3 680.3 168.2 147.9 3 364.2 367.5 60.3 62.4 244.7 4 548.2 500.2 IV 498.9 179.1 90.5 229.3 3 662.1 163.6 148.6 3 349.9 363.6 60.0 62.0 241.6 4 524.6 501.1 V 391.3 169.6 88.4 133.3 3 743.7 165.8 127.8 3 450.1 358.5 60.8 59.2 238.5 4 493.6 499.2 VI 386.1 164.6 88.2 133.2 3 721.2 162.4 125.8 3 433.0 355.7 57.3 59.1 239.3 4 463.0 497.0 VII 386.1 164.3 88.9 132.9 3 697.6 158.2 124.1 3 415.2 351.8 56.7 58.6 236.6 4 435.5 498.5 VIII 383.3 161.3 89.1 132.9 3 680.4 156.6 120.5 3 403.3 349.4 62.5 52.7 234.2 4 413.1 499.0 IX 384.6 160.6 90.9 133.2 3 657.4 154.2 118.1 3 385.2 342.8 61.7 48.0 233.1 4 384.8 499.9 X 383.7 158.3 90.7 134.6 3 628.1 149.0 116.6 3 362.5 336.4 60.8 48.1 227.4 4 348.2 497.2 XI 377.3 156.5 86.1 134.8 3 609.1 146.1 114.9 3 348.0 336.3 54.5 50.4 231.4 4 322.7 493.2 XII 364.1 146.4 84.9 132.8 3 557.5 136.2 112.0 3 309.4 330.0 50.4 49.6 230.0 4 251.6 477.4 16.b LOANS TO GOVERNMENT AND NON-RESIDENTS (at end of period; millions of lats) General government Non-residents Central government Local government In lats MFIs Non-MFIs In lats General government Other 2012 X 1.1 69.4 70.5 8.6 3 218.5 1 161.4 0 1 161.4 4 379.9 319.7 XI 1.5 69.1 70.6 9.3 3 172.2 1 190.6 0 1 190.6 4 362.8 298.5 XII 2.2 70.8 73.0 10.3 3 370.5 1 174.0 0 1 174.0 4 544.5 316.3 2013 I 3.4 72.3 75.7 11.6 3 510.9 1 143.9 0 1 143.9 4 654.8 275.5 II 3.4 71.7 75.2 11.3 3 127.4 1 182.2 0 1 182.2 4 309.6 270.2 III 3.2 71.4 74.6 10.6 3 302.2 1 228.2 0 1 228.2 4 530.4 296.9 IV 3.2 72.9 76.0 10.8 3 367.5 1 285.0 0 1 285.0 4 652.5 295.6 V 3.4 76.4 79.8 10.6 3 248.5 1 408.7 11.4 1 397.3 4 657.2 320.6 VI 4.0 77.3 81.3 11.0 3 560.6 1 352.9 11.4 1 341.6 4 913.5 372.7 VII 5.0 78.0 83.0 12.1 3 801.1 1 385.8 11.3 1 374.5 5 186.8 381.1 VIII 4.6 79.0 83.6 12.1 3 695.1 1 389.5 11.1 1 378.5 5 084.6 358.1 IX 4.1 79.5 83.6 12.2 3 279.3 1 346.3 11.0 1 335.3 4 625.6 345.6 X 3.6 80.0 83.5 10.2 3 339.3 1 342.3 11.0 1 331.4 4 681.7 330.3 XI 3.6 80.9 84.5 11.2 3 174.9 1 361.9 6.8 1 355.1 4 536.8 326.4 XII 4.9 81.9 86.7 12.9 3 153.0 1 353.4 6.8 1 346.6 4 506.4 362.6 16.c
  • 63. 62 LOANS TO FINANCIAL INSTITUTIONS AND NON-FINANCIAL CORPORATIONS IN THE NATIONAL ECONOMY (at end of Q4 2013, millions of lats; structure, %) With residual maturity of up to 1 year With residual maturity of over 1 and up to 5 years With residual maturity of over 5 years Total loans Amount % Of which in lats % Amount % Of which in lats % Amount % Of which in lats % Amount % Of which in lats % 1 828.8 100.0 399.6 100.0 2 589.3 100.0 264.9 100.0 844.5 100.0 136.8 100.0 5 262.6 100.0 801.3 100.0Total A Agriculture, forestry and fishing 102.9 5.6 29.1 7.3 182.6 7.0 52.8 19.9 60.4 7.2 23.0 16.8 345.9 6.6 104.9 13.1 B Mining and quarrying 4.2 0.2 1.0 0.2 12.0 0.5 0.5 0.2 2.3 0.3 0 0 18.6 0.3 1.5 0.2 C Manufacturing 271.1 14.8 47.8 12.0 360.6 13.9 29.2 11.0 52.5 6.2 1.8 1.3 684.3 13.0 78.8 9.8 D Electricity, gas, steam and air conditioning supply 72.5 4.0 7.5 1.9 221.5 8.6 24.8 9.4 79.6 9.4 2.4 1.8 373.6 7.1 34.7 4.3 E Water supply; sewerage, waste management and remediation activities 15.1 0.8 9.0 2.3 29.8 1.1 6.4 2.4 21.7 2.6 8.4 6.1 66.6 1.3 23.8 3.0 F Construction 66.8 3.6 18.4 4.6 104.2 4.0 8.3 3.1 165.8 19.6 36.7 26.8 336.7 6.4 63.4 7.9 G Wholesale and retail trade; repair of motor vehicles and motorcycles 352.2 19.3 66.1 16.5 183.4 7.1 22.6 8.5 33.4 4.0 5.0 3.7 569.0 10.8 93.7 11.7 H Transportation and storage 62.7 3.4 5.6 1.4 193.2 7.5 16.5 6.2 111.9 13.3 1.3 1.0 367.9 7.0 23.4 2.9 I Accommodation and food service activities 24.7 1.4 4.3 1.1 62.1 2.4 3.2 1.2 24.7 2.9 0.5 0.4 111.5 2.1 8.0 1.0 J Information and communication 9.5 0.5 6.5 1.6 12.2 0.5 0.5 0.2 11.4 1.3 0.1 0.1 33.0 0.6 7.1 0.9 K Financial and insurance activities 188.6 10.3 32.7 8.2 191.5 7.4 13.2 5.0 12.9 1.5 0.6 0.4 392.9 7.5 46.5 5.8 L Real estate activities 535.4 29.3 111.0 27.8 933.8 36.1 65.4 24.7 178.2 21.1 30.9 22.6 1 647.4 31.3 207.3 25.9 M Professional, scientific and technical activities 8.2 0.4 2.5 0.6 9.9 0.4 2.5 1.0 2.8 0.3 0.2 0.2 20.9 0.4 5.2 0.6 N Administrative and support service activities 74.3 4.1 43.6 10.9 10.7 0.4 0.5 0.2 10.8 1.3 0.6 0.4 95.8 1.8 44.7 5.6 O Public administration and defence; compulsory social security 0 0 0 0 1.3 0 0.3 0.1 18.8 2.2 6.3 4.6 20.1 0.4 6.6 0.8 P Education 1.5 0.1 0.4 0.1 3.1 0.1 0.1 0 0.7 0.1 0 0 5.2 0.1 0.5 0.1 Q Human health and social work activities 5.6 0.3 2.1 0.5 10.9 0.4 1.5 0.6 2.3 0.3 1.4 1.0 18.8 0.4 5.0 0.6 R Arts, entertainment and recreation 4.6 0.3 1.2 0.3 5.1 0.2 0.6 0.2 8.0 0.9 1.0 0.7 17.7 0.3 2.8 0.4 S Other service activities 29.0 1.6 10.8 2.7 61.5 2.4 16.0 6.1 46.3 5.5 16.6 12.1 136.8 2.6 43.4 5.4 17. LENDING TO RESIDENT FINANCIAL INSTITUTIONS, NON-FINANCIAL CORPORATIONS AND HOUSEHOLDS (at end of period; millions of lats) 2012 2013 XII III VI IX XII Commercial credit 1 656.3 1 658.0 1 623.1 1 620.0 1 697.4 Industrial credit 1 759.9 1 757.2 1 715.6 1 688.4 1 608.4 Reverse repo 0.5 0.6 0.6 0.6 0.8 Financial leasing 30.9 29.8 27.4 30.5 31.3 Consumer credit 343.7 234.1 231.9 233.4 229.8 Mortgage loans 5 563.8 5 541.4 5 348.0 5 237.1 5 186.2 Factoring 1.8 1.9 2.6 2.2 2.0 Other credit 778.2 748.5 751.5 773.5 743.5 Total loans 10 135.1 9 971.6 9 700.7 9 585.7 9 499.4 1 Data have been revised. 18.
  • 64. 63 HOLDINGS OF SHARES AND OTHER EQUITY (at end of period; millions of lats) Shares and other equity MFIs Other residents Non-residents In lats 2012 X 0.4 327.5 116.7 444.6 223.9 XI 0.4 323.4 119.6 443.4 222.9 XII 0.4 327.4 121.3 449.1 233.1 2013 I 0.4 326.2 125.4 452.0 233.0 II 0.4 331.3 124.9 456.5 237.5 III 0.4 336.1 123.9 460.4 243.8 IV 0.4 339.6 124.6 464.6 249.5 V 0.4 338.9 124.7 464.0 249.7 VI 0.4 359.7 126.6 486.7 248.0 VII 0.4 377.9 124.5 502.8 246.8 VIII 0.4 393.2 129.9 523.5 246.7 IX 0.4 417.3 129.7 547.4 241.2 X 0.4 382.6 131.4 514.4 232.7 XI 0.4 392.9 135.8 529.0 237.1 XII 0.4 407.1 132.8 540.3 207.4 19.b HOLDINGS OF SECURITIES OTHER THAN SHARES (at end of period; millions of lats) Securities other than shares MFIs General government Other residents Non-residents In lats incl. long-term incl. long-term incl. long-term incl. long-term 2012 X 1.0 1.0 471.7 326.7 0.2 0.2 1 459.4 1 384.6 1 932.2 400.2 XI 1.0 1.0 472.2 327.4 0.2 0.2 1 453.1 1 387.9 1 926.5 398.4 XII 0 0 481.0 336.1 4.3 4.3 1 402.8 1 349.9 1 888.0 395.5 2013 I 0 0 473.8 352.7 10.2 10.2 1 386.3 1 332.1 1 870.3 380.8 II 0 0 401.5 301.2 9.6 9.6 1 472.4 1 415.8 1 883.5 296.6 III 0 0 410.0 305.1 12.1 12.1 1 476.8 1 416.8 1 898.9 303.0 IV 0 0 386.4 280.7 10.6 10.6 1 477.0 1 414.0 1 874.0 284.0 V 0 0 411.9 295.5 14.3 14.3 1 463.1 1 396.0 1 889.2 303.7 VI 0 0 426.2 310.9 14.3 14.3 1 398.0 1 338.0 1 838.4 310.5 VII 0 0 432.3 313.3 13.8 13.8 1 334.9 1 288.3 1 781.0 313.5 VIII 0 0 442.1 312.1 13.6 13.6 1 415.9 1 291.7 1 871.6 326.3 IX 0 0 446.3 310.9 13.9 13.9 1 494.3 1 296.2 1 954.5 329.8 X 0 0 443.5 311.4 13.6 13.6 1 384.7 1 286.4 1 841.8 330.5 XI 0 0 451.0 316.6 19.9 19.9 1 419.8 1 319.5 1 890.7 336.6 XII 0 0 460.3 315.2 20.1 20.1 1 498.0 1 442.7 1 978.4 345.1 19.a
  • 65. 64 CURRENCY BREAKDOWN OF RESIDENT DEPOSITS (at end of period) MFIs Non-MFIs Outstanding amount (all currencies; millions of lats) Structure (%) Outstanding amount (all currencies; millions of lats) Structure (%) In lats In foreign currencies In lats In foreign currencies incl. EUR incl. USD incl. EUR incl. USD 2012 X 224.0 31.8 68.2 43.4 22.6 6 202.6 45.1 54.9 45.6 7.3 XI 231.6 31.1 68.9 36.3 30.8 6 281.7 45.3 54.7 45.1 7.3 XII 246.2 23.8 76.2 38.6 35.4 6 389.7 45.4 54.6 45.6 6.9 2013 I 255.1 18.6 81.4 39.9 39.6 6 558.5 43.4 56.6 47.6 6.9 II 195.0 21.1 78.9 49.6 26.2 6 553.6 43.5 56.5 47.7 6.8 III 197.7 24.0 76.0 46.2 27.0 6 412.1 43.9 56.1 47.5 6.6 IV 249.4 20.1 79.9 40.5 38.1 6 516.7 44.2 55.8 47.7 6.1 V 262.2 24.0 76.0 38.3 35.9 6 517.2 43.7 56.3 48.2 6.1 VI 240.0 26.7 73.3 40.6 31.0 6 506.5 43.7 56.3 48.0 6.2 VII 258.0 25.1 74.9 42.9 30.3 6 478.5 43.4 56.6 47.9 6.5 VIII 220.8 24.3 75.7 40.4 33.6 6 591.0 43.1 56.9 48.6 6.2 IX 243.9 25.0 75.0 38.1 34.9 6 562.4 43.6 56.4 48.3 6.1 X 264.0 23.5 76.5 34.9 40.0 6 653.1 43.6 56.4 48.3 6.0 XI 254.4 17.8 82.2 46.7 33.9 6 759.7 44.2 55.8 47.8 6.0 XII 226.2 16.4 83.6 47.5 35.3 7 237.9 44.9 55.1 47.2 5.9 20.a CURRENCY BREAKDOWN OF NON-RESIDENT DEPOSITS (at end of period) MFIs Non-MFIs Outstanding amount (all currencies; millions of lats) Structure (%) Outstanding amount (all currencies; millions of lats) Structure (%) In lats In foreign currencies In lats In foreign currencies incl. EUR incl. USD incl. EUR incl. USD 2012 X 3 902.0 1.7 98.3 87.1 4.1 5 718.6 1.3 98.7 27.0 67.0 XI 3 859.6 1.7 98.3 87.1 3.9 5 668.6 1.3 98.7 28.0 66.1 XII 3 828.2 2.3 97.7 87.4 3.4 5 751.7 1.3 98.7 26.7 66.8 2013 I 3 636.5 3.3 96.7 85.6 3.7 5 886.2 1.2 98.8 26.5 67.4 II 3 452.3 3.2 96.8 84.7 4.5 5 935.0 1.1 98.9 27.0 67.1 III 3 578.0 2.9 97.1 85.0 4.7 6 108.2 1.1 98.9 26.6 66.9 IV 3 541.8 2.2 97.8 86.0 4.0 6 074.5 1.0 99.0 27.4 66.6 V 3 455.8 2.0 98.0 86.7 3.8 6 171.9 1.1 98.9 28.2 65.6 VI 3 562.2 1.5 98.5 88.0 3.5 6 188.1 1.0 99.0 27.3 65.9 VII 3 578.5 2.0 98.0 88.2 3.0 6 360.7 1.0 99.0 26.9 65.2 VIII 3 458.4 2.0 98.0 88.1 2.7 6 413.3 1.0 99.0 26.9 66.6 IX 3 208.1 3.7 96.3 86.0 2.5 6 266.4 1.0 99.0 27.2 66.8 X 3 012.8 3.4 96.6 86.1 2.4 6 399.4 1.0 99.0 27.5 66.6 XI 2 953.0 3.5 96.5 85.6 2.5 6 212.6 1.0 99.0 27.9 65.7 XII 3 011.9 1.4 98.6 88.2 2.6 6 349.3 0.8 99.2 27.5 66.5 20.b
  • 66. 65 CURRENCY BREAKDOWN OF LOANS TO NON-RESIDENTS (at end of period) MFIs Non-MFIs Outstanding amount (all currencies; millions of lats) Structure (%) Outstanding amount (all currencies; millions of lats) Structure (%) In lats In foreign currencies In lats In foreign currencies incl. EUR incl. USD incl. EUR incl. USD 2012 X 3 218.5 9.3 90.7 33.5 49.5 1 161.4 1.8 98.2 31.9 63.6 XI 3 172.2 8.8 91.2 33.1 50.9 1 190.6 1.7 98.3 31.2 64.2 XII 3 370.5 8.8 91.2 34.1 49.6 1 174.0 1.7 98.3 30.7 64.8 2013 I 3 510.9 7.3 92.7 36.2 50.0 1 143.9 1.8 98.2 32.1 62.8 II 3 127.4 8.1 91.9 35.4 48.4 1 182.2 1.3 98.7 31.2 64.2 III 3 302.2 8.5 91.5 30.2 53.6 1 228.2 1.3 98.7 30.8 64.6 IV 3 367.5 8.3 91.7 33.2 50.9 1 285.0 1.3 98.7 35.9 60.1 V 3 248.5 9.4 90.6 29.8 52.7 1 408.7 1.1 98.9 39.6 56.4 VI 3 560.6 10.0 90.0 29.6 53.0 1 352.9 1.2 98.8 39.6 57.4 VII 3 801.1 10.0 90.0 26.5 55.9 1 385.8 0.2 99.8 39.3 58.4 VIII 3 695.1 9.6 90.4 26.5 56.8 1 389.5 0.1 99.9 38.7 59.3 IX 3 279.3 10.4 89.6 21.6 59.1 1 346.3 0.3 99.7 37.5 60.1 X 3 339.3 9.8 90.2 19.7 62.4 1 342.3 0.1 99.9 37.8 59.8 XI 3 174.9 10.2 89.8 20.0 61.3 1 361.9 0.1 99.9 35.4 62.0 XII 3 153.0 11.3 88.7 16.4 64.1 1 353.4 0.4 99.6 35.1 62.3 20.d CURRENCY BREAKDOWN OF LOANS TO RESIDENTS (at end of period) Non-MFIs Outstanding amount (all currencies; millions of lats) Structure (%) In lats In foreign currencies incl. EUR incl. USD 2012 X 10 479.3 12.9 87.1 82.3 2.0 XI 10 437.6 13.2 86.8 82.0 2.1 XII 10 238.5 13.6 86.4 81.5 2.2 2013 I 10 213.8 13.7 86.3 81.4 2.2 II 10 187.0 13.9 86.1 81.1 2.3 III 10 100.1 13.9 86.1 80.9 2.4 IV 10 025.6 14.0 86.0 81.0 2.3 V 10 033.7 14.2 85.8 80.9 2.2 VI 9 850.3 13.3 86.7 81.8 2.3 VII 9 818.4 13.4 86.6 81.7 2.3 VIII 9 810.2 13.4 86.6 81.7 2.3 IX 9 713.9 13.5 86.5 81.7 2.2 X 9 640.8 13.5 86.5 81.6 2.3 XI 9 651.7 13.4 86.6 81.6 2.3 XII 9 601.1 13.2 86.8 82.0 2.3 20.c
  • 67. 66 CURRENCY BREAKDOWN OF HOLDINGS OF RESIDENT SECURITIES OTHER THAN SHARES (at end of period) MFIs Non-MFIs Outstanding amount (all currencies; millions of lats) Structure (%) Outstanding amount (all currencies; millions of lats) Structure (%) In lats In foreign currencies In lats In foreign currencies incl. EUR incl. USD incl. EUR incl. USD 2012 X 1.0 0 100.0 100.0 0 471.8 84.8 15.2 8.0 7.2 XI 1.0 0 100.0 100.0 0 472.4 84.3 15.7 8.4 7.3 XII 0 0 0 0 0 485.3 81.5 18.5 9.6 8.9 2013 I 0 0 0 0 0 484.0 78.7 21.3 12.6 8.7 II 0 0 0 0 0 411.1 72.2 27.8 16.8 11.0 III 0 0 0 0 0 422.1 71.8 28.2 16.9 11.3 IV 0 0 0 0 0 397.0 71.5 28.5 16.9 11.6 V 0 0 0 0 0 426.2 71.3 28.7 17.9 10.8 VI 0 0 0 0 0 440.5 70.5 29.5 18.6 10.9 VII 0 0 0 0 0 446.1 70.3 29.7 18.8 10.9 VIII 0 0 0 0 0 455.7 71.6 28.4 17.5 10.9 IX 0 0 0 0 0 460.2 71.7 28.3 17.5 10.8 X 0 0 0 0 0 457.1 72.3 27.7 17.0 10.7 XI 0 0 0 0 0 470.9 71.5 28.5 16.7 10.6 XII 0 0 0 0 0 480.4 71.8 28.2 16.4 10.5 20.e CURRENCY BREAKDOWN OF HOLDINGS OF NON-RESIDENT SECURITIES OTHER THAN SHARES (at end of period) MFIs Non-MFIs Outstanding amount (all currencies; millions of lats) Structure (%) Outstanding amount (all currencies; millions of lats) Structure (%) In lats In foreign currencies In lats In foreign currencies incl. EUR incl. USD incl. EUR incl. USD 2012 X 518.7 0 100.0 26.7 72.1 940.6 0 100.0 18.5 79.2 XI 532.9 0 100.0 26.8 71.5 920.2 0 100.0 19.6 78.0 XII 527.4 0 100.0 25.7 72.7 875.3 0 100.0 18.6 78.9 2013 I 522.1 0 100.0 25.7 72.7 864.2 0 100.0 18.8 78.6 II 551.0 0 100.0 23.9 74.7 921.4 0 100.0 17.7 79.8 III 533.4 0 100.0 22.1 76.9 943.4 0 100.0 16.3 81.4 IV 533.3 0 100.0 23.0 75.8 943.7 0 100.0 14.7 82.2 V 526.5 0 100.0 23.7 74.7 936.5 0 100.0 14.1 82.6 VI 520.2 0 100.0 24.6 73.6 877.7 0 100.0 14.9 81.8 VII 482.4 0 100.0 23.2 74.8 852.5 0 100.0 16.3 80.0 VIII 477.5 0 100.0 23.0 75.0 938.4 0 100.0 15.6 80.8 IX 511.2 0 100.0 25.5 72.7 983.1 0 100.0 13.7 82.9 X 529.6 0 100.0 27.1 70.6 855.1 0 100.0 15.6 80.0 XI 541.1 0 100.0 26.6 70.4 878.7 0 100.0 16.7 79.9 XII 553.4 0 100.0 27.6 69.6 944.5 0 100.0 16.5 80.6 20.f
  • 68. 67 CURRENCY BREAKDOWN OF DEBT SECURITIES ISSUED BY MFIs (at end of period) Outstanding amount (all currencies; millions of lats) Structure (%) In lats In foreign currencies 2012 X 113.5 0 100.0 XI 138.7 0 100.0 XII 139.6 0 100.0 2013 I 139.0 0 100.0 II 159.4 0 100.0 III 187.8 0 100.0 IV 196.1 0 100.0 V 195.5 0 100.0 VI 232.2 0 100.0 VII 229.7 0 100.0 VIII 233.4 0 100.0 IX 230.1 0 100.0 X 251.9 0 100.0 XI 278.1 0 100.0 XII 234.6 0 100.0 20.g 1 End-of-period. 2 For this instrument category, households and non-financial corporations are merged and allocated to the household sector. WEIGHTED AVERAGE INTEREST RATES CHARGED BY MFIs IN TRANSACTIONS WITH RESIDENT NON-FINANCIAL CORPORATIONS AND HOUSEHOLDS IN LATS (%) 21.a 1. Interest rates on deposits (new business) 2012 2013 X XI XII I II III IV V VI VII VIII IX X XI XII Deposits from households Overnight1 0.14 0.13 0.12 0.12 0.12 0.09 0.09 0.09 0.08 0.08 0.08 0.08 0.08 0.08 0.09 With agreed maturity Up to 1 year 0.88 0.62 1.10 1.09 0.65 0.62 0.66 0.69 0.62 0.69 0.49 0.40 0.41 0.47 0.67 Over 1 and up to 2 years 1.81 1.64 1.25 1.60 1.15 0.94 1.17 0.96 0.80 0.91 0.79 0.83 0.89 0.98 1.23 Over 2 years 3.67 3.70 3.80 3.92 1.99 1.69 2.09 2.11 1.50 1.56 0.95 1.02 1.45 0.70 0.83 Redeemable at notice2 Up to 3 months 0.13 0.13 0.13 0.13 0.13 0.14 0.13 0.13 0.13 0.13 0.13 0.13 0.13 0.13 0.13 Over 3 months – – – – x – – – – – – – – – – Deposits from non-financial corporations Overnight1 0.05 0.05 0.04 0.05 0.04 0.04 0.04 0.04 0.04 0.04 0.03 0.03 0.03 0.04 0.03 With agreed maturity Up to 1 year 0.10 0.08 0.12 0.12 0.06 0.09 0.06 0.06 0.05 0.04 0.04 0.06 0.05 0.03 0.04 Over 1 and up to 2 years 1.36 0.92 1.05 0.97 0.90 0.90 1.64 0.76 x 1.12 0.35 0.53 x 1.01 0.65 Over 2 years 1.26 1.61 1.06 1.45 x 0.80 0.80 0.52 1.26 0.61 0.63 x 0.44 0.74 0.55 Repos – – – – – – – – – – – – – – –
  • 69. 68 WEIGHTED AVERAGE INTEREST RATES CHARGED BY MFIs IN TRANSACTIONS WITH RESIDENT NON-FINANCIAL CORPORATIONS AND HOUSEHOLDS IN LATS (CONT.) (%) 21.a 2. Interest rates on deposits (outstanding amounts) 2012 2013 X XI XII I II III IV V VI VII VIII IX X XI XII Households Overnight1 0.14 0.13 0.12 0.12 0.12 0.09 0.09 0.09 0.08 0.08 0.08 0.08 0.08 0.08 0.09 With agreed maturity Up to 2 years 1.86 1.79 1.49 1.35 1.32 1.29 1.24 1.21 1.17 1.11 1.07 1.04 1.01 0.98 0.89 Over 2 years 4.57 4.50 4.36 4.27 4.26 4.13 4.08 3.99 3.95 3.89 3.77 3.81 3.75 3.63 3.51 Redeemable at notice2 Up to 3 months 0.13 0.13 0.13 0.13 0.13 0.14 0.13 0.13 0.13 0.13 0.13 0.13 0.13 0.13 0.13 Over 3 months – – – – x – – – – – – – – – – Non-financial corporations Overnight1 0.05 0.05 0.04 0.05 0.04 0.04 0.04 0.04 0.04 0.04 0.03 0.03 0.03 0.04 0.03 With agreed maturity Up to 2 years 0.97 0.91 0.83 0.78 0.72 0.69 0.66 0.63 0.63 0.77 0.60 0.55 0.47 0.46 0.54 Over 2 years 2.26 2.24 2.17 2.13 2.16 2.31 2.29 2.27 2.26 2.25 2.08 2.06 2.00 2.02 1.65 Repos – – – – – – – – – – – – – – – 1 End-of-period. 2 For this instrument category, households and non-financial corporations are merged and allocated to the household sector.
  • 70. 69 WEIGHTED AVERAGE INTEREST RATES CHARGED BY MFIs IN TRANSACTIONS WITH RESIDENT NON-FINANCIAL CORPORATIONS AND HOUSEHOLDS IN LATS (CONT.) (%) 21.a 1 End-of-period. 2 The annual percentage rate of charge covers the total cost of a loan. The total cost comprises an interest rate component and a component of other (related) charges, such as the cost of inquiries, administration, preparation of documents, guarantees, etc. 3. Interest rates on loans to households (new business) 2012 2013 X XI XII I II III IV V VI VII VIII IX X XI XII Bank overdraft1 – – – – – – – – – – – – – – – Revolving loans and overdraft1 22.61 22.56 22.55 22.65 22.67 22.91 22.90 22.62 22.72 22.82 22.90 23.02 22.84 22.89 22.73 Extended credit card credit1 23.09 23.08 23.07 23.00 22.99 22.99 22.95 22.94 22.94 22.93 22.99 22.97 23.09 23.09 23.07 Lending for house purchase By initial rate fixation Floating rate and up to 1 year 2.88 2.84 2.94 3.06 2.83 3.26 3.55 3.10 3.24 3.19 3.16 3.30 3.39 3.71 3.29 of wich with collateral or guarantees 2.88 2.81 2.99 3.02 2.82 3.15 3.51 3.04 3.22 3.18 3.12 3.25 3.36 3.53 3.20 Over 1 and up to 5 years 6.95 9.66 13.15 14.22 6.61 16.90 11.37 12.26 15.16 15.46 15.08 17.51 14.91 19.48 21.40 of wich with collateral or guarantees 5.55 7.27 x 9.14 8.46 12.66 8.55 10.06 12.44 10.31 10.16 11.18 8.28 x x Over 5 and up to 10 years 7.28 x x 6.52 x 4.75 4.53 x 6.98 x 7.25 x x x x of wich with collateral or guarantees 7.28 x x 6.92 x 4.54 4.33 x x x x x x x x Over 10 years x 4.57 4.95 x x x x x x x 5.48 x x 6.28 x of wich with collateral or guarantees x 4.02 4.52 x x x x x x x 5.48 x x 6.28 x Annual percentage rate of charge2 3.20 3.23 3.25 3.90 3.26 4.17 4.04 3.68 3.86 3.68 3.99 4.26 4.42 5.14 4.08 Consumer credit By initial rate fixation Floating rate and up to 1 year 19.59 20.40 20.21 16.71 21.69 22.23 21.45 23.06 22.71 22.60 21.72 20.17 21.82 23.04 23.21 of wich with collateral or guarantees 4.76 4.54 3.52 4.92 4.81 4.94 4.08 5.20 5.68 5.05 5.66 5.03 5.25 5.43 8.83 Over 1 year 14.31 16.12 13.84 6.19 18.34 19.28 18.55 18.87 18.47 7.48 18.47 17.08 16.89 16.38 18.16 of wich with collateral or guarantees 5.02 7.28 5.28 1.25 8.57 12.01 11.74 13.78 10.72 1.33 9.91 6.73 7.73 9.98 8.71 Annual percentage rate of charge2 21.84 21.31 22.05 19.30 22.41 23.12 22.80 22.87 22.84 20.77 22.55 22.47 22.28 22.77 23.04 Other lending by initial rate fixation Floating rate and up to 1 year 6.15 7.26 6.87 5.28 5.48 5.69 6.10 6.12 4.97 7.01 5.44 5.14 6.17 5.35 5.84 Over 1 year x 14.50 11.91 14.50 x x x x x x x x x x x
  • 71. 70 WEIGHTED AVERAGE INTEREST RATES CHARGED BY MFIs IN TRANSACTIONS WITH RESIDENT NON-FINANCIAL CORPORATIONS AND HOUSEHOLDS IN LATS (CONT.) (%) 21.a 4. Interest rates on loans to non-financial corporations (new business) 2012 2013 X XI XII I II III IV V VI VII VIII IX X XI XII Bank overdraft1 – – – – – – – – – – – – – – – Revolving loans and overdraft1 2.67 2.60 2.43 2.43 2.43 2.50 2.49 2.35 2.38 2.33 2.29 2.25 2.24 2.26 2.13 Extended credit card credit1 24.36 24.29 24.55 24.97 25.25 25.97 25.34 24.38 24.43 24.47 25.11 24.41 24.34 25.28 23.63 Other loans up to 0.25 million euro by initial rate fixation Floating rate and up to 1 year 4.34 4.58 4.81 4.57 4.70 4.89 4.18 4.68 4.67 4.23 4.34 4.40 4.67 4.76 4.23 of wich with collateral or guarantees 4.14 4.38 4.66 4.50 4.52 4.79 4.10 4.70 4.63 4.38 4.29 4.36 4.69 4.63 4.09 Over 1 year x x 5.35 5.21 5.07 x 5.04 4.39 3.03 4.50 4.95 x 5.39 5.34 5.48 of wich with collateral or guarantees x x 5.59 4.82 5.88 x 5.06 4.39 3.03 5.15 4.95 x x x x Other loans over 0.25 million euro and up to 1 million euro by initial rate fixation Floating rate and up to 1 year 4.86 3.41 3.46 4.91 4.74 4.43 4.43 3.86 3.99 3.34 7.15 4.18 4.21 4.09 5.46 of wich with collateral or guarantees 4.69 3.41 3.39 4.98 4.96 4.50 4.41 3.87 3.78 x 4.57 4.28 3.95 x 5.79 Over 1 year x x x x x – – x – 3.51 x x x x x of wich with collateral or guarantees x x x x x – – x – x x x x x x Other loans over 1 million euro by initial rate fixation Floating rate and up to 1 year x x 6.08 – 4.09 4.62 4.57 4.76 x x 5.25 x 2.35 x x of wich with collateral or guarantees x x x – x 4.62 x 4.76 x x 5.25 x x x x Over 1 year – x x x – x – – x – x x x – x of wich with collateral or guarantees – – – x – x – – x – x x – – x 1 End-of-period.
  • 72. 71 WEIGHTED AVERAGE INTEREST RATES CHARGED BY MFIs IN TRANSACTIONS WITH RESIDENT NON-FINANCIAL CORPORATIONS AND HOUSEHOLDS IN LATS (CONT.) (%) 21.a 1 Including revolving loans, overdrafts, and extended and convenience credit card credit. 2 Including bank overdraft. 1 End-of-period. 2 For this instrument category, households and non-financial corporations are merged and allocated to the household sector. WEIGHTED AVERAGE INTEREST RATES CHARGED BY MFIs IN TRANSACTIONS WITH RESIDENT NON-FINANCIAL CORPORATIONS AND HOUSEHOLDS IN EURO (%) 21.b 5. Interest rates on loans (outstanding amounts) 2012 2013 X XI XII I II III IV V VI VII VIII IX X XI XII Loans to households Lending for house purchase, with maturity Up to 1 year 5.76 5.94 6.20 6.28 5.86 5.49 6.02 7.72 7.42 7.81 7.56 6.87 8.01 8.14 8.67 Over 1 and up to 5 years 4.72 4.94 4.96 4.98 4.96 4.92 4.88 4.80 4.78 4.77 4.86 4.93 5.02 5.14 5.15 Over 5 years 3.68 3.52 3.46 3.42 3.38 3.32 3.29 3.26 3.23 3.17 3.12 3.07 3.06 3.03 3.03 Consumer credit and other loans, with maturity1 Up to 1 year2 23.15 23.11 23.20 23.18 23.13 23.04 23.21 23.28 23.05 23.15 23.20 23.21 23.24 23.33 23.32 Over 1 and up to 5 years 17.31 17.26 17.29 17.26 17.22 17.40 17.34 17.57 17.52 17.54 17.60 17.69 17.77 17.80 17.82 Over 5 years 8.12 8.01 7.80 8.34 8.22 8.12 8.04 8.13 7.88 7.98 7.94 7.81 7.76 7.69 7.62 Loans to non-financial corporations With maturity1 Up to 1 year2 3.12 2.99 2.85 2.81 2.80 2.85 2.78 2.73 2.74 2.71 2.73 2.70 2.68 2.62 2.46 Over 1 and up to 5 years 4.12 4.06 4.11 4.05 4.05 4.02 3.96 3.98 3.96 3.87 3.74 3.65 3.62 3.58 3.54 Over 5 years 3.79 3.75 3.84 3.78 3.74 3.74 3.76 3.76 3.00 3.05 3.02 3.01 3.02 3.04 3.04 1. Interest rates on deposits (new business) 2012 2013 X XI XII I II III IV V VI VII VIII IX X XI XII Deposits from households Overnight1 0.14 0.13 0.12 0.12 0.12 0.12 0.12 0.12 0.11 0.11 0.11 0.11 0.12 0.11 0.12 With agreed maturity Up to 1 year 0.43 0.34 0.68 0.72 0.31 0.41 0.45 0.35 0.36 0.41 0.26 0.31 0.40 0.36 0.54 Over 1 and up to 2 years 2.09 1.63 1.95 2.33 1.54 1.19 1.20 1.28 0.85 0.93 0.96 0.89 1.36 1.73 1.32 Over 2 years 3.85 3.92 3.48 3.55 1.29 2.23 2.56 2.33 2.44 2.28 5.52 1.41 1.21 1.59 1.62 Redeemable at notice2 Up to 3 months 0.21 0.20 0.20 0.20 0.20 0.16 0.15 0.15 0.15 0.15 0.15 0.15 0.16 0.16 0.16 Over 3 months – – – – x – x x x x x x x x x Deposits from non-financial corporations Overnight1 0.08 0.07 0.08 0.06 0.05 0.05 0.05 0.06 0.06 0.05 0.05 0.07 0.08 0.07 0.08 With agreed maturity Up to 1 year 0.24 0.14 0.14 0.17 0.16 0.16 0.17 0.14 0.14 0.12 0.08 0.14 0.16 0.19 0.26 Over 1 and up to 2 years 1.19 0.62 0.89 x 0.99 1.09 0.98 0.72 x 0.77 0.83 0.62 1.31 0.66 1.36 Over 2 years x – x 4.70 2.17 x 0.72 x x 0.35 2.69 0.06 x 1.09 0.98 Repos – – – – – – – – – – – – – – –
  • 73. 72 WEIGHTED AVERAGE INTEREST RATES CHARGED BY MFIs IN TRANSACTIONS WITH RESIDENT NON-FINANCIAL CORPORATIONS AND HOUSEHOLDS IN EURO (CONT.) (%) 21.b 1 End-of-period. 2 For this instrument category, households and non-financial corporations are merged and allocated to the household sector. 2. Interest rates on deposits (outstanding amounts) 2012 2013 X XI XII I II III IV V VI VII VIII IX X XI XII Deposits from households Overnight1 0.14 0.13 0.12 0.12 0.12 0.12 0.12 0.12 0.11 0.11 0.11 0.11 0.12 0.11 0.12 With agreed maturity Up to 2 years 2.01 1.91 1.61 1.39 1.32 1.27 1.20 1.16 1.10 1.02 0.99 0.97 0.96 0.94 0.91 Over 2 years 4.62 4.56 4.36 4.15 4.14 4.12 4.05 4.01 4.00 3.94 3.90 3.90 3.88 3.84 3.81 Redeemable at notice2 Up to 3 months 0.21 0.20 0.20 0.20 0.20 0.16 0.15 0.15 0.15 0.15 0.15 0.15 0.16 0.16 0.16 Over 3 months – – – – x – x x x x x x x x x Deposits from non-financial corporations Overnight1 0.08 0.07 0.08 0.06 0.05 0.05 0.05 0.06 0.06 0.05 0.05 0.07 0.08 0.07 0.08 With agreed maturity Up to 2 years 1.04 0.85 0.75 0.64 0.59 0.56 0.51 0.50 0.52 0.49 0.48 0.54 0.53 0.51 0.46 Over 2 years 2.73 2.69 2.67 2.47 2.43 2.41 2.41 2.64 2.62 2.54 2.55 2.54 2.36 2.39 2.14 Repos – – – – – – – – – – – – – – –
  • 74. 73 1 End-of-period. 2 The annual percentage rate of charge covers the total cost of a loan. The total cost comprises an interest rate component and a component of other (related) charges, such as the cost of inquiries, administration, preparation of documents, guarantees, etc. WEIGHTED AVERAGE INTEREST RATES CHARGED BY MFIs IN TRANSACTIONS WITH RESIDENT NON-FINANCIAL CORPORATIONS AND HOUSEHOLDS IN EURO (CONT.) (%) 21.b 3. Interest rates on loans to households (new business) 2012 2013 X XI XII I II III IV V VI VII VIII IX X XI XII Bank overdraft1 – – – – – – – – – – – – – – – Revolving loans and overdraft1 4.47 4.48 4.61 4.79 4.91 4.97 5.00 5.00 4.98 4.99 4.97 5.88 4.72 4.75 4.89 Extended credit card credit1 23.81 23.93 23.84 23.56 23.96 23.65 24.33 23.56 23.67 23.37 23.15 23.14 23.55 22.89 22.83 Lending for house purchase By initial rate fixation Floating rate and up to 1 year 3.09 2.94 3.26 3.39 3.24 3.49 3.25 3.27 3.21 3.31 3.19 3.05 2.97 3.34 3.08 of wich with collateral or guarantees 3.06 2.91 3.22 3.36 3.25 3.25 3.19 3.16 3.14 3.35 3.05 2.99 2.90 3.33 3.07 Over 1 and up to 5 years 5.11 5.15 4.77 3.64 4.30 4.63 4.28 5.09 4.12 4.94 5.71 5.54 6.76 5.83 4.77 of wich with collateral or guarantees 5.06 5.13 4.76 3.62 4.16 4.59 4.23 4.98 3.93 4.76 5.50 5.40 6.74 5.76 4.77 Over 5 and up to 10 years 7.03 6.49 x x x 7.38 6.03 6.55 7.32 x 6.48 x x x x of wich with collateral or guarantees 7.06 x x x x 7.58 5.80 6.55 7.32 x x x x x x Over 10 years x x 5.93 x x x x 6.00 5.37 x x 5.86 5.96 5.36 5.91 of wich with collateral or guarantees x x 5.90 x x x x 5.94 x x x 6.10 6.27 5.20 5.97 Annual percentage rate of charge2 3.41 3.20 3.48 3.63 3.96 3.92 3.43 3.51 3.39 3.48 3.40 3.38 3.34 3.54 3.35 Consumer credit By initial rate fixation Floating rate and up to 1 year 6.82 7.57 6.51 7.73 7.09 7.55 7.22 12.60 15.26 15.14 18.32 12.27 12.74 14.05 14.71 of wich with collateral or guarantees x x 4.22 x x x x 5.05 x x x 3.67 4.24 5.45 4.30 Over 1 year 18.29 17.55 18.35 23.55 22.80 22.81 23.20 23.90 24.76 26.27 24.52 24.27 21.61 23.18 25.36 of wich with collateral or guarantees 8.19 7.78 8.67 11.79 9.95 9.81 13.56 11.50 12.57 16.19 10.53 13.71 12.77 11.50 13.74 Annual percentage rate of charge2 17.78 18.65 18.30 21.82 19.34 20.74 21.49 29.02 28.05 30.14 31.29 26.16 25.45 27.13 31.11 Other lending by initial rate fixation Floating rate and up to 1 year 4.53 4.16 4.89 3.74 5.07 5.04 5.73 4.73 5.16 4.55 4.78 3.52 4.03 4.95 5.99 Over 1 year 6.67 x 4.16 x x x x x x x x x x x x
  • 75. 74 WEIGHTED AVERAGE INTEREST RATES CHARGED BY MFIs IN TRANSACTIONS WITH RESIDENT NON-FINANCIAL CORPORATIONS AND HOUSEHOLDS IN EURO (CONT.) (%) 21.b 1 End-of-period. 4. Interest rates on loans to non-financial corporations (new business) 2012 2013 X XI XII I II III IV V VI VII VIII IX X XI XII Bank overdraft1 – – – – – – – – – – – – – – – Revolving loans and overdraft¹ 3.71 4.28 3.42 3.37 3.52 3.52 3.51 3.48 3.43 3.27 3.24 3.72 3.25 3.33 3.24 Extended credit card credit¹ 24.62 23.42 23.74 23.47 23.77 23.66 24.14 23.43 17.15 23.14 24.47 24.08 24.28 24.41 24.01 Other loans up to 0.25 million euro by initial rate fixation Floating rate and up to 1 year 3.97 3.93 3.96 3.83 4.32 4.27 3.75 3.85 4.31 5.45 4.17 4.39 5.34 4.07 4.23 of wich with collateral or guarantees 3.83 3.90 3.98 3.81 4.22 4.23 3.71 3.81 4.30 5.44 4.31 4.25 3.86 4.02 4.23 Over 1 year 4.39 x 3.88 3.61 4.18 7.91 4.66 4.82 x 3.72 4.15 3.83 5.21 5.39 4.32 of wich with collateral or guarantees 4.39 x 7.63 3.61 x x 4.55 4.82 x 4.98 3.68 4.97 5.04 6.17 5.30 Other loans over 0.25 million euro and up to 1 million euro by initial rate fixation Floating rate and up to 1 year 3.57 3.77 3.99 4.28 4.27 4.17 4.43 3.66 4.00 4.76 4.04 4.29 4.06 3.98 4.60 of wich with collateral or guarantees 3.49 3.84 3.97 4.25 3.94 4.14 4.45 3.66 3.98 4.16 4.14 4.27 4.09 3.96 4.61 Over 1 year x x 5.24 x x x x x x 3.87 4.23 6.79 x 2.94 5.70 of wich with collateral or guarantees x x x x x x x x x x x 7.49 x 4.15 6.08 Other loans over 1 million euro by initial rate fixation Floating rate and up to 1 year 2.73 3.94 2.82 4.14 3.41 2.92 3.57 3.87 3.31 3.53 3.47 3.26 2.57 3.57 4.29 of wich with collateral or guarantees 3.35 3.95 2.42 4.31 3.59 2.90 3.78 3.88 3.30 3.83 3.48 3.13 2.40 3.57 3.19 Over 1 year 4.92 x 3.71 x x x x x x 4.90 x x x x 4.32 of wich with collateral or guarantees 3.53 x 4.26 x x x x x x 4.90 x x x x 4.32
  • 76. 75 WEIGHTED AVERAGE INTEREST RATES CHARGED BY MFIs IN TRANSACTIONS WITH RESIDENT NON-FINANCIAL CORPORATIONS AND HOUSEHOLDS IN EURO (CONT.) (%) 21.b 1 Including revolving loans, overdrafts, and extended and convenience credit card credit. 2 Including bank overdraft. WEIGHTED AVERAGE INTEREST RATES CHARGED BY MFIs IN TRANSACTIONS WITH RESIDENT NON-FINANCIAL CORPORATIONS AND HOUSEHOLDS IN US DOLLARS (%) 21.c 1 End-of-period. 2 For this instrument category, households and non-financial corporations are merged and allocated to the household sector. 5. Interest rates on loans (outstanding amounts) 2012 2013 X XI XII I II III IV V VI VII VIII IX X XI XII Loans to households Lending for house purchase, with maturity Up to 1 year 2.85 20.81 5.02 3.79 3.05 19.81 13.10 2.75 2.72 2.80 2.79 3.00 2.50 2.33 2.43 Over 1 and up to 5 years 4.17 4.07 4.15 4.07 4.08 4.05 4.07 3.99 3.95 3.98 3.97 3.95 3.97 3.97 3.97 Over 5 years 2.80 2.72 2.67 2.61 2.59 2.57 2.55 2.59 2.57 2.56 2.55 2.54 2.54 2.54 2.54 Consumer credit and other loans, with maturity1 Up to 1 year2 9.33 9.45 9.75 9.81 10.09 10.25 10.47 11.11 10.98 11.19 10.73 11.48 11.01 11.39 12.71 Over 1 and up to 5 years 9.94 9.92 10.01 10.10 10.23 10.24 10.64 10.74 10.83 10.93 11.70 11.83 11.87 11.95 12.18 Over 5 years 4.39 4.32 4.28 4.23 4.22 4.21 4.22 4.19 4.18 4.20 4.22 4.22 4.25 4.23 4.40 Loans to non-financial corporations With maturity1 Up to 1 year2 3.84 4.43 3.58 3.51 3.87 3.69 3.76 3.59 3.73 3.40 3.39 3.41 3.78 3.33 3.19 Over 1 and up to 5 years 3.51 3.43 3.43 3.47 3.50 3.37 3.39 3.35 3.32 3.38 3.32 3.36 3.36 3.33 3.34 Over 5 years 3.00 2.95 2.93 2.89 2.88 2.87 2.85 2.77 2.76 2.80 2.86 2.84 2.84 2.82 2.83 1. Interest rates on deposits (new business) 2012 2013 X XI XII I II III IV V VI VII VIII IX X XI XII Deposits from households Overnight1 0.18 0.18 0.15 0.14 0.13 0.13 0.15 0.16 0.15 0.14 0.15 0.22 0.21 0.20 0.20 With agreed maturity Up to 1 year 0.27 0.25 0.52 0.37 0.24 0.28 0.19 0.17 0.14 0.18 0.12 0.15 0.23 0.24 0.37 Over 1 and up to 2 years 1.58 1.52 2.05 1.83 1.72 3.82 0.88 0.93 1.42 0.89 0.90 0.95 1.25 0.98 2.68 Over 2 years 4.44 3.56 3.65 4.00 2.82 1.92 2.62 3.46 1.50 2.53 1.75 0.81 0.72 1.27 1.69 Redeemable at notice2 Up to 3 months 0.21 0.21 0.21 0.21 0.21 0.19 0.19 0.18 0.17 0.17 0.17 0.17 0.17 0.17 0.17 Over 3 months – – – – x – – – – – – – – – – Deposits from non-financial corporations Overnight1 0.08 0.09 0.07 0.07 0.09 0.10 0.07 0.05 0.05 0.05 0.06 0.06 0.06 0.05 0.07 With agreed maturity Up to 1 year 0.13 0.12 0.15 0.13 0.13 0.14 0.11 0.11 0.06 0.08 0.07 0.13 0.19 0.08 0.06 Over 1 and up to 2 years – – – – – – x x – – x – – – x Over 2 years – – – – – – x – – – – x – x – Repos – – – – – – – – – – – – – – –
  • 77. 76 1 End-of-period. 2 For this instrument category, households and non-financial corporations are merged and allocated to the household sector. WEIGHTED AVERAGE INTEREST RATES CHARGED BY MFIs IN TRANSACTIONS WITH RESIDENT NON-FINANCIAL CORPORATIONS AND HOUSEHOLDS IN US DOLLARS (CONT.) (%) 21.c 2. Interest rates on deposits (outstanding amounts) 2012 2013 X XI XII I II III IV V VI VII VIII IX X XI XII Deposits from households Overnight1 0.18 0.18 0.15 0.14 0.13 0.13 0.15 0.16 0.15 0.14 0.15 0.22 0.21 0.20 0.20 With agreed maturity Up to 2 years 1.27 1.24 1.12 1.05 1.07 1.07 1.05 1.05 1.03 1.00 0.99 0.95 0.94 0.93 0.90 Over 2 years 3.38 3.30 3.19 3.10 3.17 3.19 3.18 3.17 3.16 3.13 3.10 3.05 3.02 2.91 2.88 Redeemable at notice2 Up to 3 months 0.21 0.21 0.21 0.21 0.21 0.19 0.19 0.18 0.17 0.17 0.17 0.17 0.17 0.17 0.17 Over 3 months – – – – x – – – – – – – – – – Deposits from non-financial corporations Overnight1 0.08 0.09 0.07 0.07 0.09 0.10 0.07 0.05 0.05 0.05 0.06 0.06 0.06 0.05 0.07 With agreed maturity Up to 2 years 0.56 0.44 0.38 0.47 0.45 0.49 0.39 0.37 0.37 0.32 0.25 0.39 0.47 0.66 0.58 Over 2 years 3.57 3.53 3.53 3.53 3.53 3.53 3.53 3.53 1.40 0.87 0.87 0.87 0.86 0.89 0.89 Repos – – – – – – – – – – – – – – –
  • 78. 77 WEIGHTED AVERAGE INTEREST RATES CHARGED BY MFIs IN TRANSACTIONS WITH RESIDENT NON-FINANCIAL CORPORATIONS AND HOUSEHOLDS IN US DOLLARS (CONT.) (%) 21.c 1 End-of-period. 2 The annual percentage rate of charge covers the total cost of a loan. The total cost comprises an interest rate component and a component of other (related) charges, such as the cost of inquiries, administration, preparation of documents, guarantees, etc. 3. Interest rates on loans to households (new business) 2012 2013 X XI XII I II III IV V VI VII VIII IX X XI XII Bank overdraft1 – – – – – – – – – – – – – – – Revolving loans and overdraft1 7.32 7.47 7.57 7.79 8.14 6.17 6.12 6.76 7.39 7.38 7.53 6.24 6.38 6.41 6.41 Extended credit card credit1 25.04 25.66 25.92 25.86 24.76 24.96 25.78 24.97 25.33 24.66 24.85 24.79 25.10 24.95 24.68 Lending for house purchase By initial rate fixation Floating rate and up to 1 year 4.02 2.50 2.46 5.27 3.44 2.38 3.71 2.19 3.01 2.31 3.23 2.90 2.82 2.45 5.26 of wich with collateral or guarantees 3.93 2.16 2.91 5.87 3.27 2.44 3.83 1.92 3.01 2.25 3.21 2.90 2.81 2.28 5.43 Over 1 and up to 5 years – – – – – x x x x x x x x x – of wich with collateral or guarantees – – – – – – – – – – – – – – – Over 5 and up to 10 years x x x x x – – – x – – – – – – of wich with collateral or guarantees x – x – – – – – x – – – – – – Over 10 years – x – – – – – x – – x x x x – of wich with collateral or guarantees – x – – – – – x – – – – – – – Annual percentage rate of charge2 4.29 3.54 2.66 5.75 3.75 2.57 4.14 2.52 3.54 2.42 3.51 3.42 3.20 2.80 5.42 Consumer credit By initial rate fixation Floating rate and up to 1 year 12.43 x 17.92 x 16.12 15.75 13.70 16.68 16.94 x 16.53 x x 16.72 17.00 of wich with collateral or guarantees x x x x x x x x – – x – – x x Over 1 year x x – – x – x x x x x x x x x of wich with collateral or guarantees x – – – – – – – – – – – – – – Annual percentage rate of charge2 18.25 15.00 14.37 24.55 13.82 18.21 13.15 13.75 14.83 13.85 21.38 14.59 14.05 14.31 18.09 Other lending by initial rate fixation Floating rate and up to 1 year x 6.37 4.83 – x 6.21 x x 5.17 x x x 3.83 4.41 3.77 Over 1 year x – x x – x – – – x – x – – –
  • 79. 78 1 End-of-period. WEIGHTED AVERAGE INTEREST RATES CHARGED BY MFIs IN TRANSACTIONS WITH RESIDENT NON-FINANCIAL CORPORATIONS AND HOUSEHOLDS IN US DOLLARS (CONT.) (%) 21.c 4. Interest rates on loans to non-financial corporations (new business) 2012 2013 X XI XII I II III IV V VI VII VIII IX X XI XII Bank overdraft1 – – – – – – – – – – – – – – – Revolving loans and overdraft1 3.65 3.72 3.73 3.74 3.63 3.67 3.59 3.59 3.71 3.53 3.48 3.52 3.56 3.56 3.51 Extended credit card credit1 13.94 17.66 15.94 17.10 16.38 15.02 13.03 14.47 21.53 16.34 15.28 16.77 12.33 13.34 15.99 Other loans up to 0.25 million euro by initial rate fixation Floating rate and up to 1 year x x x x 6.33 7.00 7.13 7.72 7.04 3.58 x x x x x of wich with collateral or guarantees x x x x x x x 7.60 7.13 x x x x x – Over 1 year x – – – – – – – – x – – – x – of wich with collateral or guarantees x – – – – – – – – x – – – x – Other loans over 0.25 million euro and up to 1 million euro by initial rate fixation Floating rate and up to 1 year x x x x 9.14 x x x 8.47 x – x – x x of wich with collateral or guarantees x x x x x x – x 8.47 x – x – x x Over 1 year – – – – – – – x – – x – – – – of wich with collateral or guarantees – – – – – – – x – – x – – – – Other loans over 1 million euro by initial rate fixation Floating rate and up to 1 year – x 7.77 x x x x x x x 7.80 – x x x of wich with collateral or guarantees – x 7.77 x x x x x x x 7.80 – x x x Over 1 year x – x – – – x – – – – – – – – of wich with collateral or guarantees x – x – – – x – – – – – – – –
  • 80. 79 1 Including revolving loans, overdrafts, extended credit card credit and convenience credit card credit. 2 Including bank overdraft. WEIGHTED AVERAGE INTEREST RATES CHARGED BY MFIs IN TRANSACTIONS WITH RESIDENT NON-FINANCIAL CORPORATIONS AND HOUSEHOLDS IN US DOLLARS (CONT.) (%) 21.c 5. Interest rates on loans (outstanding amounts) 2012 2013 X XI XII I II III IV V VI VII VIII IX X XI XII Loans to households Lending for house purchase, with maturity Up to 1 year 2.05 2.19 1.97 1.98 2.84 2.71 1.35 2.19 3.26 1.52 3.90 2.07 2.09 4.16 3.42 Over 1 and up to 5 years 5.63 5.50 5.57 5.85 5.39 5.36 5.38 5.60 5.61 5.62 6.07 6.07 6.12 6.13 6.19 Over 5 years 3.00 2.94 2.91 2.87 2.83 2.82 2.80 2.84 2.82 2.80 2.79 2.77 2.77 2.77 2.75 Consumer credit and other loans, with maturity1 Up to 1 year2 11.35 10.98 9.50 9.57 9.57 10.08 10.25 9.64 9.81 10.27 10.06 10.09 9.52 9.86 11.34 Over 1 and up to 5 years 7.39 7.30 7.31 7.33 7.14 6.71 6.68 6.76 7.10 7.18 7.26 7.30 7.21 7.26 7.47 Over 5 years 3.96 3.90 3.93 3.90 3.92 3.81 3.78 3.73 3.72 3.75 3.75 3.73 3.72 3.79 3.84 Loans to non-financial corporations With maturity1 Up to 1 year2 4.13 4.35 4.66 4.77 4.59 4.72 4.67 4.60 4.57 4.77 4.19 4.25 3.99 4.23 4.21 Over 1 and up to 5 years 5.73 5.21 5.23 5.35 5.45 5.54 5.56 5.68 5.75 5.78 5.82 5.58 5.44 5.50 5.56 Over 5 years 4.36 4.67 5.79 5.83 5.54 5.48 5.54 5.48 5.47 5.59 5.41 5.41 5.52 5.48 5.72
  • 81. 80 2012 2013 X XI XII I II III IV V VI VII VIII IX X XI XII In lats Loans up to an amount of 0.25 million euro 4.23 4.53 4.74 4.70 4.92 4.99 4.55 4.66 4.65 4.47 4.36 4.42 4.55 4.70 4.37 of wich with collateral or guarantees 3.96 4.37 4.50 4.60 4.57 4.82 4.43 4.57 4.61 4.39 4.18 4.31 4.44 4.56 4.27 Loans over an amount of 0.25 million euro and up to 1 million euro 4.11 3.17 3.48 4.19 4.63 4.07 x 3.94 3.97 3.80 7.70 4.08 3.87 4.30 4.99 of wich with collateral or guarantees 4.11 3.17 3.39 4.15 4.63 4.14 x 3.94 3.74 x 4.72 4.13 3.95 4.30 5.15 Loans over 1 million euro x 4.86 x – 4.47 4.78 4.57 5.21 – 2.45 5.07 x x x x of wich with collateral or guarantees x 5.10 x – 4.47 4.78 x 5.21 – 2.45 5.07 x x – x In euro Loans up to an amount of 0.25 million euro 3.93 3.87 4.11 3.83 4.01 4.05 3.95 3.97 4.43 4.24 4.18 4.35 4.19 4.28 3.87 of wich with collateral or guarantees 3.82 3.83 4.04 3.80 3.94 3.99 3.87 3.79 4.42 4.22 4.21 4.24 4.07 4.17 3.83 Loans over an amount of 0.25 million euro and up to 1 million euro 3.45 3.61 4.11 4.09 3.95 4.19 4.28 3.58 4.18 4.34 4.16 4.42 4.18 3.84 4.06 of wich with collateral or guarantees 3.33 3.69 4.02 4.06 3.95 4.15 4.29 3.58 4.16 4.35 4.13 4.40 4.22 3.85 4.06 Loans over 1 million euro 2.65 3.77 2.80 4.01 3.33 3.00 3.47 3.73 3.42 3.18 3.17 3.31 2.37 3.63 5.35 of wich with collateral or guarantees 3.26 3.77 2.37 4.30 3.47 2.99 3.68 3.75 3.33 3.40 3.16 3.35 2.25 3.62 3.68 In US dollars Loans up to an amount of 0.25 million euro x x x 6.75 6.71 x 6.69 6.61 6.07 x 5.49 x x x x of wich with collateral or guarantees – x x x 6.59 x 6.51 6.45 5.95 x 5.37 x x x – Loans over an amount of 0.25 million euro and up to 1 million euro x x x – x x x – x x – – – x x of wich with collateral or guarantees x x x – x x – – x x – – – x x Loans over 1 million euro – x 7.13 – x x – – x – x – – – x of wich with collateral or guarantees – x 7.13 – x x – – x – x – – – x WEIGHTED AVERAGE INTEREST RATES CHARGED BY MFIS IN TRANSACTIONS WITH RESIDENT NON-FINANCIAL CORPORATIONS (NEW BUSINESS) (with floating interest rate, up to 1 year initial rate fixation and original maturity of over 1 year; %) 21.d
  • 82. 81 Loans to non-resident MFIs Total loans Overnight Up to 1 month 1–3 months Over 3 months 2012 X 23 274.4 1 362.8 17.7 15.1 24 670.0 26 350.4 XI 20 294.9 1 367.2 7.6 12.8 21 682.5 23 568.3 XII 19 114.4 1 101.7 74.3 11.7 20 302.1 21 906.6 2013 I 19 923.1 2 576.6 35.4 13.4 22 548.5 24 376.5 II 18 295.5 1 584.2 4.6 36.7 19 921.0 20 948.6 III 19 353.9 2 137.4 83.8 28.6 21 603.7 22 756.5 IV 20 953.5 1 925.3 109.5 63.8 23 052.1 24 552.2 V 19 867.6 2 394.9 2.9 30.5 22 295.9 24 309.4 VI 20 748.8 1 569.9 92.5 29.3 22 440.5 24 319.6 VII 26 712.7 1 842.0 28.4 21.3 28 604.4 30 744.9 VIII 25 717.9 2 254.6 17.8 19.9 28 010.2 30 386.4 IX 22 870.0 1 659.1 92.7 26.1 24 647.9 26 212.5 X 23 340.1 2 128.6 11.7 7.1 25 487.5 27 618.6 XI 18 980.8 1 582.6 241.0 14.6 20 819.0 22 560.2 XII 17 954.9 2 496.2 16.1 15.6 20 482.8 22 161.8 LENDING IN THE INTERBANK MARKETS (transactions; millions of lats) Loans to resident MFIs In lats In foreign currencies Overnight Up to 1 month 1–3 months Over 3 months Overnight Up to 1 month 1–3 months Over 3 months 2012 X 475.3 23.4 7.1 – 505.8 1 009.3 165.3 – – 1 174.6 1 680.4 XI 477.6 51.2 3.0 – 531.8 1 173.5 176.5 – 4.0 1 354.0 1 885.8 XII 339.0 42.0 – 0.5 381.5 1 051.9 167.1 4.0 – 1 223.0 1 604.5 2013 I 472.8 48.2 9.1 – 530.1 1 068.4 215.8 2.8 10.9 1 297.9 1 828.0 II 248.2 26.5 – 5.0 279.7 618.1 129.8 – – 747.9 1 027.6 III 236.6 18.8 0.3 1.5 257.2 727.7 167.6 0.3 – 895.6 1 152.8 IV 335.9 6.1 7.8 – 349.8 1 008.9 127.6 13.8 – 1 150.3 1 500.1 V 524.8 26.3 – – 551.1 1 278.8 183.6 – – 1 462.4 2 013.5 VI 520.6 16.0 0.5 – 537.1 1 216.7 116.9 7.9 0.5 1 342.0 1 879.1 VII 669.2 10.9 5.2 – 685.3 1 301.4 148.5 5.3 – 1 455.2 2 140.5 VIII 520.0 11.2 – – 531.2 1 743.8 101.2 – – 1 845.0 2 376.2 IX 226.0 15.1 0.4 – 241.5 1 221.7 95.6 5.5 0.3 1 323.1 1 564.6 X 566.9 14.3 – – 581.2 1 359.9 182.3 7.7 – 1 549.9 2 131.1 XI 445.8 6.0 – – 451.8 1 053.3 232.6 3.5 – 1 289.4 1 741.2 XII 336.6 31.3 – – 367.9 1 087.9 215.7 7.5 – 1 311.1 1 679.0 22.22.
  • 83. 82 INTEREST RATES IN THE DOMESTIC INTERBANK MARKET (% per annum) 2012 2013 X XI XII I II III IV V VI VII VIII IX X XI XII Weighted average interest rates on loans in lats Overnight 0.1 0.1 0.1 0.1 0.1 0.1 0.1 0.1 0.1 0.1 0.1 0.1 0.1 0.1 0.1 Up to 1 month 0.2 0.2 0.2 0.1 0.1 0.1 0.1 0.1 0.1 0.1 0.1 0.1 0.1 0.1 0.1 1–3 months 0.3 0.7 – 0.3 – 0.1 0.2 – 0.1 0.2 – 0.1 – – – Over 3 months – – 0.1 – 0.7 0.8 – – – – – – – – – Weighted average interest rates on loans in foreign currencies Overnight 0.2 0.2 0.2 0.2 0.2 0.2 0.2 0.2 0.1 0.1 0.1 0.1 0.1 0.1 0.1 Up to 1 month 0.1 0.1 0.1 0.1 0.1 0.2 0.2 0.2 0.1 0.1 0.1 0.1 0.1 0.1 0.1 1–3 months – – 0.4 0.2 – 0.2 0.1 – 0.3 0.2 – 0.2 0.2 0.3 0.2 Over 3 months – 0.8 – 0.4 – – – – 0.5 – – 0.3 – – – 23.a INTEREST RATES SET BY LATVIJAS BANKA (% per annum) Effective date (dd.mm.yyyy) Refinancing rate of Latvijas Banka Lombard rates Interest rates on time deposits Up to the 10th day 11th–20th day Over 20 days 7-day deposits 14-day deposits 17.03.2000 3.5 5.5 6.5 7.5 1.5 1.75 19.11.2001 – – – – 3.0 3.25 17.05.2002 – – – – 2.5 2.75 16.09.2002 3.0 5.0 6.0 7.0 2.0 2.25 11.03.2004 3.5 – – – – – 12.11.2004 4.0 – – – – – 15.07.2006 4.5 5.5 6.5 7.5 – – 17.11.2006 5.0 6.0 7.0 8.0 – – Marginal lending facility rate with Latvijas Banka Deposit facility rate with Latvijas Banka (overnight deposits) 24.03.2007 5.5 6.5 2.0 18.05.2007 6.0 7.5 – 24.02.2008 – – 3.0 To credit institutions that have used the facility no more than 5 working days within the previous 30 day period To credit institutions that have used the facility 6–10 working days within the previous 30 day period To credit institutions that have used the facility more than 10 working days within the previous 30 day period 09.12.2008 – 7.5 15.0 30.0 – 24.01.2009 – – – – 2.0 24.03.2009 5.0 – – – 1.0 24.05.2009 4.0 – – – – Deposit facility rate with Latvijas Banka Overnight deposits 7-day deposits 24.03.2010 3.5 – – – 0.5 1.0 24.07.2010 – – – – 0.375 0.5 24.11.2010 – – – – 0.25 0.375 24.03.2012 – 5.0 10.0 15.0 – – 24.07.2012 3.0 4.0 7.0 10.0 0.1 0.125 24.09.2012 2.5 3.0 6.0 9.0 0.05 0.075 24.07.2013 2.0 2.5 4.75 7.0 – – 24.09.2013 1.5 2.0 3.5 5.0 – – 24.11.2013 0.25 0.75 1.5 2.5 – – 23.b
  • 84. 83 PRINCIPAL FOREIGN EXCHANGE TRANSACTIONS (BY TYPE, COUNTERPARTY AND CURRENCY)1 (millions of lats) 2012 2013 X XI XII I II III IV V VI VII VIII IX X XI XII Type of transaction Spot exchange transactions 32 272.4 29 128.7 23 204.4 20 526.2 23 588.8 23 904.6 22 343.6 20 878.8 21 318.8 22 762.1 21 325.0 21 644.4 23 385.8 19 077.0 24 781.2 Forward exchange contracts 315.8 410.2 714.0 374.4 326.6 562.2 348.6 526.3 320.5 360.4 428.8 366.4 318.8 396.6 475.5 Currency swap arrangements 48 919.5 43 290.0 39 273.8 46 723.3 40 305.8 37 633.1 39 531.5 39 804.5 42 257.6 45 742.6 49 376.9 46 936.3 50 135.1 41 887.1 50 424.0 Counterparties Resident MFIs 7 411.2 6 263.0 3 603.8 3 703.2 2 874.4 1 521.1 1 536.4 3 143.6 3 930.8 4 753.5 3 702.0 2 567.6 2 543.1 2 220.1 2 758.6 Resident other financial intermediaries, financial auxiliaries, insurance corporations and pension funds 327.3 294.0 307.1 381.6 289.1 271.8 199.5 249.5 290.0 183.2 187.7 264.2 177.9 238.6 438.9 Resident government, non-financial corporations and non-profit institutions serving households 972.1 906.0 1 038.8 800.6 858.9 898.2 881.2 880.7 809.9 933.8 804.3 810.5 830.8 795.6 1 216.7 Non-resident MFIs 47 995.8 44 145.3 39 074.6 43 693.8 40 820.0 39 118.6 41 224.8 40 065.3 40 641.6 43 746.8 45 461.3 42 977.2 46 131.7 38 209.1 45 749.8 Non-resident other financial intermediaries, financial auxiliaries, insurance corporations and pension funds 633.7 647.0 659.0 475.5 716.7 663.1 771.7 834.4 1 186.4 1 135.0 1 405.6 3 475.5 3 043.4 3 298.4 3 817.2 Non-resident government, non-financial corporations and non-profit institutions serving households 19 133.1 16 148.6 14 466.8 14 891.5 14 672.2 13 886.3 13 704.8 11 606.4 11 090.7 11 715.9 12 320.8 12 272.7 13 855.9 10 631.0 18 570.6 Households 5 034.3 4 425.0 4 042.2 3 677.6 3 990.0 5 740.7 3 905.3 4 429.8 5 947.5 6 396.8 7 248.9 6 579.5 7 256.8 5 967.9 3 129.0 Currencies Total in all currencies 81 507.6 72 828.9 63 192.2 67 623.9 64 221.3 62 099.9 62 223.7 61 209.6 63 897.0 68 865.1 71 130.7 68 947.2 73 839.7 61 360.7 75 680.8 incl. lats for euro 6 618.7 10 970.5 8 985.4 8 736.6 6 508.2 6 139.3 6 642.4 8 461.4 9 131.7 9 488.6 8 457.9 6 388.6 7 558.6 6 912.3 11 715.4 incl. lats for US dollars 712.0 352.3 282.7 311.6 213.4 221.1 209.5 206.0 162.7 681.5 311.5 220.0 333.9 205.4 251.0 incl. lats for other currencies 84.2 74.5 78.2 58.4 55.4 68.5 67.9 65.5 65.0 71.8 71.8 70.7 66.3 64.7 76.4 1 Including the cash and non-cash transactions performed by credit institutions. The volume of cash and non-cash transactions has been translated into lats applying the exchange rate of the respective foreign currency as set by Latvijas Banka on the last day of the reporting month. INTEREST RATES IN LATVIJAS BANKA TENDERS OF REPURCHASE AGREEMENTS AND SHORT-TERM CURRENCY SWAP CONTRACTS (% per annum) 2012 2013 X XI XII I II III IV V VI VII VIII IX X XI XII Main refinancing operation with maturity 7 days average interest rate – – – – – – – – – – – – – – 0.5 Weighted average interest rate on short-term currency swaps – – – – – – – – – – – – – – – 23.c 24.
  • 85. 84 NON-CASH FOREIGN EXCHANGE TRANSACTIONS1 (millions of lats) 2012 2013 X XI XII I II III IV V VI VII VIII IX X XI XII EUR for LVL2 Amount 6 539.6 10 853.8 8 891.0 8 660.5 6 461.8 6 107.9 6 602.1 8 413.5 9 098.9 9 455.2 8 430.3 6 363.7 7 529.1 6 889.8 11 681.6 %3 8.0 14.9 14.1 12.8 10.1 9.8 10.9 13.8 14.3 13.8 11.9 9.2 10.2 11.3 15.5 USD for LVL2 Amount 689.9 339.9 271.0 303.0 196.5 206.2 196.7 192.0 150.7 675.9 301.1 212.3 326.7 198.7 242.5 %3 0.8 0.5 0.4 0.4 0.3 0.3 0.3 0.3 0.2 1.0 0.4 0.3 0.4 0.3 0.3 Other currencies for LVL2 Amount 74.5 65.5 68.9 51.3 49.5 60.7 60.3 56.8 56.0 60.4 62.2 63.4 59.5 57.9 69.4 %3 0.1 0.1 0.1 0.1 0.1 0.1 0.1 0.1 0.1 0.1 0.1 0.1 0.1 0.1 0.1 USD for EUR Amount 46 707.5 37 984.4 31 461.8 36 893.3 39 026.3 34 853.5 34 119.7 32 507.2 34 297.6 38 137.6 40 020.6 39 036.5 44 564.6 35 794.4 39 479.3 %3 57.4 52.3 49.9 54.6 60.8 56.2 56.2 53.2 53.7 55.4 56.3 56.7 60.5 58.5 52.3 GBP for EUR Amount 1 713.4 1 432.6 689.7 724.8 1 180.7 1 087.5 829.5 814.8 753.5 848.3 803.4 1 341.6 840.9 803.4 986.6 %3 2.1 2.0 1.1 1.1 1.8 1.8 1.4 1.3 1.2 1.2 1.1 1.9 1.1 1.3 1.3 Other currencies (except LVL) for EUR Amount 3 881.0 3 441.7 2 783.2 3 282.0 2 859.1 2 483.0 2 829.9 2 555.3 3 223.9 3 035.3 2 776.7 2 532.1 2 563.0 2 602.3 3 020.2 %3 4.8 4.7 4.4 4.9 4.5 4.0 4.7 4.2 5.0 4.4 3.9 3.7 3.5 4.3 4.0 RUB for USD Amount 6 915.2 6 471.0 9 273.6 5 492.1 6 140.4 7 229.9 7 573.3 6 472.8 7 971.5 8 152.5 9 098.9 7 207.0 7 878.2 5 407.5 6 971.5 %3 8.5 8.9 14.7 8.1 9.6 11.7 12.5 10.6 12.5 11.8 12.8 10.5 10.7 8.8 9.2 GBP for USD Amount 4 831.1 3 983.9 3 387.1 5 515.4 3 150.3 4 326.0 3 116.5 3 629.4 2 726.8 2 964.7 3 201.3 5 437.6 4 108.0 3 700.8 6 483.3 %3 5.9 5.5 5.4 8.2 4.9 7.0 5.1 5.9 4.3 4.3 4.5 7.9 5.6 6.1 8.6 SEK for USD Amount 52.9 72.7 21.6 32.0 14.6 25.2 9.8 13.8 28.7 46.5 23.3 59.4 57.9 9.9 14.9 %3 0.1 0.1 0 0 0 0 0 0 0 0.1 0 0.1 0.1 0 0 Other currencies (except LVL and EUR) for USD Amount 8 417.3 5 774.6 4 188.6 4 644.1 3 182.3 3 106.7 4 365.5 4 662.7 2 976.4 3 371.5 4 387.9 4 790.4 3 760.9 3 759.5 4 537.2 %3 10.4 7.9 6.7 6.9 5.0 5.0 7.2 7.6 4.7 4.9 6.2 7.0 5.1 6.1 6.0 Other currencies (except LVL, EUR and USD) for other currencies Amount 1 574.2 2 270.7 2 040.3 1 927.7 1 890.5 2 559.2 956.1 1 820.6 2 559.1 2 053.6 1 977.4 1 758.2 1 963.9 1 958.9 2 031.0 %3 1.9 3.1 3.2 2.9 2.9 4.1 1.6 3.0 4.0 3.0 2.8 2.6 2.7 3.2 2.7 1 Including non-cash transactions performed by credit institutions, reported by major currency. 2 The transaction volume has been translated into lats using the weighted average exchange rate of the respective foreign currency for the reporting month. 3 As percentage of the total. 25. MONTHLY AVERAGES OF THE EXCHANGE RATES SET BY LATVIJAS BANKA (LVL vs foreign currency) 2012 2013 X XI XII I II III IV V VI VII VIII IX X XI XII EUR 0.7028 0.7028 0.7028 0.7028 0.7028 0.7028 0.7028 0.7028 0.7028 0.7028 0.7028 0.7028 0.7028 0.7028 0.7028 USD 0.5421 0.5478 0.5361 0.5305 0.5243 0.5415 0.5408 0.5410 0.5330 0.5371 0.5277 0.5267 0.5161 0.5203 0.5138 GBP 0.8717 0.8748 0.8652 0.8487 0.8144 0.8168 0.8256 0.8285 0.8242 0.8164 0.8162 0.8337 0.8306 0.8365 0.8411 100 JPY 0.6875 0.6783 0.6421 0.5990 0.5641 0.5723 0.5543 0.5385 0.5464 0.5390 0.5396 0.5309 0.5275 0.5219 0.4977 26.
  • 86. 85 WEIGHTED AVERAGE EXCHANGE RATES (CASH TRANSACTIONS) (LVL vs foreign currency) 2012 2013 X XI XII I II III IV V VI VII VIII IX X XI XII EUR Buy 0.6914 0.6917 0.6915 0.6922 0.6961 0.6974 0.6967 0.6955 0.6961 0.6964 0.6974 0.6978 0.6988 0.6984 0.6995 Sell 0.6968 0.6977 0.6976 0.6991 0.7019 0.7034 0.7030 0.7018 0.7034 0.7045 0.7050 0.7054 0.7055 0.7052 0.7061 USD Buy 0.5334 0.5392 0.5273 0.5218 0.5207 0.5375 0.5352 0.5355 0.5280 0.5327 0.5238 0.5233 0.5122 0.5170 0.5102 Sell 0.5383 0.5437 0.5324 0.5254 0.5236 0.5408 0.5393 0.5398 0.5326 0.5371 0.5284 0.5268 0.5163 0.5215 0.5146 GBP Buy 0.8517 0.8481 0.8427 0.8288 0.8007 0.8061 0.8131 0.8141 0.8122 0.8037 0.8055 0.8218 0.8186 0.8271 0.8272 Sell 0.8645 0.8676 0.8577 0.8439 0.8146 0.8182 0.8254 0.8252 0.8240 0.8144 0.8166 0.8350 0.8314 0.8392 0.8413 100 JPY Buy 0.6392 0.6489 0.5860 0.5725 0.5379 0.5481 0.5397 0.4810 0.5232 0.5186 0.5185 0.5101 0.5001 0.5117 0.4837 Sell 0.6917 0.6597 0.6256 0.5923 0.5719 0.5736 0.5637 0.5292 0.5375 0.5364 0.5373 0.5309 0.5256 0.5261 0.4988 SEK Buy 0.0797 0.0796 0.0789 0.0794 0.0808 0.0826 0.0817 0.0806 0.0796 0.0796 0.0792 0.0799 0.0791 0.0778 0.0767 Sell 0.0813 0.0811 0.0807 0.0817 0.0825 0.0842 0.0832 0.0821 0.0816 0.0813 0.0812 0.0812 0.0810 0.0798 0.0791 RUB Buy 0.0171 0.0169 0.0170 0.0170 0.0171 0.0173 0.0170 0.0169 0.0162 0.0161 0.0157 0.0159 0.0159 0.0157 0.0154 Sell 0.0174 0.0173 0.0173 0.0173 0.0174 0.0176 0.0173 0.0172 0.0166 0.0164 0.0161 0.0162 0.0162 0.0160 0.0157 CHF Buy 0.5670 0.5695 0.5680 0.5618 0.5607 0.5638 0.5663 0.5530 0.5602 0.5588 0.5600 0.5601 0.5622 0.5639 0.5641 Sell 0.5785 0.5803 0.5789 0.5718 0.5709 0.5744 0.5759 0.5661 0.5698 0.5691 0.5716 0.5722 0.5716 0.5720 0.5764 27.
  • 87. 86 STRUCTURE OF GOVERNMENT SECURITIES (at end of period; millions of lats) 2012 2013 X XI XII I II III IV V VI VII VIII IX X XI XII Stock of government securities outstanding 670.9 675.1 675.1 665.1 581.0 594.2 574.5 596.7 606.7 606.7 631.7 636.7 653.1 667.3 679.3 Residents 651.5 655.9 654.5 643.2 559.0 571.5 551.6 570.2 578.5 577.9 601.3 607.4 624.5 639.4 651.1 Non-financial corporations 20.9 20.9 20.8 20.8 21.4 84.7 20.5 20.0 20.0 20.0 20.0 20.0 20.0 20.0 20.4 Credit institutions 371.2 363.7 364.5 347.2 272.2 277.4 264.9 282.9 290.5 295.3 307.8 312.5 315.3 319.7 336.5 Money market funds 18.8 23.6 21.5 22.7 17.5 17.9 12.8 13.9 12.7 11.1 11.7 10.9 8.5 9.6 3.0 MFIs excluding central banks, credit institutions and money market funds 0 0 0 0 0 0 0 0 0 0 0 0 0 0 0 Other financial intermediaries excluding investment funds 72.5 72.5 72.5 72.5 69.3 4.9 62.2 62.2 62.2 62.2 62.2 62.2 62.2 62.2 62.2 Financial auxiliaries 0.1 0.1 0.1 0.1 0 0 0 0 0 0 0 0 0 0 0 Insurance corporations and pension funds 159.0 166.1 166.1 170.8 174.0 182.4 187.1 186.5 188.4 184.6 194.9 197.0 213.9 222.7 223.7 Central government 0 0 0 0 0 0 0 0 0 0 0 0 0 0 0 Households 3.5 3.5 3.5 3.6 2.9 2.5 2.5 3.0 3.0 3.1 3.1 3.1 3.1 3.1 3.1 Non-profit institutions serving households 5.5 5.5 5.5 5.5 1.7 1.7 1.6 1.6 1.6 1.6 1.6 1.6 1.6 2.1 2.2 Non-residents 19.4 19.2 20.6 21.9 22.0 22.7 22.9 26.5 28.1 28.8 30.4 29.3 28.6 28.0 28.2 Non-financial corporations 0 0 0 0 0 0 0 0 0 0 0 0 0 0 0 Credit institutions 12.4 13.9 13.9 13.9 15.2 15.7 15.2 18.7 21.0 22.3 23.8 22.8 22.0 21.7 21.7 Money market funds 0 0 0 0 0 0 0 0 0 0 0 0 0 0 0 MFIs excluding central banks, credit institutions and money market funds 0 0 0 0 0 0 0 0 0 0 0 0 0 0 0 Other financial intermediaries excluding investment funds 0 0 0 0 0 0 0 0 0 0 0 0 0 0 0 Financial auxiliaries 7.0 5.3 6.7 8.0 6.8 7.0 7.8 7.8 7.2 6.5 6.6 6.5 6.6 6.3 6.5 Insurance corporations and pension funds 0 0 0 0 0 0 0 0 0 0 0 0 0 0 0 Central government 0 0 0 0 0 0 0 0 0 0 0 0 0 0 0 Households 0 0 0 0 0 0 0 0 0 0 0 0 0 0 0 Non-profit institutions serving households 0 0 0 0 0 0 0 0 0 0 0 0 0 0 0 28.
  • 88. 87 AUCTIONS OF GOVERNMENT SECURITIES IN THE PRIMARY MARKET (Q4 2013) Date (dd.mm.) Initial maturity (months) Supply (thousands of lats) Demand (thousands of lats) Purchase (thousands of lats) Weighted average discount rate (%) Competitive multi-price auctions 02.10. 60 8 000 22 210 8 000 2.216 09.10. 12 9 000 22 000 9 000 0.353 23.10. 60 9 000 22 570 9 000 2.294 30.10. 12 10 000 24 000 10 000 0.376 13.11. 12 10 000 24 000 10 000 0.386 27.11. 60 8 000 34 400 8 000 1.959 04.12. 6 8 000 27 500 8 000 0.228 11.12. 12 10 000 33 100 10 000 0.372 Primary placement of government securities via outright sales of securities 03.10. 60 2 000 5 330 2 000 2.216 10.10. 12 1 000 1 170 1 000 0.353 24.10. 60 1 000 2 410 1 000 2.294 31.10. 12 2 000 3 750 2 000 0.376 14.11. 12 2 000 4 220 2 000 0.386 28.11. 60 2 000 8 000 2 000 1.959 05.12. 6 2 000 5 160 2 000 0.228 12.12. 12 2 000 6 100 2 000 0.372 29. DYNAMICS OF GDP 2012 2013 Q1 Q2 Q3 Q4 Q2 Q3 Q4Q1 At current prices; millions of lats 15 519.8 3 406.7 3 808.4 4 042.4 4 262.3 4 032.3² 4 303.5² 4 449.216 386.2 3 601.2² At constant prices1 ; millions of lats 14 164.8 3 128.1 3 526.4 3 675.2 3 835.1 3 680.4² 3 844.9² 3 974.014 747.0 3 247.7² Annual growth rate (%) 5.2 7.1 4.9 4.6 4.6 4.4² 4.6² 3.64.1 3.8 Gross value added 4.7 5.7 4.6 4.7 3.9 3.8² 4.4² 3.23.7 3.5 Goods-producing sector 6.7 10.1 7.1 5.3 5.0 0.3² 3.3² 1.10.9 –1.7² Services sector 4.0 3.6 3.7 4.5 4.0 5.4 5.0 4.35.0 5.6 1 Chain-linked; average prices in 2010. 2 Data have been revised. 31. LATVIJAS BANKA TRANSACTIONS IN THE SECONDARY MARKET FOR GOVERNMENT SECURITIES (millions of lats) 2012 2013 X XI XII I II III IV V VI VII VIII IX X XI XII Securities purchased 0 0 0 0 0 0 0 0 0 0 0 0 0 0 0 Securities sold 0 0 0 0 0 0 0 0 0 0 0 0 0 0 0 30.
  • 89. 88 20121 2013 X XI XII I1 II1 III1 IV1 V1 VI1 VII1 VIII1 IX1 X XI XII Exports 698.3 698.2 562.2 531.7 544.4 566.8 586.1 573.0 555.2 541.9 595.8 645.0 690.9 644.4 565.8 Imports 862.3 795.9 698.0 684.5 673.0 762.7 767.0 702.7 674.1 763.5 759.1 780.6 794.4 723.1 691.6 Balance –164.0 –97.7 –135.8 –152.8 –128.6 –195.9 –180.9 –129.7 –118.9 –221.6 –163.3 –135.6 –103.5 –78.7 –125.8 1 Data have been revised. CHANGES IN THE AVERAGE MONTHLY WAGES AND SALARIES AND UNEMPLOYMENT 2012 2013 X XI XII I II III IV V VI VII VIII IX X XI XII Average gross wages and salaries LVL per month 486 477 513 485 475 492 503 503¹ 502¹ 528 501 494¹ 508 499 545 Year-on-year changes (%) 105.3 102.8 102.6 104.5 103.4 103.6 105.0¹ 105.2¹ 103.5¹ 106.8 103.3¹ 105.1 104.5 104.5 106.1 Real net wage index (year-on-year basis; %) 103.7 101.3 100.8 104.9 104.1 104.3 106.1¹ 106.0¹ 103.8¹ 107.7¹ 104.7 106.7¹ 105.6 106.0 107.7 Number of registered unemployed persons At end of month 105 670 104 414 104 052 107 488 107 687 107 063 102 760 97 769 94 754 92 975 91 202 89 435 89 616 91 619 93 321 Year-on-year changes (%) 80.9 80.2 79.9 81.1 80.7 81.0 80.4 80.1 80.6 81.1 81.8 82.6 84.8 87.7 89.7 1 Data have been revised. 32. LATVIAN FOREIGN TRADE BALANCE (millions of lats; exports – in FOB prices, imports – in CIF prices) 20121 2013 Q1 Q2 Q3 Q4 Q11 Q21 Q31 Q4 Exports 6 937.4 1 518.7 1 616.3 1 843.6 1 958.7 7 041.0 1 642.8 1 714.3 1 782.8 1 901.1 Imports 8 793.7 2 008.4 2 153.0 2 276.1 2 356.2 8 776.3 2 120.2 2 143.8 2 303.2 2 209.1 Balance –1 856.3 –489.7 –536.6 –432.4 –397.5 –1 735.3 –477.3 –429.5 –520.4 –308.0 33.
  • 90. 89 MAIN IMPORT GOODS OF LATVIA (in CIF prices) 201320121 Q11 Q21 Q31 Q4 Millions of lats % Millions of lats % Millions of lats % Millions of lats % Millions of lats % Millions of lats % Total 8 793.7 100.0 8 776.3 100.0 2 120.2 100.0 2 143.8 100.0 2 303.2 100.0 2 209.1 100.0 Agricultural and food products 1 356.3 15.4 1 389.1 15.8 316.6 14.9 345.0 16.1 355.2 15.4 372.3 16.8 Mineral products 1 552.9 17.7 1 499.2 17.1 409.1 19.3 342.4 16.0 394.3 17.1 353.4 16.0 Products of the chemical and allied industries 780.0 8.9 827.6 9.4 208.4 9.8 203.5 9.5 199.7 8.7 216.0 9.8 Plastics and articles thereof; rubber and articles thereof 453.9 5.2 486.1 5.5 109.9 5.2 123.9 5.8 141.8 6.1 110.6 5.0 Wood and articles of wood 139.6 1.6 175.6 2.0 42.2 2.0 45.1 2.1 43.0 1.9 45.3 2.1 Pulp of wood; paper and paperboard 187.7 2.1 215.3 2.5 49.7 2.4 51.1 2.4 55.2 2.4 59.2 2.7 Textiles and textile articles 370.4 4.2 417.7 4.8 104.1 4.9 99.6 4.6 122.7 5.3 91.3 4.1 Articles of stone, plaster, cement, glassware and ceramic products 138.9 1.6 150.7 1.7 29.8 1.4 38.8 1.8 44.9 1.9 37.2 1.7 Base metals and articles of base metals 916.2 10.4 781.0 8.9 200.8 9.5 186.9 8.7 199.4 8.7 193.9 8.8 Machinery and mechanical appliances; electrical equipment 1 605.3 18.2 1 615.4 18.4 367.9 17.4 402.5 18.8 424.4 18.4 420.6 19.0 Transport vehicles 757.8 8.6 648.8 7.4 153.6 7.2 178.3 8.3 162.6 7.1 154.3 7.0 Miscellaneous manufactured articles 190.7 2.2 198.6 2.3 42.9 2.0 47.9 2.2 52.0 2.3 55.9 2.5 Other goods 343.9 3.9 371.1 4.2 85.2 4.0 78.9 3.7 108.0 4.7 99.0 4.5 1 Data have been revised. 35. MAIN EXPORT GOODS OF LATVIA (in FOB prices) 20121 2013 Q11 Q21 Q31 Q4 Millions of lats % Millions of lats % Millions of lats % Millions of lats % Millions of lats % Millions of lats % Total 6 937.4 100.0 7 041.0 100.0 1 642.8 100.0 1 714.3 100.0 1 782.8 100.0 1 901.1 100.0 Agricultural and food products 1 423.1 20.5 1 422.0 20.2 307.6 18.7 310.0 18.1 349.8 19.6 454.5 23.9 Mineral products 603.6 8.7 617.4 8.8 126.5 7.7 147.4 8.6 184.4 10.3 159.0 8.4 Products of the chemical and allied industries 447.6 6.5 472.2 6.7 115.0 7.0 102.6 6.0 111.8 6.3 142.8 7.5 Plastics and articles thereof; rubber and articles thereof 210.6 3.0 209.3 3.0 48.2 2.9 56.0 3.3 56.4 3.2 48.7 2.5 Wood and articles of wood 1 030.9 14.9 1 134.6 16.1 261.2 15.9 293.7 17.1 288.5 16.2 291.1 15.3 Pulp of wood; paper and paperboard 138.5 2.0 155.4 2.2 38.6 2.3 35.9 2.1 39.2 2.2 41.8 2.2 Textiles and textile articles 271.7 3.9 299.6 4.2 68.4 4.2 75.6 4.4 81.0 4.5 74.6 3.9 Articles of stone, plaster, cement, glassware and ceramic products 132.0 1.9 152.0 2.2 32.6 2.0 40.6 2.4 42.8 2.4 36.1 1.9 Base metals and articles of base metals 970.6 14.0 757.3 10.7 218.3 13.3 184.5 10.7 182.1 10.2 172.4 9.1 Machinery and mechanical appliances; electrical equipment 950.6 13.7 1 088.0 15.4 254.1 15.5 277.1 16.2 266.5 14.9 290.2 15.3 Transport vehicles 375.3 5.4 314.1 4.5 82.6 5.0 90.8 5.3 70.7 4.0 70.0 3.7 Miscellaneous manufactured articles 183.3 2.6 208.3 3.0 47.5 2.9 52.2 3.0 54.4 3.1 54.2 2.9 Other goods 199.6 2.9 210.8 3.0 42.2 2.6 47.9 2.8 55.2 3.1 65.6 3.4 1 Data have been revised. 34.
  • 91. 90 LATVIAN FOREIGN TRADE PARTNERS (exports – in FOB prices, imports – in CIF prices) 20121 2013 Millions of lats % of the total Millions of lats % of the total Exports Imports Balance Exports Imports Exports Imports Balance Exports Imports Total 6 937.4 8 793.7 –1 856.3 100.0 100.0 7 041.0 8 776.3 –1 735.3 100.0 100.0 EU15 countries 2 185.5 3 237.7 –1 052.2 31.5 36.8 2 187.9 3 251.4 –1 063.5 31.1 37.0 EU27 (EU28 as of Q3 of 2013) countries 4 823.0 6 803.0 –1 980.0 69.5 77.4 5 000.1 6 973.7 –1 973.6 71.0 79.5 incl. Germany 550.0 1 015.3 –465.3 7.9 11.5 513.8 988.7 –474.9 7.3 11.3 Sweden 359.3 296.4 62.9 5.2 3.4 358.3 297.5 60.9 5.1 3.4 UK 225.7 141.1 84.6 3.3 1.6 253.8 139.6 114.2 3.6 1.6 Finland 188.6 399.9 –211.3 2.7 4.5 186.8 408.9 –222.1 2.7 4.7 Denmark 273.1 198.5 74.6 3.9 2.3 291.3 194.8 96.5 4.1 2.2 Netherlands 189.0 298.3 –109.3 2.7 3.4 154.9 323.7 –168.7 2.2 3.7 Lithuania 1 110.2 1 747.3 –637.1 16.0 19.9 1 205.3 1 765.2 –559.9 17.1 20.1 Estonia 904.8 681.3 223.5 13.0 7.7 896.6 724.4 172.1 12.7 8.3 Poland 417.1 757.1 –340.0 6.0 8.6 462.6 867.6 –405.0 6.6 9.9 CIS 1 069.6 1 320.4 –250.8 15.4 15.0 1 118.2 1 091.7 26.5 15.9 12.4 incl. Russia 791.2 827.8 –36.6 11.4 9.4 811.5 743.7 67.8 11.5 8.5 Other countries 1 044.8 670.3 374.5 15.1 7.6 922.6 710.8 211.8 13.1 8.1 incl. USA 77.0 66.1 10.9 1.1 0.8 82.6 58.4 24.2 1.2 0.7 Norway 182.7 48.8 133.9 2.6 0.6 186.9 41.8 145.1 2.7 0.5 China 32.7 244.7 –212.0 0.5 2.8 59.0 236.6 –177.6 0.8 2.7 1 Data have been revised. 36.
  • 92. 91 CONVENIENCE AND EXTENDED CREDIT, REVOLVING LOANS AND OVERDRAFT TO RESIDENT NON-FINANCIAL CORPORATIONS AND HOUSEHOLDS (at end of period; millions of lats) Non-financial corporations Households In lats In euro In lats In euro Revolving loans and overdraft Convenience credit Extended credit Revolving loans and overdraft Convenience credit Extended credit Revolving loans and overdraft Convenience credit Extended credit Revolving loans and overdraft Convenience credit Extended credit 2012 X 251.7 1.0 0.9 501.1 0.3 0.1 50.5 15.9 98.6 17.2 1.3 2.6 XI 263.1 0.8 0.9 485.5 0.2 0.1 49.4 15.7 97.3 16.5 1.2 2.5 XII 267.8 0.9 0.9 451.9 0.2 0.1 47.9 14.1 95.7 14.5 1.2 2.4 2013 I 265.6 0.9 0.9 465.9 0.2 0.1 48.8 14.2 96.2 13.9 1.2 2.5 II 277.4 0.8 0.8 466.8 0.2 0.1 47.8 13.9 94.6 13.4 1.2 2.4 III 265.1 0.8 0.8 442.2 0.2 0.1 47.0 13.8 94.2 13.5 1.2 2.4 IV 269.8 0.9 0.9 441.3 0.2 0.1 46.6 13.8 94.0 13.6 1.2 2.5 V 276.9 0.8 0.9 436.9 0.2 0.1 42.9 13.8 94.5 13.3 1.2 2.5 VI 279.6 0.7 0.9 410.5 0.2 0.2 41.1 13.5 92.9 13.0 1.2 2.4 VII 271.6 0.8 0.9 421.1 0.2 0.1 40.9 13.5 92.5 12.8 1.2 2.5 VIII 270.2 0.8 0.9 435.7 0.2 0.1 40.9 13.3 91.8 12.9 1.2 2.4 IX 261.5 0.8 0.9 426.5 0.2 0.1 41.0 13.2 90.5 12.7 1.2 2.4 X 255.1 0.9 0.9 413.3 0.2 0.1 38.4 13.2 90.6 12.0 1.2 2.5 XI 260.1 0.9 0.9 412.4 0.3 0.1 37.3 13.1 89.1 12.2 1.2 2.5 XII 263.7 1.0 0.8 401.4 0.3 0.1 34.9 8.4 86.3 11.7 1.0 2.4 37. LOANS TO RESIDENT NON-FINANCIAL CORPORATIONS IN THE BREAKDOWN BY RESIDUAL MATURITY AND BY INTEREST RATE RESET PERIOD (at end of period; millions of lats) In lats In euro With original maturity of over 1 year With original maturity of over 2 years With original maturity of over 1 year With original maturity of over 2 years with a residual maturity of up to 1 year with a residual maturity of over 1 year and interest rate reset period ≤1 year with a residual maturity of up to 2 years with a residual maturity of over 2 years and interest rate reset period ≤2 years with a residual maturity of up to 1 year with a residual maturity of over 1 year and interest rate reset period ≤1 year with a residual maturity of up to 2 years with a residual maturity of over 2 years and interest rate reset period ≤2 years 2012 XII 515.2 51.4 363.2 485.6 111.4 239.1 3 356.1 711.7 2 215.0 3 125.9 887.3 1 991.0 2013 III 527.0 66.4 360.1 500.0 124.6 240.0 3 267.2 655.8 2 193.0 3 071.9 894.2 1 949.7 VI 419.8 56.5 269.5 397.0 110.3 243.1 3 211.0 648.9 2 207.1 3 050.4 908.3 1 979.0 IX 434.1 59.9 256.9 404.3 116.1 223.6 3 181.4 607.3 2 240.8 3 028.7 862.7 2 008.4 XII 437.4 60.1 282.0 408.3 120.9 245.9 3 188.3 567.5 2 280.3 3 045.4 842.2 2 039.1 38.a
  • 93. 92 LOANS TO RESIDENT HOUSEHOLDS IN THE BREAKDOWN BY RESIDUAL MATURITY AND BY INTEREST RATE RESET PERIOD (at end of period; millions of lats) In lats In euro With original maturity of over 1 year With original maturity of over 2 years With original maturity of over 1 year With original maturity of over 2 years with a residual maturity of up to 1 year with a residual maturity of over 1 year and interest rate reset period ≤1 year with a residual maturity of up to 2 years with a residual maturity of over 2 years and interest rate reset period ≤2 years with a residual maturity of up to 1 year with a residual maturity of over 1 year and interest rate reset period ≤1 year with a residual maturity of up to 2 years with a residual maturity of over 2 years and interest rate reset period ≤2 years 2012 XII 336.3 33.2 158.2 317.8 52.2 168.2 3 746.0 157.4 3 118.4 3 705.6 248.2 3 167.7 2013 III 342.3 30.5 169.1 324.1 52.4 175.4 3 665.3 148.1 3 032.5 3 626.1 239.4 3 070.9 VI 349.4 29.9 178.3 330.9 53.8 183.2 3 603.4 147.6 2 977.6 3 564.7 242.8 3 007.5 IX 355.6 31.9 209.8 338.0 60.1 210.9 3 532.7 135.3 2 920.5 3 495.7 243.2 2 940.2 XII 349.7 32.1 215.0 333.9 61.5 210.8 3 453.2 125.3 2 870.7 3 416.8 238.7 2 879.6 38.b
  • 94. Additional Information General notes The cut-off date for the information used in this report is 25 March 2014. The Macroeconomic Developments Report published by Latvijas Banka is based on data provided by the CSB, Ministry of Finance of the Republic of Latvia, FCMC, NASDAQ OMX Riga and Latvijas Banka. Data sources for charts are EC (Charts 1.1, 1.4, 3.4, 3.5, 4.3, 4.4, 4.14 and 5.5), CSB (Charts 1.2–1.4, 3.1–3.4, 3.7–3.9, 4.1, 4.2, 4.5–4.9, 4.11–4.13, 5.1 and 5.2), Bloomberg (Charts 2.1–2.4 and 2.6–2.8), Treasury (Charts 2.5 and 3.10–3.12)), Latvijas Banka (Charts 2.9–2.22, 4.9, 4.13, 5.1, 5.2, 6.1–6.4, 7.1 and 7.2), ECB (Chart 2.10), Road Traffic Safety Directorate (Chart 3.6), SEA (Chart 4.9–4.11), Reuters (Chart 5.3) and Food and Agriculture Organisation of the United Nations (Chart 5.4). Data sources for Statistics tables are Latvijas Banka (Tables 1, 3–28, 30, 37 and 38), NASDAQ OMX Riga (Table 1), Ministry of Finance of the Republic of Latvia (Tables 2ab and 29) and CSB (Tables 2ab and 31–36). Details may not add because of rounding-off. FOB value is the price of a commodity on the border of the exporting country, including the transportation and insurance costs only up to the border. CIF value is the price of a commodity on the border of the importing country, including the transportation and insurance costs only up to the border. "–" – no transactions in the period; "x" – no data available, no computation of indicators possible or insufficient number of respondents to publish information. Money and banking sector Calculation of monetary aggregates includes the balance sheet data of Latvijas Banka and information from the financial position reports of other MFIs, prepared using methodology of Latvijas Banka (see Latvijas Banka Regulation No. 40 "Regulation for Compiling the Monthly Financial Position Report of Monetary Financial Institutions" of 16 July 2009, based on Regulation (EC) No. 25/2009 of the ECB of 19 December 2008 concerning the balance sheet of the monetary financial institutions sector (recast; ECB/2008/32). In the publication, the following terms have been used: MFIs – financial institutions forming the money-issuing sector. In Latvia, MFIs include Latvijas Banka, credit institutions and other MFIs in compliance with the List of Monetary Financial Institutions of the Republic of Latvia compiled by Latvijas Banka. In the EU, MFIs include the ECB, the national central banks of the euro area, credit institutions and other monetary financial institutions (money market funds) in compliance with the original List of Monetary Financial Institutions published by the ECB. Non-MFIs – entities other than MFIs. Financial institutions – other financial intermediaries, excluding insurance corporations and pension funds, (hereinafter, OFIs), financial auxiliaries, insurance corporations and pension funds. 93 Additional InformationMACROECONOMIC DEVELOPMENTS REPORT March 2014
  • 95. OFIs – financial corporations that are primarily engaged in financial intermediation by incurring liabilities in forms other than currency, deposits and close substitutes for deposits from their customers other than MFIs, or insurance technical reserves. OFIs are corporations engaged in lending (e.g. financial leasing companies, factoring companies, export/import financing companies), investment funds, investment brokerage companies, financial vehicle corporations, financial holding corporations, and venture capital corporations. OFIs data include also financial auxiliaries' data. Financial auxiliaries – financial corporations that are primarily engaged in auxiliary financial activities, i.e. activities that are closely related to financial intermediation but are not financial intermediation themselves, e.g. investment brokers who do not engage in financial intermediation services on their own behalf, corporations that provide infrastructure for financial markets, central supervisory institutions of financial institutions and the financial market provided that they are separate institutional units. The Financial and Capital Market Commission and the NASDAQ OMX Riga shall be regarded as financial auxiliaries. Financial auxiliaries' data are included in OFIs data. Non-financial corporations – economic entities producing goods or providing non-financial services with the aim of gaining profit or other yield. Households – natural persons or groups of natural persons whose principal activity is consumption and who produce goods and services exclusively for their own consumption, as well as non-profit institutions serving households. The following are also regarded as households in the Republic of Latvia: persons engaged in individual entrepreneurship provided that they have not registered their activity with the Commercial Register of the Enterprise Register of the Republic of Latvia. Holdings of securities other than shares – financial assets, which are instruments of the holder, usually negotiable and traded or compensated on secondary markets and which do not grant the holder any ownership rights over the issuing institutional unit. The following information is published in accordance with the ECB methodology: 1) Assets and liabilities of Latvijas Banka (Table 6), expanding the range of reported financial instruments; 2) Aggregated balance sheet of MFIs (excluding Latvijas Banka), i.e. the sum of the harmonised balance sheets of Latvia's MFIs, excluding Latvijas Banka (Table 7); 3) Consolidated balance sheet of MFIs, obtained by netting out inter-MFI positions on the aggregated MFI balance sheet (Table 8). Due to slight differences in accounting techniques, the sum of inter-MFI positions does not always equal zero; therefore, the balance is included in the item "Excess of inter-MFI liabilities"; 4) Monetary aggregates and counterparts (Table 4) comprise Latvia's monetary aggregates and their balance sheet counterparts derived from the consolidated balance sheet of MFIs. See Table 5 for seasonally adjusted monetary aggregates. When seasonally adjusting the time series, DEMETRA + Version 1.0.21605 of the programme is used. The following monetary aggregates are calculated and published: M1 – narrow monetary aggregate, comprising currency in circulation (the lats banknotes and coins issued by Latvijas Banka excluding vault cash of MFIs) plus overnight deposits in all currencies held with MFIs. M2 – intermediate monetary aggregate comprising M1 and deposits redeemable at a period of notice of up to and including 3 months (i.e. short-term savings deposits) made in all 94 Additional InformationMACROECONOMIC DEVELOPMENTS REPORT March 2014
  • 96. currencies and deposits with an agreed maturity of up to and including 2 years (i.e. short- term time deposits) in all currencies held with MFIs. M3 – broad monetary aggregate comprising M2, repurchase agreements, and debt securities with a maturity of up to and including 2 years issued by MFIs, and money market fund shares and units. In compliance with the methodology of Latvijas Banka, the monetary base (Table 3) and monetary survey (Table 10) is published. According to this methodology, the calculated monetary aggregates comprise the following: M0 – monetary base calculated on the basis of the methodology of Latvijas Banka and comprising the lats banknotes and coins issued by Latvijas Banka and demand deposits of resident MFIs and financial institutions (overnight deposits) with Latvijas Banka. M2X – broad money, comprising currency in circulation (the lats banknotes and coins issued by Latvijas Banka less vault cash of MFIs), MFI overnight deposits and time deposits in lats (including deposits redeemable at notice and repos), as well as foreign currency deposits with MFIs. M2X incorporate deposits made by local governments as a net item on the demand side. In view of the fact that Latvijas Banka collects more comprehensive information, the following is also published: 1) Aggregated balance sheet of Latvia's MFIs (excluding Latvijas Banka) which is the sum of the harmonised balance sheets (Tables 9ab); 2) Information characterising foreign assets and foreign liabilities of MFIs (excluding Latvijas Banka; Tables 11ab), including a breakdown of selected balance sheet items by country (Table 12); 3) Information characterising the maturity profile and types of deposits (including repos) of Latvia's financial institutions, non-financial corporations and households with MFIs (excluding Latvijas Banka; Tables 13 and 14abc) as well as Government and non-resident deposits (Table 14d). Deposits redeemable at notice have been grouped by period of notice. Long-term deposits include deposits with the original maturity of over 1 year. The breakdown of MFI (excluding Latvijas Banka) deposits by currency is provided in Tables 20ab; 4) Information characterising the maturity profile and types of MFI (excluding Latvijas Banka) loans to Latvia's financial institutions, non-financial corporations and households (Tables 15, 16ab, 17 and 18) as well as Government and non-resident loans (Table 16c). The breakdown of MFI (excluding Latvijas Banka) loans by currency is provided in Tables 20cd; 5) Information characterising MFI (excluding Latvijas Banka) securities holdings other than shares (Tables 19ab and 20ef); 6) Information characterising debt securities issued by MFIs (excluding Latvijas Banka; Table 20g). Interest rates In June 2010, Latvijas Banka introduced new methodology for interest rate statistics (see Latvijas Banka Regulation No. 42 "Regulation for Compiling Interest Rate Reports of Monetary Financial Institutions" of 10 September 2009). Using this methodology, credit institutions, branches of foreign credit institutions and particular credit unions registered 95 Additional InformationMACROECONOMIC DEVELOPMENTS REPORT March 2014
  • 97. in the Republic of Latvia have to provide information on interest rates on deposits and loans applied in transactions with resident non-financial corporations and households. Introduction of the new methodology enabled harmonisation of the interest rate statistics with the ECB requirements laid down in Regulation (EC) No. 290/2009 of the ECB of 31 March 2009 amending Regulation (EC) No. 63/2002 (ECB/2001/18) concerning statistics on interest rates applied by monetary financial institutions to deposits and loans vis-à-vis households and non-financial corporations (ECB/2009/7). The interest rate statistics provide considerably wider information on macroeconomic development and structural changes. Information on interest rates on deposits and loans applied in transactions with non-financial corporations and households provided by credit institutions, branches of foreign credit institutions and credit unions registered in the Republic of Latvia is collected (Table 21). Interest rate statistics is collected on new business and outstanding amounts. All rates included in the interest rate statistics are weighted average rates. When preparing the interest rate statistics, credit institutions use annualised agreed rates (AAR) or narrowly defined effective rates (NDER) and annual percentage rate of charge (APRC). Credit institutions have to select the calculation of the AAR or the NDER based on the terms and conditions of the agreement. The NDER can be calculated on any deposit or loan. In addition to the AAR or the NDER, the APRC is reported for loans to households for house purchase and consumer credits. The interest rates on new business with overnight deposits and deposits redeemable at notice and their outstanding amounts coincide. Interest rates on new loans are reported on the basis of the initial rate fixation period set in the agreement, whereas overdraft interest rates are reported on loan balances. When reporting the interest rates on consumer credit and other credit to households with the maturity of up to 1 year and loans to non-financial corporations with the maturity of up to 1 year, interest rates on overdraft are included. Interbank market lending interest rates (Table 23a) are reported as weighted average interest rates on new business, aggregating the information submitted by credit institutions, prepared based on the methodology of Latvijas Banka (see Latvijas Banka Regulation No. 46 "Regulation for Compiling the "Report on Money Market Transactions" of 5 November 2009.) Foreign exchange and exchange rates Information characterising the foreign currency selling and buying transactions is reported based on the methodology of Latvijas Banka (see Latvijas Banka Regulation No. 36 "Regulation for Purchasing and Selling Cash Foreign Currency" of 13 May 2009 and the Latvijas Banka Regulation No. 41 "Regulation for Compiling Reports on Foreign Currency Purchases and Sales" of 16 July 2009). The principal foreign exchange transactions (Table 24) comprise the cash and non-cash transactions conducted by credit institutions and branches of foreign credit institutions, reported by transaction type and counterparty, and currency. Non-cash foreign exchange transactions (Table 25) comprise non-cash transactions performed by credit institutions and branches of foreign credit institutions, reported by major currency. Exchange rates set by Latvijas Banka (Table 26) are reported as monthly mathematical averages. Weighted average exchange rates (cash transactions; Table 27) are reported based on the information provided by credit institutions and branches of foreign credit institutions as well as currency exchange bureaus. 96 Additional InformationMACROECONOMIC DEVELOPMENTS REPORT March 2014