GRAPHS OF TRIGONOMETRIC FUNCTIONS
GRAPH  OF  SINE  FUNCTION:   (y = sin x)   Properties of Sine Function Graph:1. The graph crosses the x-axis at the initial point, endpoint and midpoint of a cycle. These points are called the zeros of the function.2. A maximum occurs midway between the first two zeros in the cycle, and a minimum occurs between the last two zeros. The maximum and the minimum values are determined by the amplitude.
Note:The graph of y = sin x is periodic meaning the curve repeats itself at a regular interval.
The graph of the function through one period is called cycle. The period of sine function is        .
The amplitude represents the maximum variation of the curve from the x-axis. The amplitude of sine function is 1.Graph of  y = sin x:yxo
GRAPH  OF  COSINE  FUNCTION:   (y = cos x)   Properties of Cosine Function Graph:1. A maximum occurs at the initial point and the endpoint of the cycle. A minimum occurs midway in the cycle. The maximum and the minimum values are determined by the amplitude.2. The zeros of the function occur midway between the maximum and minimum.
Note:The graph of the cosine function has the same basic shape as y=sin x.
The graph is also periodic, with period       , and it has also an amplitude of 1. Graph of  y = cos x:yxo
Graph of y = a sin bxory = a cosbxFor y = a sin bxand y = a cosbx, the amplitude is      . The period is         . A negative sign before      inverts the graph. Multiplying the sine or cosine function by a constant changes only the amplitude and causes vertical stretch or compression of the basic graph.The maximum and the minimum values of the graph y = a sin bxand y = a cosbxareand      , respectively.
Graph of y = a sin b(x+c)+d ory = a cos b(x+c)+dFor  y = a sin b(x+c)+d  and  y = a cos b(x+c)+d, the amplitude is       and the period is         . The phase shift (horizontal shift) is cunits to left if c > 0, and cunits to the right if c < 0. The vertical shift is d units upward if d > 0, and d units downward if d < 0.
EXAMPLE:Determine the amplitude, period, phase shift and vertical shift of each function. Sketch the graph over the interval                           .
GRAPH  OF  TANGENT  AND COTANGENT FUNCTIONS:   The tangent function is discontinuous, since its graph has breaks. Asymptotes occur at these breaks. The amplitude is not defined because tanx increases or decreases without bound as x approaches the asymptotes. Since the tangent and cotangent functions are reciprocal functions, the value of cot xis undefined when tan x = 0, and it is zero when tan x is undefined.
Note:Tangent and cotangent functions has a period of     .
The complete graph of tangent function is    on the interval of                using the fact  	that tangent is periodic with period    .The complete graph of cotangent function is on the interval of          . Graph of  y = tan x:yxo
Graph of  y = cot x:yxo
GRAPH  OF  SECANT  AND COSECANT FUNCTIONS:   The graph of secant and cosecant functions are discontinuous and has asymptotes since secant and cosecant functions are not defined when the values of cosine and sine are equal to zero, respectively.The amplitude is not defined because the graph increases or decreases without bound as x approaches the asymptotes.
Note:Secant and cosecant functions has a period of        since both of them are the reciprocals of cosine and sine, respectively.
To graph the secant and cosecant functions,	we get the values by using the reciprocal	identities of                         and                       .
Graph of  y = sec x:yxo

More Related Content

PPT
Graphs of trigonometry functions
PPT
Graphing translations of trig functions
PPTX
Trigonometric functions
PPT
Lecture 15 section 5.4 graph of sin & cos
PPS
Trigonometric Functions and their Graphs
PPT
Drawing trigonometric graphs.
PPT
Lecture 16 graphing - section 4.3
PPT
Geometry unit 9.2
Graphs of trigonometry functions
Graphing translations of trig functions
Trigonometric functions
Lecture 15 section 5.4 graph of sin & cos
Trigonometric Functions and their Graphs
Drawing trigonometric graphs.
Lecture 16 graphing - section 4.3
Geometry unit 9.2

What's hot (20)

PPT
Geometry unit 9.4
PPT
Geometry unit 9.1
PPT
Trigonometric Function Of Any Angle
PPT
Integration Ppt
PPTX
Integration application (Aplikasi Integral)
PPT
Trigonometric graphs
PPT
Application of integral calculus
PPT
Algebra 2 unit 9.6
PPT
Trigonometry - Strand 3
PPTX
8 2 sine and cosine curves
PPTX
A1 3 linear fxns
PPT
Trigonometry functions of general angles reference angles
PPTX
A1 2 linear fxns
PPT
Lesson 11 plane areas area by integration
PPT
Algebra 2 unit 9.4.9.5
PPTX
Maths project for class 10 th
PDF
6.3 Graphs of Sine and Cosine
PPT
Trigonometric functions in standard position slide 1
DOCX
Triangulos rectangulos
PPT
Graphing day 2 worked
Geometry unit 9.4
Geometry unit 9.1
Trigonometric Function Of Any Angle
Integration Ppt
Integration application (Aplikasi Integral)
Trigonometric graphs
Application of integral calculus
Algebra 2 unit 9.6
Trigonometry - Strand 3
8 2 sine and cosine curves
A1 3 linear fxns
Trigonometry functions of general angles reference angles
A1 2 linear fxns
Lesson 11 plane areas area by integration
Algebra 2 unit 9.4.9.5
Maths project for class 10 th
6.3 Graphs of Sine and Cosine
Trigonometric functions in standard position slide 1
Triangulos rectangulos
Graphing day 2 worked
Ad

Viewers also liked (15)

PDF
Lesson 17: Inverse Trigonometric Functions
PDF
Inverse trigonometric functions
PPSX
Trigonometry review slide show
PPTX
Trigonometric (hayati pravita)
PPT
Trigonometric Functions Right Triangles
PPT
Section 6.2 trigonometric functions unit circle approach
PPTX
5.2.1 trigonometric functions
PPTX
Trigonometric functions - PreCalculus
PDF
Lesson 16: Inverse Trigonometric Functions (Section 021 slides)
PPTX
Sine and Cosine Functions Ppt
PPTX
Trigonometric function
PPTX
Introduction to trigonometry 
PPTX
PPT on Trigonometric Functions. Class 11
PPT
Trigonometry
PPT
Trigonometric Function Of Any Angle
Lesson 17: Inverse Trigonometric Functions
Inverse trigonometric functions
Trigonometry review slide show
Trigonometric (hayati pravita)
Trigonometric Functions Right Triangles
Section 6.2 trigonometric functions unit circle approach
5.2.1 trigonometric functions
Trigonometric functions - PreCalculus
Lesson 16: Inverse Trigonometric Functions (Section 021 slides)
Sine and Cosine Functions Ppt
Trigonometric function
Introduction to trigonometry 
PPT on Trigonometric Functions. Class 11
Trigonometry
Trigonometric Function Of Any Angle
Ad

Similar to Math12 lesson5 (20)

PPTX
Graphs of Circular Functions Presentation.pptx
PDF
Graphs of trigonometric exponential functions lecture
PPTX
Graphs of the Sine and Cosine Functions Lecture
PPT
Graphing Trig Functions-Tangent and Cotangent.ppt
PPT
Phase shift and amplitude of trigonometric functions
PPT
Graphs of the Trigonometric functions.ppt
PDF
Graphing trigonometric functions
PPT
Phase shift and amplitude of trigonometric
PDF
Module 4 circular function
PPTX
Graph of trigo diploma
PPT
MA2.pptglobalizarion on economic landscape
PPT
Algebra 2 unit 9.7
PPTX
Lesson no. 6 (Graphs of Sine and Cosine Functions)
PPTX
Unit 4.6
PPT
Trigonometry Functions
PPTX
Trigonometric Functions of Real Numbers - Masteral
PDF
New day 8 examples
PPTX
t5 graphs of trig functions and inverse trig functions
PPT
Trigo5_Graph of Sin and Cos.ppt
PDF
Day 8 examples u2w14
Graphs of Circular Functions Presentation.pptx
Graphs of trigonometric exponential functions lecture
Graphs of the Sine and Cosine Functions Lecture
Graphing Trig Functions-Tangent and Cotangent.ppt
Phase shift and amplitude of trigonometric functions
Graphs of the Trigonometric functions.ppt
Graphing trigonometric functions
Phase shift and amplitude of trigonometric
Module 4 circular function
Graph of trigo diploma
MA2.pptglobalizarion on economic landscape
Algebra 2 unit 9.7
Lesson no. 6 (Graphs of Sine and Cosine Functions)
Unit 4.6
Trigonometry Functions
Trigonometric Functions of Real Numbers - Masteral
New day 8 examples
t5 graphs of trig functions and inverse trig functions
Trigo5_Graph of Sin and Cos.ppt
Day 8 examples u2w14

More from dylanxclusive (9)

PPTX
Math12 lesson7
PPTX
Math12 lesson11
PPTX
Math12 lesson10
PPTX
Math12 lesson6
PPTX
Math12 lesson4
PPTX
Math12 lesson3
PPTX
Math12 lesson2
PPTX
Math12 (week 1)
PPTX
Math12 lesson9
Math12 lesson7
Math12 lesson11
Math12 lesson10
Math12 lesson6
Math12 lesson4
Math12 lesson3
Math12 lesson2
Math12 (week 1)
Math12 lesson9

Recently uploaded (20)

PDF
Fitaura: AI & Machine Learning Powered Fitness Tracker
PPTX
From XAI to XEE through Influence and Provenance.Controlling model fairness o...
PDF
TrustArc Webinar - Data Minimization in Practice_ Reducing Risk, Enhancing Co...
PPTX
Strategic Picks — Prioritising the Right Agentic Use Cases [2/6]
PDF
Human Computer Interaction Miterm Lesson
PDF
Decision Optimization - From Theory to Practice
PDF
NewMind AI Journal Monthly Chronicles - August 2025
PDF
Examining Bias in AI Generated News Content.pdf
PPTX
Report in SIP_Distance_Learning_Technology_Impact.pptx
PPTX
From Curiosity to ROI — Cost-Benefit Analysis of Agentic Automation [3/6]
PPTX
maintenance powerrpoint for adaprive and preventive
PPTX
Information-Technology-in-Human-Society (2).pptx
PDF
【AI論文解説】高速・高品質な生成を実現するFlow Map Models(Part 1~3)
PPTX
Presentation - Principles of Instructional Design.pptx
PPTX
How to use fields_get method in Odoo 18
PDF
Introduction to c language from lecture slides
PPTX
Information-Technology-in-Human-Society.pptx
PDF
Applying Agentic AI in Enterprise Automation
PDF
Child-friendly e-learning for artificial intelligence education in Indonesia:...
PPTX
Slides World Game (s) Great Redesign Eco Economic Epochs.pptx
Fitaura: AI & Machine Learning Powered Fitness Tracker
From XAI to XEE through Influence and Provenance.Controlling model fairness o...
TrustArc Webinar - Data Minimization in Practice_ Reducing Risk, Enhancing Co...
Strategic Picks — Prioritising the Right Agentic Use Cases [2/6]
Human Computer Interaction Miterm Lesson
Decision Optimization - From Theory to Practice
NewMind AI Journal Monthly Chronicles - August 2025
Examining Bias in AI Generated News Content.pdf
Report in SIP_Distance_Learning_Technology_Impact.pptx
From Curiosity to ROI — Cost-Benefit Analysis of Agentic Automation [3/6]
maintenance powerrpoint for adaprive and preventive
Information-Technology-in-Human-Society (2).pptx
【AI論文解説】高速・高品質な生成を実現するFlow Map Models(Part 1~3)
Presentation - Principles of Instructional Design.pptx
How to use fields_get method in Odoo 18
Introduction to c language from lecture slides
Information-Technology-in-Human-Society.pptx
Applying Agentic AI in Enterprise Automation
Child-friendly e-learning for artificial intelligence education in Indonesia:...
Slides World Game (s) Great Redesign Eco Economic Epochs.pptx

Math12 lesson5

  • 2. GRAPH OF SINE FUNCTION: (y = sin x) Properties of Sine Function Graph:1. The graph crosses the x-axis at the initial point, endpoint and midpoint of a cycle. These points are called the zeros of the function.2. A maximum occurs midway between the first two zeros in the cycle, and a minimum occurs between the last two zeros. The maximum and the minimum values are determined by the amplitude.
  • 3. Note:The graph of y = sin x is periodic meaning the curve repeats itself at a regular interval.
  • 4. The graph of the function through one period is called cycle. The period of sine function is .
  • 5. The amplitude represents the maximum variation of the curve from the x-axis. The amplitude of sine function is 1.Graph of y = sin x:yxo
  • 6. GRAPH OF COSINE FUNCTION: (y = cos x) Properties of Cosine Function Graph:1. A maximum occurs at the initial point and the endpoint of the cycle. A minimum occurs midway in the cycle. The maximum and the minimum values are determined by the amplitude.2. The zeros of the function occur midway between the maximum and minimum.
  • 7. Note:The graph of the cosine function has the same basic shape as y=sin x.
  • 8. The graph is also periodic, with period , and it has also an amplitude of 1. Graph of y = cos x:yxo
  • 9. Graph of y = a sin bxory = a cosbxFor y = a sin bxand y = a cosbx, the amplitude is . The period is . A negative sign before inverts the graph. Multiplying the sine or cosine function by a constant changes only the amplitude and causes vertical stretch or compression of the basic graph.The maximum and the minimum values of the graph y = a sin bxand y = a cosbxareand , respectively.
  • 10. Graph of y = a sin b(x+c)+d ory = a cos b(x+c)+dFor y = a sin b(x+c)+d and y = a cos b(x+c)+d, the amplitude is and the period is . The phase shift (horizontal shift) is cunits to left if c > 0, and cunits to the right if c < 0. The vertical shift is d units upward if d > 0, and d units downward if d < 0.
  • 11. EXAMPLE:Determine the amplitude, period, phase shift and vertical shift of each function. Sketch the graph over the interval .
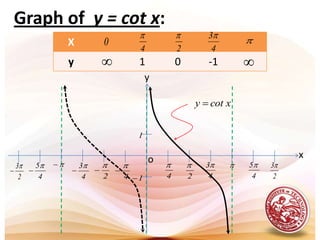
  • 12. GRAPH OF TANGENT AND COTANGENT FUNCTIONS: The tangent function is discontinuous, since its graph has breaks. Asymptotes occur at these breaks. The amplitude is not defined because tanx increases or decreases without bound as x approaches the asymptotes. Since the tangent and cotangent functions are reciprocal functions, the value of cot xis undefined when tan x = 0, and it is zero when tan x is undefined.
  • 13. Note:Tangent and cotangent functions has a period of .
  • 14. The complete graph of tangent function is on the interval of using the fact that tangent is periodic with period .The complete graph of cotangent function is on the interval of . Graph of y = tan x:yxo
  • 15. Graph of y = cot x:yxo
  • 16. GRAPH OF SECANT AND COSECANT FUNCTIONS: The graph of secant and cosecant functions are discontinuous and has asymptotes since secant and cosecant functions are not defined when the values of cosine and sine are equal to zero, respectively.The amplitude is not defined because the graph increases or decreases without bound as x approaches the asymptotes.
  • 17. Note:Secant and cosecant functions has a period of since both of them are the reciprocals of cosine and sine, respectively.
  • 18. To graph the secant and cosecant functions, we get the values by using the reciprocal identities of and .
  • 19. Graph of y = sec x:yxo
  • 20. Graph of y = csc x:yxo
  • 21. EXAMPLE:Determine the amplitude, period, phase shift and vertical shift of each function. Sketch the graph over a two period interval. .

Editor's Notes