MS Excel is a spreadsheet program used to store and manipulate data in rows and columns divided into cells using worksheets, allowing users to easily write equations and functions. Excel has numerous functions, formulas, shortcuts, and tools that increase its usefulness for accounting, business, and other tasks. The Excel interface includes ribbons, tabs, groups, command buttons, and other components to access its various capabilities.
Microsoft Excel is a spreadsheet application developed by Microsoft for creating and formatting spreadsheets. Spreadsheets allow information to be organized in rows and columns and analyzed using automatic mathematics. Excel workbooks can contain multiple worksheets which are made up of a grid of cells organized into rows and columns where data can be stored and analyzed using formulas. Excel offers various features for working with spreadsheets including formatting options, functions, charts and more.
This document provides an overview of using Microsoft Excel spreadsheets and worksheets. It discusses key concepts like rows, columns, cells and how data is entered and organized on a worksheet. It also covers common Excel functions like formatting text and cells, changing fonts, filling cells with color, navigating between cells and worksheets, saving workbook files, and using tools on the ribbon like Paste Special. The document is intended as a tutorial or guide for basic and introductory use of Microsoft Excel.
This document provides an overview of topics that will be covered in a Microsoft Excel training course, including basic and advanced features. The main goals of the course are to help professionals enhance their Excel skills through hands-on exercises and practice with techniques ranging from basic functions to more powerful tools like pivot tables, macros, and statistical/graphing functions. Mastering these Excel skills will allow delegates to more efficiently manage and analyze worksheet data.
Spreadsheets allow users to organize and calculate data. Key features include the ability to create and modify workbooks containing multiple worksheets with rows and columns. Worksheets can contain numbers, formulas, and functions to automatically calculate values. Common spreadsheet programs like Microsoft Excel allow users to format and visualize data through graphs and charts.
Microsoft Excel is a spreadsheet program created by Microsoft that allows users to organize, format, and calculate data. It has tools like pivot tables, graphs, formulas, and macros to help users analyze information. Excel allows data analysts to easily examine and update data. Key parts of Excel include active cells, columns, rows, fill handles, address bars, formula bars, title bars, menus, toolbars, ribbons, worksheet tabs, and status bars. Important Excel formulas include SUM, AVERAGE, COUNT, and VLOOKUP to calculate and look up values.
This document provides an overview of useful features in Excel including formulas, functions, columns, rows, cells, data types, basic math functions, the SUM, AVERAGE, MAX, MIN, COUNT, IF, and CONCATENATE functions, text to columns, removing duplicates, instantly revealing formulas, comparing multiple spreadsheets, sorting, filtering, creating and using tables, freezing headers, setting print areas, narrowing margins, shrinking to fit, pivot tables, and cell referencing. Key features allow for calculations, analysis, and manipulation of data in spreadsheets.
This document defines a spreadsheet and its purpose. It begins by stating that a spreadsheet is a program that organizes data into rows and columns to perform operations on numerical data easily. Examples are given of where spreadsheets can be used, such as for statistics, budgeting, and keeping accounts. The elements of the Excel window like the title bar, menu bar, and worksheet tabs are identified. Finally, it describes the basic components of a spreadsheet including rows, columns, cells, and the different types of information - like labels, values, and formulas - that can be entered into cells.
This document defines key terms related to the Excel user interface and workbooks. It describes:
1) The main components of the Excel interface including the title bar, menus, toolbars, worksheet, cells, and sheet tabs.
2) How workbooks contain worksheets made up of columns and rows that intersect to form cells.
3) How to navigate within and between worksheets using keyboard shortcuts, scroll bars, and sheet tabs.
This document provides an overview of key Excel terminology and functions. It defines a spreadsheet and gives examples of common uses. It also identifies the main elements of the Excel window and spreadsheet basics like rows, columns, cells, labels, values and formulas. Finally, it explains how to navigate within a spreadsheet and format cells. The goal is to help users understand Excel at a foundational level.
This document provides an introduction and overview of Microsoft Excel. It discusses key aspects of Excel including its use as a spreadsheet program to record and analyze numerical data in columns and rows. It describes the Office button, formatting text, inserting rows and columns, sorting and editing data, using formulas and functions, and some shortcut keys.
The spreadsheet consists of rows and columns that allow you to create, edit, and save data. A worksheet is a single sheet of cells in Excel, with a default of 3 worksheets per new workbook. The workbook stores the worksheets and holds important data. Cells are the rectangular areas where data is entered and displayed, identified by their column letter and row number references. Formulas and functions, which begin with an equals sign, are used to perform calculations within cells. The ribbon displays tabs that provide formatting and functionality options in Excel.
Microsoft Excel is a spreadsheet program that allows users to enter, organize, and analyze data. It maintains records relating to finances, products, activities, events, and services. Excel workbooks contain individual worksheets made up of cells organized into rows and columns. Formulas can be used to perform calculations with cell values. Navigation between cells can be done using the mouse, keyboard shortcuts, or by entering cell references.
This document is a handbook for basic Excel tasks. It contains 4 parts that cover background information, Excel 101 tasks, formatting and appearance, and tips for working efficiently. Key topics include Excel terminology, inserting and deleting rows and columns, formatting cells, sorting data, adding headers and footers, and printing options. The handbook is intended as a reference for users who will view and print Excel reports.
The document provides an overview of key features in Microsoft Excel 2007, including spreadsheets, the ribbon interface, formulas, charts, and other formatting and analysis tools. It describes spreadsheet components like workbooks, worksheets, and cells. It explains the ribbon tabs and groups that contain formatting and function tools. It also provides instructions for common tasks like entering formulas, creating charts, formatting cells and text, hiding and arranging worksheets, and printing worksheets.
Handout used by the Westerville Public Library for the Introduction to Excel 2007 class. Provides basic information about creating a spreadsheet using Microsoft Excel 2007.
This document provides an overview of key Excel features and functions for formatting worksheets, entering and editing data, printing worksheets, and more. It discusses topics like the Excel interface, creating and saving workbooks/worksheets, inserting and deleting rows/columns, formatting cells and worksheets, using auto-fill, and printing options for worksheets or the entire workbook. The document is intended as a basic introduction and reference for common Excel tasks.
This document provides an overview of key Excel features and functions for formatting worksheets, entering and editing data, printing worksheets, and more. It discusses topics like the Excel interface, creating and saving workbooks/worksheets, inserting and deleting rows/columns, formatting cells and worksheets, using auto-fill, and printing options for worksheets or selections. The document is intended as a basic introduction and reference for common Excel tasks.
This document provides an overview of an Excel training course. The course covers the Excel environment and interface, including tabs, ribbons, cells and worksheets. It outlines the modules and chapters to be covered, such as working with formulas and functions, formatting cells, printing, and more. The training will help participants learn how to navigate, enter and edit data, select cells, save and print workbooks, and adjust Excel settings.
This document provides an overview of Microsoft Excel. It discusses that Excel is a spreadsheet application used to organize data into tables and perform calculations. Key points covered include:
- Excel uses a grid of rows and columns to display data in worksheets.
- Common tasks in Excel include entering data, formatting cells, adjusting worksheet layout, printing, using formulas and functions, and creating charts and pivot tables.
- Advanced features include conditional formatting, comments, grouping worksheets, and sharing workbooks with other users.
Book industry standards are evolving rapidly. In the first part of this session, we’ll share an overview of key developments from 2024 and the early months of 2025. Then, BookNet’s resident standards expert, Tom Richardson, and CEO, Lauren Stewart, have a forward-looking conversation about what’s next.
Link to recording, presentation slides, and accompanying resource: https://bnctechforum.ca/sessions/standardsgoals-for-2025-standards-certification-roundup/
Presented by BookNet Canada on May 6, 2025 with support from the Department of Canadian Heritage.
Artificial Intelligence is providing benefits in many areas of work within the heritage sector, from image analysis, to ideas generation, and new research tools. However, it is more critical than ever for people, with analogue intelligence, to ensure the integrity and ethical use of AI. Including real people can improve the use of AI by identifying potential biases, cross-checking results, refining workflows, and providing contextual relevance to AI-driven results.
News about the impact of AI often paints a rosy picture. In practice, there are many potential pitfalls. This presentation discusses these issues and looks at the role of analogue intelligence and analogue interfaces in providing the best results to our audiences. How do we deal with factually incorrect results? How do we get content generated that better reflects the diversity of our communities? What roles are there for physical, in-person experiences in the digital world?
Noah Loul Shares 5 Steps to Implement AI Agents for Maximum Business Efficien...Noah Loul
Artificial intelligence is changing how businesses operate. Companies are using AI agents to automate tasks, reduce time spent on repetitive work, and focus more on high-value activities. Noah Loul, an AI strategist and entrepreneur, has helped dozens of companies streamline their operations using smart automation. He believes AI agents aren't just tools—they're workers that take on repeatable tasks so your human team can focus on what matters. If you want to reduce time waste and increase output, AI agents are the next move.
Technology Trends in 2025: AI and Big Data AnalyticsInData Labs
At InData Labs, we have been keeping an ear to the ground, looking out for AI-enabled digital transformation trends coming our way in 2025. Our report will provide a look into the technology landscape of the future, including:
-Artificial Intelligence Market Overview
-Strategies for AI Adoption in 2025
-Anticipated drivers of AI adoption and transformative technologies
-Benefits of AI and Big data for your business
-Tips on how to prepare your business for innovation
-AI and data privacy: Strategies for securing data privacy in AI models, etc.
Download your free copy nowand implement the key findings to improve your business.
Procurement Insights Cost To Value Guide.pptxJon Hansen
Procurement Insights integrated Historic Procurement Industry Archives, serves as a powerful complement — not a competitor — to other procurement industry firms. It fills critical gaps in depth, agility, and contextual insight that most traditional analyst and association models overlook.
Learn more about this value- driven proprietary service offering here.
Massive Power Outage Hits Spain, Portugal, and France: Causes, Impact, and On...Aqusag Technologies
In late April 2025, a significant portion of Europe, particularly Spain, Portugal, and parts of southern France, experienced widespread, rolling power outages that continue to affect millions of residents, businesses, and infrastructure systems.
IT help desk outsourcing Services can assist with that by offering availability for customers and address their IT issue promptly without breaking the bank.
AI Changes Everything – Talk at Cardiff Metropolitan University, 29th April 2...Alan Dix
Talk at the final event of Data Fusion Dynamics: A Collaborative UK-Saudi Initiative in Cybersecurity and Artificial Intelligence funded by the British Council UK-Saudi Challenge Fund 2024, Cardiff Metropolitan University, 29th April 2025
https://alandix.com/academic/talks/CMet2025-AI-Changes-Everything/
Is AI just another technology, or does it fundamentally change the way we live and think?
Every technology has a direct impact with micro-ethical consequences, some good, some bad. However more profound are the ways in which some technologies reshape the very fabric of society with macro-ethical impacts. The invention of the stirrup revolutionised mounted combat, but as a side effect gave rise to the feudal system, which still shapes politics today. The internal combustion engine offers personal freedom and creates pollution, but has also transformed the nature of urban planning and international trade. When we look at AI the micro-ethical issues, such as bias, are most obvious, but the macro-ethical challenges may be greater.
At a micro-ethical level AI has the potential to deepen social, ethnic and gender bias, issues I have warned about since the early 1990s! It is also being used increasingly on the battlefield. However, it also offers amazing opportunities in health and educations, as the recent Nobel prizes for the developers of AlphaFold illustrate. More radically, the need to encode ethics acts as a mirror to surface essential ethical problems and conflicts.
At the macro-ethical level, by the early 2000s digital technology had already begun to undermine sovereignty (e.g. gambling), market economics (through network effects and emergent monopolies), and the very meaning of money. Modern AI is the child of big data, big computation and ultimately big business, intensifying the inherent tendency of digital technology to concentrate power. AI is already unravelling the fundamentals of the social, political and economic world around us, but this is a world that needs radical reimagining to overcome the global environmental and human challenges that confront us. Our challenge is whether to let the threads fall as they may, or to use them to weave a better future.
HCL Nomad Web – Best Practices und Verwaltung von Multiuser-Umgebungenpanagenda
Webinar Recording: https://www.panagenda.com/webinars/hcl-nomad-web-best-practices-und-verwaltung-von-multiuser-umgebungen/
HCL Nomad Web wird als die nächste Generation des HCL Notes-Clients gefeiert und bietet zahlreiche Vorteile, wie die Beseitigung des Bedarfs an Paketierung, Verteilung und Installation. Nomad Web-Client-Updates werden “automatisch” im Hintergrund installiert, was den administrativen Aufwand im Vergleich zu traditionellen HCL Notes-Clients erheblich reduziert. Allerdings stellt die Fehlerbehebung in Nomad Web im Vergleich zum Notes-Client einzigartige Herausforderungen dar.
Begleiten Sie Christoph und Marc, während sie demonstrieren, wie der Fehlerbehebungsprozess in HCL Nomad Web vereinfacht werden kann, um eine reibungslose und effiziente Benutzererfahrung zu gewährleisten.
In diesem Webinar werden wir effektive Strategien zur Diagnose und Lösung häufiger Probleme in HCL Nomad Web untersuchen, einschließlich
- Zugriff auf die Konsole
- Auffinden und Interpretieren von Protokolldateien
- Zugriff auf den Datenordner im Cache des Browsers (unter Verwendung von OPFS)
- Verständnis der Unterschiede zwischen Einzel- und Mehrbenutzerszenarien
- Nutzung der Client Clocking-Funktion
Web & Graphics Designing Training at Erginous Technologies in Rajpura offers practical, hands-on learning for students, graduates, and professionals aiming for a creative career. The 6-week and 6-month industrial training programs blend creativity with technical skills to prepare you for real-world opportunities in design.
The course covers Graphic Designing tools like Photoshop, Illustrator, and CorelDRAW, along with logo, banner, and branding design. In Web Designing, you’ll learn HTML5, CSS3, JavaScript basics, responsive design, Bootstrap, Figma, and Adobe XD.
Erginous emphasizes 100% practical training, live projects, portfolio building, expert guidance, certification, and placement support. Graduates can explore roles like Web Designer, Graphic Designer, UI/UX Designer, or Freelancer.
For more info, visit erginous.co.in , message us on Instagram at erginoustechnologies, or call directly at +91-89684-38190 . Start your journey toward a creative and successful design career today!
Social Media App Development Company-EmizenTechSteve Jonas
EmizenTech is a trusted Social Media App Development Company with 11+ years of experience in building engaging and feature-rich social platforms. Our team of skilled developers delivers custom social media apps tailored to your business goals and user expectations. We integrate real-time chat, video sharing, content feeds, notifications, and robust security features to ensure seamless user experiences. Whether you're creating a new platform or enhancing an existing one, we offer scalable solutions that support high performance and future growth. EmizenTech empowers businesses to connect users globally, boost engagement, and stay competitive in the digital social landscape.
This is the keynote of the Into the Box conference, highlighting the release of the BoxLang JVM language, its key enhancements, and its vision for the future.
Designing Low-Latency Systems with Rust and ScyllaDB: An Architectural Deep DiveScyllaDB
Want to learn practical tips for designing systems that can scale efficiently without compromising speed?
Join us for a workshop where we’ll address these challenges head-on and explore how to architect low-latency systems using Rust. During this free interactive workshop oriented for developers, engineers, and architects, we’ll cover how Rust’s unique language features and the Tokio async runtime enable high-performance application development.
As you explore key principles of designing low-latency systems with Rust, you will learn how to:
- Create and compile a real-world app with Rust
- Connect the application to ScyllaDB (NoSQL data store)
- Negotiate tradeoffs related to data modeling and querying
- Manage and monitor the database for consistently low latencies
Designing Low-Latency Systems with Rust and ScyllaDB: An Architectural Deep DiveScyllaDB
Ad
Microsoft Excel Essentials: A Beginner's Guide
2. What is Microsoft Excel?
•Excel is a spreadsheet program from Microsoft
and a component of its Office product group for
business applications. Microsoft Excel enables
users to format, organize and calculate data in a
spreadsheet.
3. History and future of Excel
•Microsoft released Excel in 1985 under the name
Microsoft Multiplan. Microsoft's spreadsheet
program competed with similar products at the
time, including Lotus 1-2-3 from the Lotus
Development Corp.
4. •The Title bar section has window controls at the
right end, as in other Microsoft Office programs.
•The Quick Access Toolbar is located all the way to
the left on the title bar. It contains frequently
used commands and can be customized using the
drop-down menu.
•The Ribbon contains all of the tools that you use
to interact with your Microsoft Excel file. The
ribbon has a number of tabs, each of which
contains buttons, which are organized into
groups.
5. •Contextual tabs are displayed when certain
objects, such as images and charts, are selected.
They contain additional options for modifying
the object.
•the File tab provides a Backstage view of your
document. Backstage view gives you various
options for saving, opening a file, printing, or
sharing your document.
7. Parts of the Excel window
•Name Box – Displays the current selected cell.
•Formula Bar – Displays the number, text, or
formula that is in the currently selected cell, and
allows you to edit it. It behaves just like a text
box.
•Selected Cell – The selected cell has a dark
border around it.
8. Parts of the Excel window
•Column – Columns run vertically (top to
bottom).
•Column Label – Identifies each column with a
letter. Clicking on a column label selects the
entire column.
•Row – Rows run horizontally (left to right).
•Row Label – Identifies each row with a number.
Clicking on a row label selects the entire row.
9. Parts of the Excel window
•Cell – The intersection of a row and column.
•Worksheets – The worksheets contained in a
workbook are displayed at the bottom-left of the
screen.
•Scroll Bars – Used to view other parts of a
worksheet when the entire worksheet cannot fit
on the screen.
11. Status Bar (left end)
•The left end gives current information about the
spreadsheet.
•When "Ready" appears on the left side of the
Excel status bar, it indicates that the active cell is
ready to receive input or perform actions.
12. Status Bar (right end)
•At the right end are shortcuts to the different
views that are available. Each view displays the
spreadsheet in a different way, allowing you to
carry out various tasks more efficiently.
13. Views
•Normal – It simply displays the grid of cells that
make up your spreadsheet.
•Page Layout – Show what your spreadsheet will
look like when printed on paper.
•Page Break Preview – Allows you to add page
breaks to your spreadsheets so you can better
control what parts of the spreadsheets are
printed on each page.
17. Zoom Slider
•Also at the right end of the Status Bar is the
Zoom Slider. This allows you to adjust how large
the spreadsheet is displayed on the screen. It
does not adjust the actual size of the text – jus
how big or small they are rendered on the
screen.
18. Understanding Workbooks
•In Microsoft Excel the data you enter, whether it
consists of numbers, text, or formulas, is stored
in a file known as a workbook. Workbooks are
just like huge electronic books with pages (or
sheets) that have been ruled into columns and
rows.
19. Understanding Workbooks
•A worksheet (or page) in a workbook contains
16,384 columns that are labelled using letters of
the alphabet. The first column in a worksheet is
labelled column A, while the last is labelled XFD.
21. Understanding Workbooks
•Where a column and row intersect we get what
is known as a cell. You enter your data into these
cells. Each cell in a worksheet can hold up to
32,767 characters. Cells are referred to by their
column and row labels.
22. Cell Address
•For example, the cell we are pointing to is B2 –
this reference is known as the cell address and is
most important as it is frequently used in
commands and formulas.
23. Active Cell
•When the Status Bar show Ready mode, at least
one cell in the worksheet will be highlighted –
this is known as the active cell. You can have
more than active cell – when this occurs you
have what is known as a range.
24. Worksheets
•A workbook is made up of pages known as
worksheets. You can have as many sheets in a
workbook as your computer resources can
accommodate.
•Add new Worksheet
25. Navigating in a File
•Arrow Keys – Move one cell to the right, left, up
or down.
•Tab – Move one cell to the right
•Ctrl+Home – To beginning file
•Ctrl+End – To end of typed information
•Home – Beginning of a line
•End – End of a line
26. Navigating in a File
•Page Down – Down one screen
•Page Up – Up one screen
•F5 – To a specific page
•Scroll bars – Appear at the right and on the
bottom of the screen. You may click the scroll
arrows, drag the scroll box or click the scroll bar
to move through the document.
27. Filling a Series
•A series refers to a sequence of ordered entries
in adjacent cells, such as days of the week or
months of the year.
•The fill technique can be used to create these in
a worksheet for you, reducing the amount of
time taken for data entry, and ensuring that the
spelling is correct.
28. Filling a Series
•Excel provides days and months as special built-
in series that you can access.
To fill a series:
1. Click on the first cell in the series
2. Drag from the fill handle across as many
columns as required
29. Filling a Series
•As you drag the fill handle across, a tool tip
appears below the fill pointer displaying the
current value in the series. This is really handy
when you want to end on particular month, day
or value.
33. Freezing Rows and Columns
•When you lay out your data in rows and
columns, it is most likely that your headings end
up at the top or to the left of your data, if you
have a large amount of data, you may find that
when you scroll across or down to particular
cells, the headings scroll out of view. This
problem can be resolved by freezing the rows
and/or columns that hold the headings.
34. Freezing Rows and Columns
•When you lay out your data in rows and
columns, it is most likely that your headings end
up at the top or to the left of your data, if you
have a large amount of data, you may find that
when you scroll across or down to particular
cells, the headings scroll out of view. This
problem can be resolved by freezing the rows
and/or columns that hold the headings.
35. Freezing Rows and Columns
•To freeze panes in a worksheet:
1. Click in the cell below and to the right of the
area you want to freeze/unfreeze
2. Click on the view tab
3. Click on Freeze Panes in the Window group,
the select Freeze Panes
36. What is Conditional Formatting?
•Conditional formatting is feature in Microsoft
Excel that allows you to apply specific formatting
to your cells according to certain criteria.
•It enables you to make sense of your data and
spot significant trends.
39. Data Bars
• Data Bars in Excel are an
inbuilt type of conditional
formatting that inserts
colored bars inside a cell to
show how a given cell value
compares to others.
41. Color Scales
• A Color Scale is a
sequence of smoothly
changing colors that
represent smaller and
larger values.
43. Icon Sets
• Icon Sets in Excel are ready-
to-use formatting options
that add various icons to
cells, such as arrows, shapes,
check marks, flags, rating
stars, etc. to visually show
how cell values in a range
are compared to each other.
46. What is Excel Formula?
•In Microsoft Excel, a formula is an expression
that operates on values in a range of cells.
•Excel formulas enable you to perform
calculations such as addition, subtraction,
multiplication, and division.
47. Function
•The two words, “formulas” and “functions”
are sometimes interchangeable.
•They are closely related, but yet different.
•A formula begins with an equal sign.
Meanwhile, functions are used to perform
complex calculations that cannot be done
manually.
49. Excel Formulas and Functions
1. SUM
The SUM() function, as the name suggests,
gives the total of the selected range of cell
values. It performs the mathematical operation
which is addition.
=SUM(number 1, [number 2],…)
50. Excel Formulas and Functions
2. AVERAGE
The AVERAGE() function focuses on calculating
the average of the selected range of cell values.
=AVERAGE(number 1, [number 2],…)
51. Excel Formulas and Functions
3. COUNT
The function COUNT() counts the total number
of cells in a range that contains a number. It
does not include the cell, which is blank, and
the ones that hold data in any other format
apart from numeric.
=COUNT(value 1, [value 2],…)
52. Excel Formulas and Functions
4. COUNTA
The COUNTA() function is a premade function
in Excel, which counts cells in a range that has
values, both numbers and letters.
=COUNTA(value 1, [value 2],…)
53. Excel Formulas and Functions
5. COUNTBLANK
The COUNTBLANK() function is a premade
function in Excel, which counts blank cells in a
range.
=COUNTBLANK(range)
54. Excel Formulas and Functions
6. SUBTOTAL
The SUBTOTAL() function returns the subtotal in
a database. Depending on what you want to
select either Average, Count, Sum, Min, Max,
and others.
=SUBTOTAL(function_num,ref1,[ref2],…)
=SUBTOTAL(1,A2:A4)
55. Excel Formulas and Functions
7. MODULUS
The MOD() function works on returning the
remainder when a particular number is divided
by a divisor.
=MOD(number,divisor)
=MOD(A2,3)
56. Excel Formulas and Functions
8. POWER
The function POWER() returns the result of a
number raised to a certain power.
=POWER(number,power)
=POWER(A2,3)
57. Excel Formulas and Functions
9. CEILING
The CEILING() function rounds a number up to
its nearest multiple significance.
=CEILING(number,significance)
58. Excel Formulas and Functions
10. FLOOR
Contrary to the Ceiling function, the floor
function rounds a number down to the nearest
multiple of significance.
=FLOOR(number,significance)
59. Excel Formulas and Functions
11. CONCATENATE
This function merges or joins several text
strings into one text string.
=CONCATENATE(text1, [text2],…)
60. Excel Formulas and Functions
12. LEN
The function LEN() returns the total number of
characters in a string. So, it will count the
overall characters, including spaces and special
characters.
=CONCATENATE(text1, [text2],…)
62. Merge and Center
•Combine and center the contents of the
selected cells in a new larger cell
•This is a great way to create labels that spans
multiple columns.
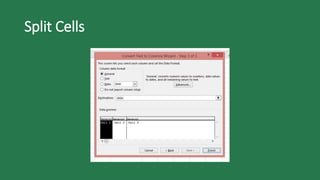
65. Split Cells
Data > Data Tools > Text to Columns
•Split a single column of text into multiple
columns.
•You can choose how to split it up: fixed width
or split at each comma, period, or other
character.