Modeling System Requirements
Download as PPT, PDF3 likes6,877 views

This document discusses modeling system requirements using traditional and object-oriented approaches, highlighting the importance of models such as data flow diagrams and various types of models like mathematical and graphical representations. It outlines reasons for modeling, including reducing complexity, facilitating communication, and documenting for future maintenance. Additionally, it emphasizes classifying system requirements based on events and entities, illustrating their relationships, attributes, and types through various modeling techniques.


![7
79
+int
9(4)
+9(6).99
String[50]](https://image.slidesharecdn.com/chap4-150913065007-lva1-app6892/85/Modeling-System-Requirements-79-320.jpg)


Modeling System Requirements
- 1. 7 1 Chapter 4. Modeling System Requirements (~20/30 marks)
- 2. 7 4.1 Traditional Approach to Requirement: Data Flow Diagrams, Documentation of DFD Components, Information Engineering Models 4.2 Object-Oriented Approach to Requirement: Object- Oriented Requirements, The System Activities, identifying Input and Outputs, Identifying Object Behavior, Integrating Object-Oriented Models. 4.3 Evaluating Alternatives for requirements, Environment and Implementation 2
- 3. 7 3 Models and Modeling A model: a representation of some aspect of the system being built A variety of models Many are graphical (e.g. Data flow diagram, ER diagram) Can show different levels of detail Some focus on data Some focus on processing Purpose: creating a model can help clarify and refine the design Developing the model raises questions that need to be considered Models help to simplify complex aspects of systems
- 4. 7 4 Reasons for Modeling Learning from the modeling process New pieces are found to be needed New questions arise that need to be answered to complete the model Reducing complexity by abstraction Systems can be complex and intangible Models of parts of the system help to clarify and focus on important aspects Remembering all of the details Models are a way of storing information for later use in a form that can be digested (e.g. A picture can say a lot)
- 5. 7 5 Reasons for Modeling (cont.) Communicating with other development team members Can show others aspects of the system in a succinct(briefly and clearly expressed) way Support communication – e.g. someone working on inputs and outputs can use the model to communicate with someone working on processing details Communicating with a variety of users and stakeholders Users need to see clear and complete models to understand what the analyst is proposing Users often work with analyst to create models (this process can help users better understand what the system can do)
- 6. 7 6 Reasons for modeling (cont.) Documenting what was done for future maintenance/enhancement Critical development team leaves behind a record of what was created Need to package everything in a form future developers can understand and use when they modify and update the system Much of the documentation consists of models (e.g. diagrammatic) as text mentions – also much of documentation also consists of textual reports
- 7. 7 7 Types of Models Mathematical model: a series of formulas that describe technical aspects of a system Ex: R=r1, r2, ..., rn ; S= s1, s2, ..., sn ; there is a relation {(ri,sj) | ∀ ri є R ∃ sj є S } Comfortable for scientific or engineering applications Sometimes used in business systems – e.g. simple formula for payroll where you model gross pay as regular pay plus overtime pay Descriptive model: narrative memos, reports, or lists that describe some aspect of the system E.g. might jot down notes from interviewing a user Users may describe what they do in reports or memos Analyst can then convert these descriptions to a modeling notation
- 8. 7 8 Types of Models (cont.) Sometimes narratives are the best way for recording information Simple lists of features, inputs, outputs, events or users are examples A very important form of narrative model: writing a procedure in a very precise way – structured English or pseudocode Pseudocode used a lot by programmers, can also be used to describe procedures during earlier phases Example of Pseudocode description of a payroll function: 1. Input the employees payroll data 2. If hours worked is greater than 40 then calculate overtime pay 3. Calculate gross pay for the employee - Gross Pay = hourly pay times 40 plus overtime 4. Calculate tax for the employee ETC.
- 9. 7 9
- 10. 7 10 Types of Models (cont.) Graphical Model: diagrams and schematic representations of some aspect of a system Easy to understand complex relationships (old saying: a picture is worth a thousand words) Graphical models may look similar to a real-world part of the system (e.g. a screen design or report layout) But often represent more abstract things, e.g. processes, data, objects, messages, connections Key graphical models tend to represent abstract aspects of a system during Analysis Phase The more concrete models (e.g. screen design) tend to appear later in the Design Phase
- 11. 7 11 Notes on graphical models Many different types and formats Variations in notation However, still based on basic symbols Circle Square Rectangle line
- 12. 7 12 Models used in the Analysis Phase The analysis phase named “Define System Requirements” involves creating models logical models (define what is required without committing to one specific technology) Many different types of formalisms for defining logical models
- 13. 7 13
- 14. 7 14 Models used in the Design Phase These are physical models – since will be implemented with a specific technology Some are extensions of requirements models created during systems analysis Some may be used during both analysis and design (e.g. object-oriented class diagram)
- 15. 7 15
- 16. 7 16 Events and System Requirements Two key concepts to model: Events Things Event – an occurrence at a specific time and place, that can be described and is worth remembering E.g. customer placing an order, shipping identifies a backorder, nuclear reactor goes to meltdown When defining system requirements it is useful to begin by asking what events occur that will affect the system being studied What events will occur that the system will have to
- 17. 7 17 Events (cont.) Also allows you to focus on the interfaces of the system to outside people and systems End users can easily describe system needs in terms of events that affect their work, very useful when working with users Gives a way to divide (or decompose) the system requirements so you can study each separately (complex systems need to be decomposed based on events)
- 18. 7 18
- 19. 7 19 “Things” In addition to modeling events, we have to model the “things” that the system needs to store information about E.g. products, orders, invoices, customers etc. In traditional approach, these things make up the data which the system stores information about In the object-oriented approach these things are objects
- 20. 7 20 A way to identify “things” of interest The analyst can identify types of things by thinking about each event in the event list and asking what types of things are affected that the system needs to know about E.g. when a customer places an order we need to know about the following The customer The items ordered Details about the order e.g. date and payment terms
- 21. 7 21 Relationships among Things Relationship: a naturally occurring association among specific things An order is placed by a customer and an employee works in a department “Is placed by” and “works in” are two relationships Relationships apply in two directions A customer places an order An order is placed by a customer Important to know the number of associations of things – I.e. the cardinality (or multiplicity) of the relationship E.g. one to one, one to many It is also important to know the range of possible
- 22. 7 22
- 23. 7 23 Types of relationships Binary relationship Relationship between two different types of things E.g. between a customer and an order Unary (recursive) relationship Relationship between two things of the same type E.g. one person being married to another person Ternary relationship A relationship between three different types of things E.g. one order associated with a specific customer plus a specific sales representative n’ary relationship
- 24. 7 24 Attributes of Things Attribute: one piece of specific information about a thing E.g. a customer has a name, phone number, credit limit etc. (these are attributes of a customer) Compound attribute: an attribute that contains a collection of related attributes – E.g. a full name is made up of first and last name Identifier (key) – an attribute that uniquely identifies a thing E.g. a person’s social insurance number (?), or an invoice or transaction number)
- 25. 7 25
- 26. 7 26 Data Entities and Objects Data entities For the traditional approach, are things the system needs to store information about. Modeled as boxes in the ER diagram) Computer processes interact with these data entities Entities are things like customers and order Objects – the other way to look at things Similar to data entities in traditional approach BUT the objects do the work in the system, they do not just store information (i.e. They have
- 27. 7 27 Objects Class: the type or classification to which all similar objects belong (e.g. guitar and violin objects both belong to class “stringed instruments”) Classes, associations among classes and attributes of classes are modeled using a class diagram Attribute:Store information (data) about the class, e.g. Custumer: name:string, ID:integer,Married:boolean Method: the behaviours all objects of the class are capable of A behaviour is an action that the object processes itself, when asked to do so E.g. ask a boiler object to check its water level by sending it a message Encapsulation: covering or protecting each object so that it contains values for attributes and methods for operating on
- 28. 7 28
- 29. 7 29 The Entity-Relationship Diagram Used in traditional approach Emphasizes data storage Data entities Their attributes Relationships among data entities Model used to define data storage Entity-relationship diagram (ERD)
- 30. 7 30 ERD Notation Rectangles: data entities Lines connecting rectangles: relationships
- 33. 7 33 1. (Traditional Approach to Requirements) Data Flow Diagrams (DFD) Data Flow Diagram (DFD) A graphical system model that shows all of the main requirements for an information system: inputs, outputs, processes and data storage Everyone working on the project (and end users) can see all the aspects of the project in the diagram with minimal training (simple – only 5 symbols)
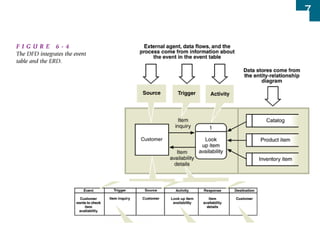
- 34. 7 A DFD is a graph showing the flow of data values from their sources through processes that transform them to their destinations. A DFD contains 1. Processes – that transforms data 2. Data flows – that move data 3. Actor objects / External agents – that produce or consume data 4. Data store – that store data passively DFD shows the functional relationships of the values computed by the system– Functional Model 34
- 35. 7 35
- 36. 7 36 Elements of a Data Flow Diagram The square is an external agent A person or organization, outside the boundary of a system that provides data inputs or accepts data outputs The rectangle with rounded edges is a process A symbol that represents an algorithm or procedure by which data inputs are tranformed into data outputs The lines are data flows Represents movement of data The flat three-sided rectangle/ parallel lines are data stores (a file or part of a database)
- 37. 7 37
- 38. 7 38 Data Flow Diagrams and Levels of Abstraction Levels of abstraction Particular to any modeling technique that breaks the system into a hierarchical set of increasingly more detailed models Example above – a DFD fragment – showing one process in response to one event Other diagrams show the processing at a higher level (more general) or lower level (a more detailed view of one process) Higher level processes in a DFD can be decomposed into separate lower level DFD (or some other diagram)
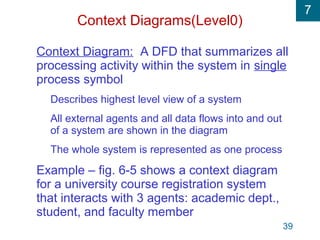
- 39. 7 39 Context Diagrams(Level0) Context Diagram: A DFD that summarizes all processing activity within the system in single process symbol Describes highest level view of a system All external agents and all data flows into and out of a system are shown in the diagram The whole system is represented as one process Example – fig. 6-5 shows a context diagram for a university course registration system that interacts with 3 agents: academic dept., student, and faculty member
- 40. 7 40
- 41. 7 41 Notes on Context Diagram Useful for showing system boundaries External agents are outside the software scope (which is represented by the single process). But not from System Analysis Data stores are not shown in the context diagram since they are considered to be in the software scope (i.e. the single process) It is the highest level DFD Context diagram does not show any details of what takes place within the system (i.e. that single process)
- 42. 7 42
- 43. 7 43 DFD Fragments(Level 1) DFD fragment: A DFD that represents the system response to one event within a single process symbol A fragment is created for each event in the event list – it is a self-contained model showing how the system responds to a single event Created one at a time Fig. 6-7 shows 3 DFD fragments for a course registration system Each fragment represents all processing for an event within a single process symbols The data stores in the DFD fragment represent entities in the ERD (Entity Relationship Diagram – see last lecture) – Not Necessarily !
- 44. 7 44
- 45. 7 45
- 46. 7 46
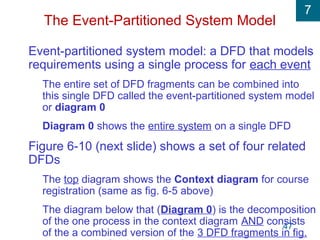
- 47. 7 47 The Event-Partitioned System Model Event-partitioned system model: a DFD that models requirements using a single process for each event The entire set of DFD fragments can be combined into this single DFD called the event-partitioned system model or diagram 0 Diagram 0 shows the entire system on a single DFD Figure 6-10 (next slide) shows a set of four related DFDs The top diagram shows the Context diagram for course registration (same as fig. 6-5 above) The diagram below that (Diagram 0) is the decomposition of the one process in the context diagram AND consists of the a combined version of the 3 DFD fragments in fig.
- 48. 7 48
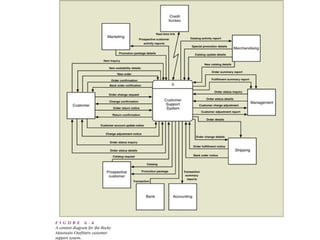
- 49. 7 49 Next Step: After the subsystems are defined: A DFD is created to represent the division of the system into subsystems – the subsystem DFD This subsystem DFD shows how the four RMO subsystems are connected (i.e. how they are related to all the outside sources and destinations of data) Note that there is a process in the diagram for each of the four subsystems that were defined for RMO See figure 6-13 for an example based on the 4 subsystems in the RMO example Note - even with only 4 subsystems (rather than one process for each of the 20 events) the diagram gets cluttered
- 50. 7 50
- 51. 7 51 Next Step: can decompose a subsystem DFD into event-partitioned models - one for each subsystem: In the RMO example can expand the subsystem in fig. 6-13 called “Order entry subsystem” into an event-partitioned model this model has 5 processes within it – see next slide The analyst would also create an event- partitioned model for the other 3 subsystems in the RMO example
- 52. 7 52
- 53. 7 53 Summary - Relationship of all these diagrams Figure 6-12 shows the relationship among DFD abstraction levels when subsystems are defined The figure starts off with the context diagram, which breaks down to the subsystem diagram (one for each subsystem) The subsystem diagram is turn broken down into the event-partitioned subsystem diagrams ETC.
- 54. 7 54 Layers of DFD Abstraction
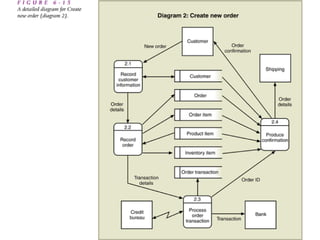
- 55. 7 55 Decomposing Processes to see Details of One Activity Using this same principle of breaking down the model to more detailed level, we can take a DFD fragment (e.g. create new order fragment from the RMO example) and decompose it into sub-processes In figure 6-15 this is shown Since fragment “create new order” was the second DFD fragment defined for the RMO example (see fig. 6-8) we will label processes inside of it as processes 2.1, 2.2, 2.3 etc. The diagram decomposes “create new order” into 4 sub-processes (see fig. 6-15) – labeled sub- processes 2.1-2.4
- 56. 7 56
- 57. 7 57 Evaluating DFD Quality A quality set of DFDs is Readable Internally consistent Accurately represents system requirements Minimizing complexity Want to avoid information overload Occurs when too much information is presented to a user at one time Two ways to avoid information overload use 7 + or – 2 rule (which limits the number of components) and interface minimization (which minimizes the number of interfaces and connections between components) A single DFD should have no more than 7 + or – 2 processes No more than 7 + or – 2 data flows into or out of a process
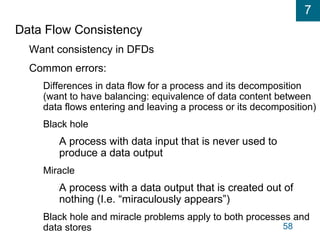
- 58. 7 58 Data Flow Consistency Want consistency in DFDs Common errors: Differences in data flow for a process and its decomposition (want to have balancing: equivalence of data content between data flows entering and leaving a process or its decomposition) Black hole A process with data input that is never used to produce a data output Miracle A process with a data output that is created out of nothing (I.e. “miraculously appears”) Black hole and miracle problems apply to both processes and data stores
- 59. 7 59
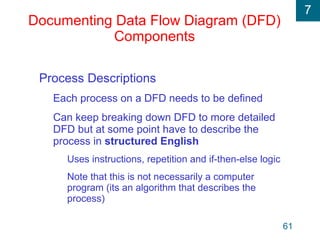
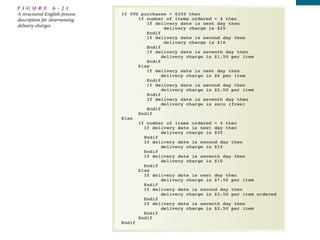
- 60. 7 60
- 61. 7 61 Documenting Data Flow Diagram (DFD) Components Process Descriptions Each process on a DFD needs to be defined Can keep breaking down DFD to more detailed DFD but at some point have to describe the process in structured English Uses instructions, repetition and if-then-else logic Note that this is not necessarily a computer program (its an algorithm that describes the process)
- 62. 7 62
- 63. 7 63 Limitations of structured English Good for representing processes such as those in previous slide Not so good for showing complex decision logic – as shown in next slide Not so good if there are few or no sequential steps Decision Table A tabular representation of processing logic containing decision variables, decision variable values and actions (or formulas) Decision Tree A graphical description of process logic that uses lines organized like branches of a tree
- 64. 7 64
- 65. 7 65 Making a Decision Table (from the logic on previous slide) Step 1 Identify the decision variables Year to date purchases (YTD) Number of items ordered Delivery date Step 2 Put variable with fewest possible value ranges in the first row of the table In this example could put either YTD or number of items
- 66. 7 66 Table so far is just one row: YTD Purchases > $250 YES NO Step 3 – put variable with next fewest possible value ranges as next row in the table, to now get: YTD Purchases > $250 YES NO Number of Items (N) N <=3 N>=4 N<=3 N>=4 Step 4 – keep inserting rows as in step 3 until all decision variables are included in the table
- 67. 7 67 Table now looks like: YTD Purchases > $250 YES NO Number of Items (N) N <=3 N>=4 N<=3 N>=4 Delivery Day Next 2nd 7th Next 2nd 7th Next 2nd 7th Next 2nd 7th Step 5 – Finally put as bottom row of the table the actions for each of the possible conditions – see next slide (fig. 6-22) from the text for the
- 68. 7 68
- 69. 7 69 Decision Tree A graphical description of process logic that uses lines organized like branches of a tree Decision table is more compact but decision tree is easier to read Decision tree can be developed in essentially same way as a decision table (only difference is that it runs horizontally – i.e. Rows in a decision table are columns in the tree – just flip the table sideways and you get the tree)
- 70. 7 70
- 71. 7 71 there may be several actions associated with a set of conditions in a Decision Table Figure 6-24 shows a table where if the customer is new and if an item is on backorder for >= 25 days then two things are done: (a) include detailed return instructions (b) expedite delivery See next slide for this example
- 72. 7 72
- 73. 7 73 Data Flow Definitions Data flow – a collection of data elements Data flow definition – a textual description of a data flow’s content and internal structure Lists all the elements- eg. a “New Order” data flow consists of Customer –Name Customer-Address Credit-Card-Information Item-Number Quantity Most of these are stored and correspond to the attributes of data entities
- 74. 7 74
- 75. 7 75
- 76. 7 76
- 77. 7 77
- 78. 7 78 Data Element Definitions Describe a data type E.g. String, integer, floating point, or Boolean Lengths are usually defined for strings Numeric values usually have a minimum and maximum value (a valid range) Might define special codes (e.g. code A means ship immediately etc.)
- 80. 7 80 Data Store Definitions Usually, a data store on the DFD represents a data entity on the ERD Should look at the ERD for details on this If no ERD can define the data store as a collection of elements (like did for data flows)
- 81. 7 81 Workflow Modeling Workflow The flow of control through a processing activity as it moves among people, organizations, computer programs, and specific processing steps Encompasses Trigger The processing steps that respond to a trigger Participants (or “actors”) – can be people and machines Flow of data
- 82. 7 82 Workflow models directly model the sequence of processing activities Can develop and check with users to gain better understanding of a system or organization Can also be developed during the transition between analysis and structured design Can be used to describe complex interactions Can be used to describe alternative approaches Uses some symbols from flow charts DFD are good at capturing flow of data within a workflow (but not control) Flow charts and activity charts can represent
- 83. 7 83
- 84. 7 84
- 85. 7 4.2 Object-Oriented Approach to Requirements 1. OO Requirements 2. The System Activities 3. Identifying Input and Outputs 4. Identifying Object Behavior 5. Integrating Object Oriented Models
- 86. 7 Learning Objectives Understand the models and processes of defining object-oriented requirements Develop use case diagrams and activity diagrams Develop system sequence diagrams Develop state machine diagrams to model object behavior Explain how UML diagrams work together to define functional requirements for the object-oriented approach Systems Analysis and Design in a Changing World, 5th Edition 86
- 87. 7 Overview The objective of requirements definition is understanding – understanding the users’ needs, the business processes, and the systems to support business processes Understand and define requirements for a new system using object-oriented analysis models and techniques Line between object-oriented analysis and object- oriented design is somewhat fuzzy Iterative approach to development Models built in analysis are refined during design Systems Analysis and Design in a Changing World, 5th Edition 87
- 88. 7 88 1.Object-Oriented Requirements Object-oriented system requirements are specified and documented through process of building models Systems development process starts with identification of events and things Events are business processes that new system must address Things are problem domain objects involved in business process
- 89. 7 89 Requirements Diagrams: Traditional and OO Models
- 90. 7 90 Object-Oriented Approach Models Class diagram – definition of system components Use case diagrams and use case descriptions – What are user roles and how they use the system Systems sequence diagrams (SSDs) – define inputs and outputs and sequence of interactions between user and system for a use case Statechart diagrams – describe states of each object Activity diagrams – describe user activities
- 91. 72.The System Activities— A Use Case/Scenario View(refer notes) Use case analysis used to identify and define all business processes that system must support Use case – an activity a system carried out, usually in response to a user request Actor Role played by user Outside automation boundary Systems Analysis and Design in a Changing World, 5th Edition 91
- 92. 7 Techniques for Identifying Use Cases Identify user goals Each goal at the elementary business process (EBP) level is a use case EBP – task performed by one user in one place and in response to business event that adds measurable business value, and leaves system and data in consistent state Event decomposition technique (event table) CRUD analysis technique (create, read/report, update, delete) to ensure coverage Systems Analysis and Design in a Changing World, 5th Edition 92
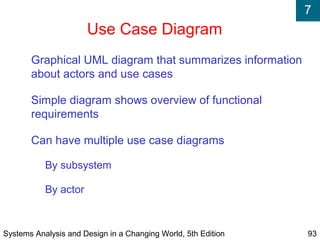
- 93. 7 Use Case Diagram Graphical UML diagram that summarizes information about actors and use cases Simple diagram shows overview of functional requirements Can have multiple use case diagrams By subsystem By actor Systems Analysis and Design in a Changing World, 5th Edition 93
- 94. 7 Simple Use Case with an Actor Systems Analysis and Design in a Changing World, 5th Edition 94 Figure 7-2
- 95. 7Use Case Diagram with Automation Boundary and Alternate Actor Notation Systems Analysis and Design in a Changing World, 5th Edition 95 Figure 7-3
- 96. 7All Use Cases Involving Customer as Actor Systems Analysis and Design in a Changing World, 5th Edition 96 Figure 7-4
- 97. 7Use Cases of RMO Order Entry Subsystem Systems Analysis and Design in a Changing World, 5th Edition 97 Figure 7-5 (partial figure)
- 98. 7 <<Includes>> Relationship Documents situation in which one use case requires the services of a common subroutine Another use case is developed for this common subroutine A common use case can be reused by multiple use cases Systems Analysis and Design in a Changing World, 5th Edition 98
- 99. 7 Example of Order-Entry Subsystem with <<Includes>> Use Cases Systems Analysis and Design in a Changing World, 5th Edition 99 Figure 7-6
- 100. 7 Developing a Use Case Diagram Underlying conditions for describing use cases Based on automated system, e.g. users “touch” the system Assume perfect technology condition Iterate through these two steps Identify actors as roles List goals, e.g. use cases, for each actor. A goal is a unit of work. Finalize with a CRUD analysis to ensure completeness Systems Analysis and Design in a Changing World, 5th Edition 100
- 101. 7 101 3.The Class Diagram(refer notes) There are two kinds of descriptions of systems Structural information (components of the system) Behavioral information (logic performed by components) Class diagram provides definition of structural components of the system The other OO diagrams (e.g. use case, sequence, collaboration) focus on activities the system performs NOTE – with OO Analysis, the class diagrams describes system requirements that can map very closely to the structure (i.e. classes) in the OO computer program that will be eventually created
- 102. 7 102 Generalization/Specialization Hierarchies • Hierarchies that structure or rank classes from the more general superclass to the more specialized subclasses (sometimes called inheritance hierarchies) • Generalizations • group similar types of things like all cars share certain features (e.g. all cars have wheels, engine etc.) • Specializations • are judgments that categorize different types of things (e.g. sports car is a special type of car) • A generalization/specialization hierarchy structures things from the general down to the more special – Each class has a more general class above it – a superclass – A class may have a more specialized class below – a subclass
- 103. 7 103
- 104. 7 104
- 105. 7 •Inheritance: a concept that allows subclasses to share characteristics of their superclasses •E.g. a sports car has everything a car has (e.g. 4 wheels and an engine, which it “inherits” from the class car which is above it) •The sports car then specializes E.g. has a sports option, racing wheels etc. 105 Inheritance
- 106. 7 106 Aggregation (Whole-Part Hierarchies) •Can also structure things by defining them in terms of parts •Aggregation: A relationship between and object and its parts •E.g. aggregation in the context of a computer system, a computer system is made up of: - processor, main memory, keyboard, disk storage, monitor
- 107. 7 107
- 108. 7 108 Example of Class Diagram Notation
- 109. 7 109 Another Example of Class Diagram Notation
- 110. 7 Activity Diagrams Used to document workflow of business process activities for each use case or scenario Standard UML 2.0 diagram as seen in Chapter 4 Can support any level of use case description; a supplement to use case descriptions Helpful in developing system sequence diagrams Systems Analysis and Design in a Changing World, 5th Edition 110
- 111. 7 Activity Diagram— Telephone Order Scenario Systems Analysis and Design in a Changing World, 5th Edition 111 Figure 7-8
- 112. 7 Activity Diagram— Web Order Scenario Systems Analysis and Design in a Changing World, 5th Edition 112 Figure 7-9
- 113. 7Identifying Inputs and Outputs— The System Sequence Diagram(refer notes) Interaction diagram – a communication diagram or a sequence diagram System sequence diagram (SSD) is type of UML 2.0 interaction diagram Used to model input and output messaging requirements for a use case or scenario Shows sequence of interactions as messages during flow of activities System is shown as one object: a “black box” Systems Analysis and Design in a Changing World, 5th Edition 113
- 114. 7 SSD Notation Lifeline or object lifeline is a vertical line under object or actor to show passage of time for object Message is labeled on arrows to show messages sent to or received by actor or system Actor is role interacting with the system with messages Object is the component that interacts with actors and other objects Systems Analysis and Design in a Changing World, 5th Edition 114
- 115. 7 System Sequence Diagram (SSD) Notation Systems Analysis and Design in a Changing World, 5th Edition 115 Figure 7-10
- 116. 7 SSD Lifelines Vertical line under object or actor Shows passage of time If vertical line dashed Creation and destruction of thing is not important for scenario Long narrow rectangles Activation lifelines emphasize that object is active only during part of scenario Systems Analysis and Design in a Changing World, 5th Edition 116
- 117. 7 SSD Messages Internal events identified by the flow of objects in a scenario Requests from one actor or object to another to do some action Invoke a particular method Systems Analysis and Design in a Changing World, 5th Edition 117
- 118. 7 Repeating Message Systems Analysis and Design in a Changing World, 5th Edition 118 Figure 7-11
- 119. 7 Developing a System Sequence Diagram Begin with detailed description of use case from fully developed form or activity diagram Identify input messages Describe message from external actor to system using message notation Identify and add any special conditions on input message, including iteration and true/false conditions Identify and add output return messages Systems Analysis and Design in a Changing World, 5th Edition 119
- 120. 7Activity Diagram of the Telephone Order Scenario Systems Analysis and Design in a Changing World, 5th Edition 120 Figure 7-12
- 121. 7Resulting SSD for the Telephone Order Scenario Systems Analysis and Design in a Changing World, 5th Edition 121 Figure 7-13
- 122. 7 SSD of the Web Order Scenario for the Create New Order Use case Systems Analysis and Design in a Changing World, 5th Edition 122 Figure 7-14
- 123. 7Identifying Object Behavior— The State Machine Diagram(refer notes)State machine diagram is UML 2.0 diagram that models object states and transitions Complex problem domain classes can be modeled State of an object A condition that occurs during its life when it satisfies some criterion, performs some action, or waits for an event Each state has unique name and is a semipermanent condition or status Transition The movement of an object from one state to another state Systems Analysis and Design in a Changing World, 5th Edition 123
- 124. 7 Simple State Machine Diagram for a Printer Systems Analysis and Design in a Changing World, 5th Edition 124 Figure 7-15
- 125. 7 State Machine Terminology Pseudostate – the starting point of a state machine, indicated by a black dot Origin state – the original state of an object from which the transition occurs Destination state – the state to which an object moves after the completion of a transition Message event – the trigger for a transition, which causes the object to leave the origin state Guard condition – a true/false test to see whether a transition can fire Action expression – a description of the activities performed as part of a transition Systems Analysis and Design in a Changing World, 5th Edition 125
- 126. 7 Composite States and Concurrency— States within a State Systems Analysis and Design in a Changing World, 5th Edition 126 Figure 7-16
- 127. 7 Concurrent Paths for Printer in the On State Systems Analysis and Design in a Changing World, 5th Edition 127 Figure 7-17
- 128. 7 Rules for Developing State Machine Diagram Review domain class diagram, select important ones, and list all state and exit conditions Begin building state machine diagram fragments for each class Sequence fragments in correct order and review for independent and concurrent paths Expand each transition with message event, guard- condition, and action-expression Review and test each state machine diagram Systems Analysis and Design in a Changing World, 5th Edition 128
- 129. 7 States and Exit Transitions for OrderItem Systems Analysis and Design in a Changing World, 5th Edition 129 Figure 7-18
- 130. 7 Partial State Machine for OrderItem Systems Analysis and Design in a Changing World, 5th Edition 130 Figure 7-19
- 131. 7 Final State Machine for OrderItem Systems Analysis and Design in a Changing World, 5th Edition 131 Figure 7-20
- 132. 7 Order Domain Class for RMO— States and Exit Transitions Systems Analysis and Design in a Changing World, 5th Edition 132 Figure 7-21
- 133. 7 First-Cut State Machine Diagram for Order Systems Analysis and Design in a Changing World, 5th Edition 133 Figure 7-22
- 134. 7Second-Cut State Machine Diagram for Order Systems Analysis and Design in a Changing World, 5th Edition 134 Figure 7-23
- 135. 7 Integrating Object-Oriented Models Complete use case diagram is needed to understand total scope of new system Domain model class diagrams should also be as complete as possible for entire system With iterative approach, only construct use case descriptions, activity diagrams, and system sequence diagrams for use cases in iteration Development of a new diagram often helps refine and correct previous diagrams Systems Analysis and Design in a Changing World, 5th Edition 135
- 136. 7 Relationships Between OO Requirements Models Systems Analysis and Design in a Changing World, 5th Edition 136 Figure 7-24
- 137. 7 4.3 Evaluating Alternatives for requirements, Environment and Implementation
- 138. 7 Major Activities in the Analysis Phase Gather information Define system requirements Prototype for feasibility and discover Prioritize requirements Generate and evaluate alternatives Review recommendations with management
- 139. 7 The end of the Analysis Phase During analysis many more requirements may be determined than can be dealt with Must prioritize and evaluate them Several alternative packages of requirements may be developed A committee of executives and users will decide which are most important Must select a system scope and level of automation Methods of development are reviewed
- 140. 7 Assessing the Target Processing Environment Target processing environment Configuration of computer equipment, operating systems and networks that will exist when the new system is deployed Must be a stable environment to support the new system Design and implementation of the processing environment is one of the early activities in moving from analysis to design
- 141. 7 1.Centralized Systems Prior to the early 1980’s there was only one environment – the mainframe computer system at a central location Options focused around what kind of input or output to these large systems Common to large-scale batch processing applications (e.g. banking, insurance, government etc.) where: Some input transactions don’t need to be processed in real time On-line data entry personnel can be centrally located Large numbers of periodic outputs are produced Often used for a subsystem of a larger, sometimes distributed information system
- 142. 7
- 143. 7 2.Single Computer Architecture Places all information system resources on a single computer system and its attached peripherals Requires all users be located near the computer Advantage is simplicity and ease of maintenance However, many systems require more computing power than one single machine can provide
- 144. 7
- 145. 7 3.Cluster Architecture A group of computers of the same type that have the same operating environment and share resources Computers from the same manufacturer are networked Clusters act like a single large computer system One may act as entry point and the others function as slave computers
- 146. 7 4.Multicomputer architecture A group of dissimilar computers that are linked together but the hardware and operating systems are not required to be a similar as in the clustered architecture System still functions like one single large computer Can have central computer and slave computers Main computer may execute programs and hold database The front-end computer may handle all communication
- 147. 7
- 148. 7 5.Distributed Computing Distributed computing The approach to distributing a system across several computers and locations E.g. corporate financial data might be stored on a centralized mainframe, linked to minicomputers in regional office and personal computers at more locations Relies on computer networks to connect up the systems
- 149. 7 6.Client-Server Architecture Currently the dominant architectural model for distributing information resources Server computer (server): A computer that provides services to other computers on the network Client computer: A computer that requests services from other computers on the network E.g. print server on a network, that clients (other PCs on the network) can send print jobs to Middleware Computer software that implements communication protocols on the network and helps different systems communicate Data layer A layer on a client-server configuration that contains the database
- 150. 7
- 151. 7 7.Three Layer Client-Server Architecture An information system application program can be divided into the following set of client and server processes or layers Three-layer architecture The data layer Manages stored data, implemented as one or more databases The business logic layer Implements the rules and procedures of business processing The view layer Accepts user input, and formats and displays processing results View layer acts as client of the business logic layer, which acts a a client of the data layer
- 152. 7
- 153. 7 Notes on Three Layer Architecture Easy to distribute and replicate over a network Layers are relatively independent of each other Can be expanded into a larger number of layers N-layer architectures, or n-tiered architectures A client-server architecture that contains n layers
- 154. 7 The Internet and Intranets Internet: a global collection of networks that are interconnected using a common low-level networking standard – TCP/IP (Transmission Control Protocol/Internet Protocol) Services provided by the Internet E-mail protocols (Simple Mail Transfer Protocol – SMTP) File transfer protocols (e.g. File Transfer Protocol – FTP) Remote login and process execution protocols (e.g. Telnet)
- 155. 7 Intranets and Extranets Intranet A private network that is accessible to a limited number of users, but which used the same TCP/IP protocol as the Internet Restricted access – firewalls, passwords, unadvertised Extranet An intranet that has been extended outside of the organization to facilitate the flow of information (e.g. access to suppliers, customers, and strategic partners) Allows organizations to exchange information and form a virtual organization The Web is organized as a client-server architecture Web processes are managed by server processes that execute on dedicated servers and clients send requests to servers using a standard web resource request protocol
- 156. 7 The Internet as an Application Platform The Internet provides an alternative for implementing systems E.g. RMO buyer can access the system while on the road – the client portion of the application is installed on their laptop computers (uses modem/wi-fi/… to connect) Using the WWW for accessing the remote site, all the buyer needs is a web browser and is now accessible from any computer with Internet access Use of the Internet greatly expands accessibility and eliminates need to install custom client software – also cheaper to put up on the Web
- 157. 7Advantages of WWW over traditional client-server approaches Accessibility Web browser and Internet connections are nearly ubiquitous and are accessible to large numbers of users Low-cost communication High-capacity WAN form the Internet backbone are funded primarily by governments (a company can use the Internet as a low-cost WAN) Widely implemented standards Web standards are well known and many computer professionals are trained in their use Use of intranet or extranet enjoys all the advantages of web delivery Really represents evolution of client-server computing to the WWW
- 158. 7 Negative Aspects of Application Security Web servers are well-defined target for security breaches Reliability Internet protocols do not guarantee a minimum level of network through put or that a message Throughput Data transfer capacity of many users limited by analog modems to under 56 kilobits per second Volatile standards Web standards change rapidly
- 159. 7 Development and System Software Environments Development environment Consists of standards and tools used in an organization E.g. CASE tools, programming standards System software environment Includes operating system, network protocols, database management systems etc. Important activity during analysis To determine the components of the environment that will control the development of the new application
- 160. 7 Important components of the environment that will affect the project Language environment and expertise Companies often have preferred languages Numerous languages out there – COBOL, C++, Visual Basic, to web-based languages like Java and Perl Script Choosing a new language requires additional work Existing CASE tools and methodologies If a company has invested heavily in a CASE tool then all new development may have to conform to it Required interfaces to other systems A new system typically must provide information to and receive it from existing systems
- 161. 7 Operating System environment Strategic goals may exist to change the operating system Multiple platforms may be needed Legacy systems are often still there and may be linked to newer client-server applications and databases Database management system (DBMS) Many corporations have committed to a particular database vendor May require a distributed database environment with portions distributed over the country
- 162. 7Deciding on Scope and Level of Automation Scope of a system E.g. current RMO point-of-sales system’s scope includes handling mail and telephone sales but not Internet Level of Automation In the new system a very low level of automation is needed for telephone sales aspects “Scope creep” A problem with development projects where requests for additional features just keeps continuing To avoid we need to formalize the process of selecting which functions are critical or not
- 163. 7 Scoping Table Scoping table: a tabular list of all the functions to be included within a system It is an expanded version of the event table It may include events from the event table plus some identified later on Each business function can be prioritized Mandatory Important Desirable
- 164. 7
- 165. 7
- 166. 7 Defining Level of Automation Level of automation The kind of support the system will provide for each function Low, middle, high E.g. low level is using computer for order-entry function, high level is using computer to support high-level decision making by human Low end is basically an automated version of a current manual procedure A high level occurs when system takes over as much as possible the processing of the function High end often involves creating new processes and procedures
- 167. 7 Rocky Mountain Outfitters – example of functions of a high-end system Customers can access catalog on-line with 3D pictures over the WWW The catalog is also interactive and allows customer to combine items The user interface is voice-activated Payment is verified on-line The customer can see a history of all prior orders and can check the status of any order over the WWW or telephone
- 168. 7
- 169. 7 Selecting Alternatives More and more new systems are being used to provide high-level automation solutions Criteria used to decide which functions to support and level of automation are based on Strategic IT plan Feasibility study Economic feasibility Operational, organizational and cultural feasibility Technological feasibility Schedule and resource feasibility
- 170. 7 Evaluation of Alternatives for RMO example Project team decided to include all functions that were classified as mandatory or important For each, a detailed analysis was done to determine level of automation A table or list can be made of preliminary selection of which functions to include and at what level of automation For most functions, a medium level of automation was selected (see shaded boxes) See next slide for part of that table
- 171. 7
- 172. 7 Generating Alternatives for Implementation Now ask “where do we go from here?” Options include buying a computer program if the application is fairly standard OR company may decide to build the system from ground up Next figure shows this in a graph Vertical column is the build-versus-buy axis (at the top of the axis the entire system is bought as a package) In between is a combination of buy and build There a various alternatives ranging from in-house development to purchasing a complete ERP system
- 173. 7 Cloud
- 174. 7 In-House Development Large and medium-sized companies have in- house development staff A problem with this is that special technical expertise may be beyond employees’ experience So may use company employees to manage and staff projects, but also call in consultants when needed Advantage Control of project and knowledge retained in the company Company can build internal expertise
- 175. 7 Custom Software Development A solution that is developed by an outside service provider New system is developed from scratch (using SDLC) But project team consist mainly of outside consultants Advantages of custom development: consulting firm may have developed similar systems and has good knowledge of the domain and pool of qualified staff Outsourcing and contract development are the fastest growing segments of the IS industry Disadvantage: the cost (paying at high consulting hourly wages – e.g. $100 per hour is typical) Opted for when no in-house expertise or tight schedules Often for large systems (e.g. health care) where cost is outweighed by savings due to high volume of use of system
- 176. 7 Packaged and Turnkey Software Systems Packaged software: software that is already built and can be purchased as a package Strict definition is that software is used as is, with no change E.g. a standard reporting system package may work for some of the companies requirements Turnkey system: a complete system solution, including software and hardware, that can be just turned on Companies creating these systems usually specialize in a particular industry But problem is that often they don’t exactly meet the needs of an organization
- 177. 7 In some cases only executable code is provided, other cases include both source and executable Vendor may make the changes or company itself might (if it has programmers) Enterprise Resource Planning (ERP) A turnkey system that includes all organizational functions of an organization (e.g. companies such as SAP, Oracle provide these) May take longer than a year to install Can cost millions Advantage of ERP: a new system can often be obtained at a much lower cost than in-house development, also risks may be lower
- 178. 7 Facilities Management / Cloud Facilities management: the outsourcing of all data processing and information technology to an outside vendor E.g. a bank my hire a facilities management firm to provide all of the data processing including software, networks and even technical staff Typically part of a long-term strategic plan for an entire organization Contracts cost a lot (millions) – example EDS (Electronic Data Systems)
- 179. 7Choosing an Alternative for Implementation Identifying Criteria for Selection Criteria will be used to compare alternative choices (e.g. in-house or outsourcing) Three general areas to consider General requirements Technical requirements Functional requirements General requirements include Feasibility assessment (scope and level of automation) Each alternative must meet the requirements of Cost Technology
- 180. 7 For outsourced alternatives The providers stability and performance record is also important For in-house alternatives Must consider risks, length of schedule and availability of in-house expertise Must evaluate for total cost and impact on the organization of alternatives
- 181. 7 Criteria for assessment of alternatives The performance record of the provider Level of technical support from the provider Availability of experienced staff Development costs Expected value of benefits Length of time (schedule) until deployment Impact on internal resources Requirements for internal expertise Organizational impacts (retraining, skill levels) Expected cost of data conversion Warranties and support services (from outside vendors)
- 182. 7 Relative importance of each criteria can be weighted on a 5- point scale (a weighting scale) 1 indicates low importance 5 indicates high importance Also for each alternative we can rate the alternative for that criteria, on a five point scale 1 indicates the alternative is weak for that criteria 5 indicates the alternative is strong on that criteria Then we can multiply the importance of a criteria by its rating for each alternative to get extended scores Finally, we can add up the extended scores for all alternatives and see which comes up best
- 183. 7
- 184. 7 In addition to general requirements, we should include criteria to evaluate the quality of the software Robustness (software does not crash) Programming errors (software calculates correctly) Quality of code (maintainability) Documentation Easy installation Flexibility (adjusts to new functionality and environments Structure (maintainable, easy to understand) User-friendliness Can do tables for the above technical requirements and also for functional requirements (tables 8-8 and 8-9) on next slides
- 185. 7
- 186. 7
- 187. 7