Modelingprogramstructure
Download as pptx, pdf1 like458 views

The document discusses different models for representing systems, including the IPO (Input-Process-Output) model and data flow diagrams. It also covers Gantt charts, which are bar charts used for project scheduling and management. Gantt charts illustrate the start and end dates of project elements and can show progress over time. The document provides steps for creating a Gantt chart, such as understanding the project breakdown structure, gathering task information, estimating timelines, arranging tasks visually, and evaluating dependencies between elements.


More Related Content
What's hot (20)
Viewers also liked (13)

![Flow Chart & Input Output Statement [3] M](https://cdn.slidesharecdn.com/ss_thumbnails/flow-chart-inputoutput-statement-3-m-1233232763031429-3-thumbnail.jpg?width=560&fit=bounds)


Similar to Modelingprogramstructure (20)


More from learnt (20)


Recently uploaded (20)


![[2025] Qualtric XM-EX-EXPERT Study Plan | Practice Questions + Exam Details](https://cdn.slidesharecdn.com/ss_thumbnails/2025qualtricxm-ex-expertstudyplanpracticequestionsexamdetails-250527093747-448c8922-thumbnail.jpg?width=560&fit=bounds)


Modelingprogramstructure
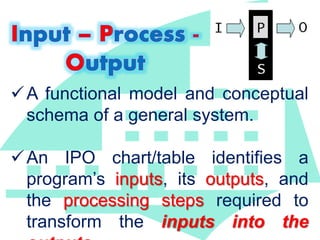
- 2. A functional model and conceptual schema of a general system. An IPO chart/table identifies a program’s inputs, its outputs, and the processing steps required to transform the inputs into the outputs.
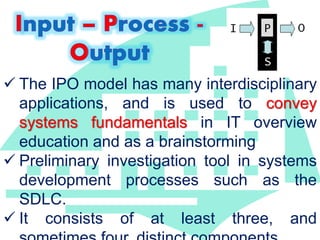
- 3. The IPO model has many interdisciplinary applications, and is used to convey systems fundamentals in IT overview education and as a brainstorming Preliminary investigation tool in systems development processes such as the SDLC. It consists of at least three, and sometimes four, distinct components.
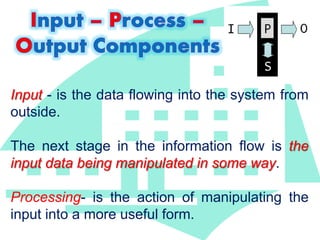
- 4. Input - is the data flowing into the system from outside. The next stage in the information flow is the input data being manipulated in some way. Processing- is the action of manipulating the input into a more useful form.
- 5. The final stage in the information flow is normally to present the information in a user-friendly way. Output- is the information flowing out of the system.
- 6. The components of the IPO model are defined as: I: Input - The information, ideas, and resources used in creating a program P: Processing - Actions taken upon/using input or stored material O: Output - Results of the processing that then exit the system S: Storage - Location(s) where material inside the system is/are placed for possible use at a later point in time
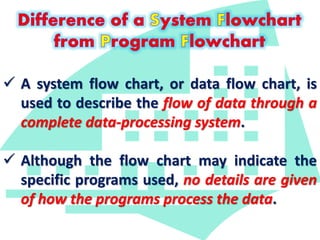
- 8. A system flow chart, or data flow chart, is used to describe the flow of data through a complete data-processing system. Although the flow chart may indicate the specific programs used, no details are given of how the programs process the data.
- 9. A program flow chart is used to describe the flow of data through a particular computer program, showing the exact sequence of operations performed by that program in order to process the data. Different graphic symbols are used to represent data input and output, decisions, branches, and subroutines.
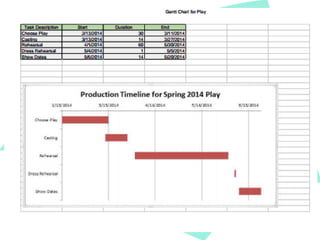
- 12. A Gantt chart is a type of bar chart, developed by Henry Gantt in the 1910s, that illustrates a project schedule. Gantt charts illustrate the start and finish dates of the terminal elements and summary elements of a project. Terminal elements and summary elements comprise the work breakdown structure of the project. Gantt charts can be used to show current schedule status using percent-complete shadings and a vertical "TODAY" line as shown here.
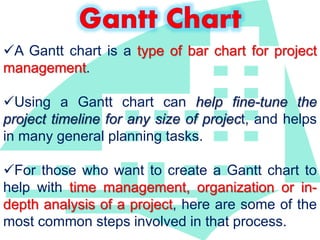
- 13. A Gantt chart is a type of bar chart for project management. Using a Gantt chart can help fine-tune the project timeline for any size of project, and helps in many general planning tasks. For those who want to create a Gantt chart to help with time management, organization or in-depth analysis of a project, here are some of the most common steps involved in that process.
- 16. 1Understand the work breakdown structure. o The Gantt chart is meant to help with a comprehensive goal of planning and implementing a work breakdown structure, which is the overall structure of the project. o Knowing more about what this means can be useful for those who are planning to build a Gantt chart or use a related software resource. o Learn about terminal and summary elements. Terminal elements and summary elements are two different types of project phases or modules that have
- 18. 2.Gather necessary information about all steps or processes included in a greater project. This information is what the project manager will use to build the Gantt chart.
- 20. 3. Build timelines. o While looking at all of the assembled information, determine how long each project step or process will take. o Add this into the mix, and plot lengths for individual bars that will represent phases or processes. o Shift times for results.
- 22. 3. With a general time frame in mind for each step or process, situate these within the greater Gantt chart to arrive at a deadline for each element. It can help to stagger processes to ensure smoother operations or eliminate cluster dates, which can overwhelm the project manager.
- 24. 4. Lay out all of the bars on the graph. The Gantt chart assembles all pieces relative to a fixed deadline. Within a greater project deadline, the timeline for smaller processes becomes clear for those who are looking at the Gantt chart.
- 26. 5. Evaluate dependency or relationships between phases or processes. Looking at the Gantt chart can also make it clear which parts of a project are dependent on others. Software tools can have advanced features that can help human decision makers to learn more from viewing the visual Gantt chart.
- 28. 6. Implement the Gantt chart in software. Many project managers choose to take all of the information on a Gantt chart and input it into a software environment. For example, the Excel spreadsheet tool can be an effective home for a Gantt chart. Choose appropriate software and digitize the Gantt chart to help work it into a greater software architecture.