Monitoring Node.js Microservices on CloudFoundry with Open Source Tools and a Shoestring Budget

While microservice architectures offer lots of great benefits, there’s also a downside. Perhaps most notably, there is an increased complexity in monitoring the overall reliability and performance of the system. In addition, when problems are identified, finding a root cause can be a challenge. To ease these pains in managing the IBM Bluemix UI (made up of more than twenty microservices running on CloudFoundry), we’ve built a lightweight system using Node.js and other opensource tools to capture key metrics for all microservices (such as memory usage, CPU usage, speed and response codes for all inbound/outbound requests, etc.). In this approach, each microservice publishes lightweight messages (using MQTT) for all measurable events while a separate monitoring microservice subscribes to these messages. When the monitoring microservice receives a message, it stores the data in a time series DB (InfluxDB) and sends notifications if thresholds are violated. Once the data is stored, it can be visualized in Grafana to identify trends and bottlenecks. Tony Erwin will discuss the details of the Node.js implementation, real-world examples of how this system has been used to keep the Bluemix UI running smoothly without spending a lot of money, and how it’s acted as a “canary” to find problems in non-UI subsystems before the relevant teams even knew there was an issue! Presented at Cloud Foundry Summit 2017: http://sched.co/AJmn


More Related Content
What's hot (20)
Similar to Monitoring Node.js Microservices on CloudFoundry with Open Source Tools and a Shoestring Budget (20)


Recently uploaded (20)


Monitoring Node.js Microservices on CloudFoundry with Open Source Tools and a Shoestring Budget
- 1. Monitoring Node.js Microservices on CloudFoundry with Open Source Tools and a Shoestring Budget Tony Erwin, [email protected]
- 2. Agenda • Introduction to Bluemix UI & Architecture • Importance of Monitoring w/ Microservices • Overview of Monitoring Architecture • Using Monitoring Data • Building Your Own Monitoring System • Synthetic Measurements
- 3. Bluemix UI • Front-end to IBM’s open cloud Bluemix offering • Lets users view and manage CF resources, containers, virtual servers, user accounts, billing/usage, etc • Runs on top of Bluemix PaaS Layer (Cloud Foundry) Dashboard Catalog Resource Details And More!
- 4. Bluemix UI Architecture • Migrated from a monolithic to a microservice architecture over the last couple of years • Composed of 25+ Node.js apps deployed to Cloud Foundry • See talk from earlier this week for more details – To Kill a Monolith: Slaying the Demons of a Monolith with Node.js Microservices on CloudFoundry Home Catalog … DashboardPricing Orgs/ Spaces Backend APIs (CF, Containers, VMs, BSS, MCCP, etc.) Bluemix UI (Client) Bluemix PaaS Proxy Common Monitoring Framework Session Store NoSQL DB Cloud Foundry
- 6. Importance of Monitoring • Root cause analysis when a problem occurs – Bluemix UI is most visible part of the platform and acts as a “canary in the mine shaft” for the whole platform – When a critical event or outage occurs, it often starts with reports like: • “Can’t login to console” • “Console doesn’t work…” • “Console is slow…” – When this happens in the middle of the night, my team is regularly the first to get a PagerDuty • Being able to quickly find root cause is a matter of self-preservation – Console behavior is often (but not always!) a symptom of something going on elsewhere (like CF is having problems, networking is down, etc.) • Auto-detection of problems – Ideally, we want to find and fix problems before a user hits them – Example: Send a PagerDuty when error rates for a given API go above a threshold • Tracking against performance and quality targets – Can’t meet goals for something you can’t measure over time
- 7. What to Monitor? • Metrics we were especially interested in: – Data for every inbound/outbound request for every microservice • Response time • HTTP response code • Etc. – Memory usage, CPU usage, uptime, and crashes for every instance of every microservice – General health of ourselves and dependencies
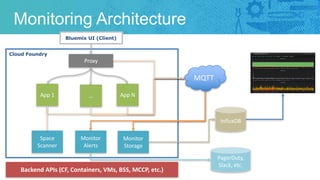
- 9. Monitoring Architecture Monitor Storage Backend APIs (CF, Containers, VMs, BSS, MCCP, etc.) Bluemix UI (Client) Cloud Foundry Proxy InfluxDB App 1 MQTT PagerDuty, Slack, etc. … App N Monitor Alerts Space Scanner
- 10. Monitoring Components • Each microservice bound to an MQTT service (which happens to be provided by the IBM Internet of Things service) • Each microservice adds middleware (private npm module) that publishes inbound / outbound request data to MQTT in a “fire and forget” manner – Also supports a general “publish” function to send arbitrary metrics to MQTT (e.g., overall system health, number of times we retrieve JSON from Redis cache instead of API, etc.) • Storage microservice: – Subscribes to the same queue, does some massaging of the data (such as tagging with URL “category”), and writes to InfluxDB • Alerts microservice: – Subscribes to the same queue, aggregates the inputs over the last X minutes, and sends alerts (like Slack, PagerDuty, etc.) • Scanner microservice: – Calls CF APIs every 60 seconds to get data for each app instance on mem usage, CPU usage, uptime, and crashes – Publishes the data to MQTT • Grafana dashboards display data from data series in InfluxDB • Details app is deployed that can pull data from InfluxDB to complement Grafana: – Shows details of all of the requests in tabular format – Provides capabilities to make special queries against the InfluxDB data
- 12. Grafana Dashboards • Grafana dashboards used to visualize data over time for any microservice • Data includes: – Total requests – Response time (mean, median, 90% time) – Error rate
- 13. Identifying a Problem in Grafana • Like a cardiologist reading an echocardiogram, we’ve gotten good at identifying anomalies in these charts • Data to left shows a recent “outage” where error rates and response times spiked for a period of time
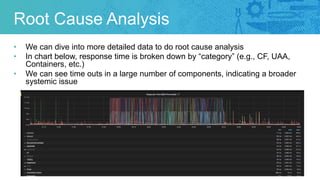
- 14. Root Cause Analysis • We can dive into more detailed data to do root cause analysis • In chart below, response time is broken down by “category” (e.g., CF, UAA, Containers, etc.) • We can see time outs in a large number of components, indicating a broader systemic issue
- 15. Details View • Can drill down and get tabular view with aggregated details about the requests making up a chart • Can drill down again to see list of individual requests (with timestamps) as well as get more detailed statistics on individual URLs
- 16. Wall of Shame • Building on the details view from the previous page, we can build walls of “shame” to help drive improvements – Show the 10 slowest API calls made to/from a specific microservice that have been called at least 1000 times during the last 24 hours – Show the top 10 requests with the most error responses that are invoked at least X times over an arbitrary time period – Etc.
- 17. Memory, CPU Usage, Crashes • Another important set of data includes memory, CPU usage, and crashes for all instances of all microservices • Chart below shows a major CPU usage issue we found in a dev system, so was able to fix before finding its way to production
- 18. Building Your Own Monitoring System
- 19. Node Application Metrics (appmetrics) • Had planned on publishing some of my monitoring code, but in prep for CF Summit learned of the appmetrics project being driven by some fellow IBMers • Shares much in common with the middleware I mentioned earlier that publishes metrics to MQTT, but goes even deeper to provide additional performance insights • Fully open source – https://github.com/RuntimeTools/appmetrics • Proves yet again that IBM is a big place J
- 20. Default Capabilities and MQTT • Sends data to MQTT, meaning you can subscribe to updates • Provides an Event API which allows: – custom triggers based on the monitoring data – publication of custom events • This would be enough to support other pieces of the Bluemix UI monitoring system (like the storage service or the alerts service)
- 21. App Metrics – Default Capabilities
- 22. Data Storage • Can be configured to store data: – Elastic Search • https://github.com/RuntimeTools/appmetrics-elk – StatsD • https://github.com/RuntimeTools/appmetrics-statsd • No support for InfluxDB yet, but I’ve suggested to the team they should add it
- 24. Collecting Synthetic Data • Monitoring discussed so far only paints a picture of the server side • It’s also important to get a perspective from the client • Continuously run scripts that leverage Sitespeed.io (https://www.sitespeed.io/) to load the major pages of the product • Collects data such as perf score, first visual change, speed index, etc. and stores in Graphite – Grafana dashboards built to allow us to visualize the data – Scripts can be running from multiple geo locations
- 25. The End Questions? Tony Erwin Email: [email protected] Twitter: @tonyerwin See also presentation from earlier this week: To Kill a Monolith: Slaying the Demons of a Monolith with Node.js Microservices on CloudFoundry (http://sched.co/AJmh)