This document provides an introduction to business analytics. It defines business analytics as combining data, information technology, statistical analysis, quantitative methods, and computer-based models to provide decision makers with possible scenarios to make well-informed decisions. The document also discusses the evolution of business analytics and some key techniques used in business analytics like descriptive analysis, predictive analysis, and prescriptive analysis.
Implementation of Business Process Reengineering in Thermax Ltd.Pramod Patil
Implementation of Business Process Reengineering in Thermax Ltd. to achieve dramatic improvements in critical, contemporary measures of performance such as cost, quality, service and speed by the fundamental rethinking and radical redesign of business processes
Financial Services - New Approach to Data Management in the Digital Eraaccenture
How current is your data management strategy? As technology—and the requirements and business drivers around it—changes, financial services firms will need to change their approach to data management. To guide your approach, see the three building blocks to Accenture’s data management framework covered in this presentation.
This document outlines best practices for creating research data. [1] It recommends using consistent data organization with standardized formats and descriptive file names. [2] Researchers should perform quality assurance checks and use scripted programs to analyze data while keeping notes. [3] All aspects of data collection and analysis should be thoroughly documented. Following these practices will improve data usability, sharing, and reproducibility.
Business intelligence- Components, Tools, Need and Applicationsraj
As part of the research project for the course Technical Foundations of Information Systems at the University of Illinois, our team worked on the topic, Business Intelligence. The presentation focuses on what is Business Intelligence, its various components, latest tools, the need of BI as well as applications of this technology. This project deals with the latest development of BI technologies (hardware or software) and includes comprehensive literature survey from Journals, and the Internet.
Business process reengineering module 1POOJA UDAYAN
Business processes are collections of activities that take inputs and create outputs of value to customers. Business process management involves modeling, automating, executing, controlling, measuring, and optimizing business processes. The goals of business process management are to improve processes, gain control over workflows, and optimize processes to create an efficient organization. Business process reengineering takes a radical approach to redesign processes from scratch in order to achieve dramatic improvements in areas like costs, quality, and cycle times.
Business intelligence (BI) refers to transforming raw company data into usable information through specialized computer programs. Raw data from transaction systems can be aggregated and manipulated in BI applications to generate information like sales trend graphs. This helps address challenges where companies have large amounts of raw data but lack tools to exploit it. BI applications read data from transaction systems, transform and present it to decision makers in reports, charts, queries and alerts. For BI projects to succeed, management must be committed, users involved in planning, and systems made easy to use and flexible.
This document outlines a playbook for implementing a data governance program. It begins with an introduction to data governance, discussing why data matters for organizations and defining key concepts. It then provides guidance on understanding business drivers to ensure the program aligns with strategic objectives. The playbook describes assessing the current state, developing a roadmap, defining the scope of key data, establishing governance models, policies and standards, and processes. It aims to help clients establish an effective enterprise-wide data governance program.
This document contains a list of names and links related to business intelligence. It includes the names Marina Ainaga, Lucía Carmen, Paula Castillero, and Inés Clavero. It also contains various links to articles and websites about business intelligence definitions, examples, common mistakes, essential characteristics, and solutions.
This document discusses business process reengineering and principles for effective reengineering. It provides examples of Ford Motor Company and Mutual Benefit Life reengineering their accounts payable and insurance application processes, respectively. Both saw significant reductions in headcount and time to complete processes by centralizing information and putting decision points closer to the work. The document advocates for reengineering processes based on outcomes rather than tasks, using technology to enable new processes rather than just automating old ones, and treating resources globally rather than locally.
Distribution Requirements Planning from indiana.eduwarmleon
DRP (Distribution Requirements Planning) manages the flow of materials between firms, warehouses, and distribution centers to integrate supply chain inventory information with manufacturing planning. It helps determine vehicle and warehouse capacity, loading, and dispatching to continually adjust to changes in demand. DRP is connected to both demand management in the marketplace and the MPS (Master Production Schedule) in manufacturing to provide accurate shipping information and evaluate if manufacturing priorities need adjustment. The basic DRP record tracks forecast requirements, in-transit inventory, projected available balance, and planned shipments over multiple time periods.
Business intelligence competency centre strategy and road mapOmar Khan
The document outlines a strategy and roadmap for a Business Intelligence Competency Centre (BICC). It discusses how data is fueling new functions in media agencies and the need for data management services. It proposes that a BICC can provide centralized knowledge, best practices, and cost savings to support broader BI initiatives. Key components of an effective BICC include an organizational structure with roles like a director, business analysts, and technical consultants. The ultimate goals of the BICC are to help the organization meet BI metrics and ensure strategic, easy access to information across the business.
This document provides an overview of key concepts related to accounting information systems. It discusses information flows within a business, the roles of AIS and MIS, how transactions are processed, and the general model for information systems. It also summarizes the evolution of IS models from manual to database systems and the three main roles of accountants in an information system.
This document provides information about lean production and just-in-time (JIT) manufacturing. It includes an acknowledgement, index, and sections on what lean production is, JIT, the history and development of JIT, concepts of JIT, and characteristics of JIT. The document was produced by a group of students for their production management and material management class project on lean production and JIT, with a focus on its application to Bisleri company.
This document discusses high performance supply chains and JDA software. It provides key findings on JDA's total revenue, customers, professionals employed, and locations worldwide. It then discusses JDA's end-to-end capabilities and focus on customers through innovation and R&D spending. Finally, it summarizes JDA's supply chain planning ecosystem and flexible business model in providing transportation, warehouse, replenishment, and other solutions through its platform.
The Role of Data Governance in a Data StrategyDATAVERSITY
A Data Strategy is a plan for moving an organization towards a more data-driven culture. A Data Strategy is often viewed as a technical exercise. A modern and comprehensive Data Strategy addresses more than just the data; it is a roadmap that defines people, process, and technology. The people aspect includes governance, the execution and enforcement of authority, and formalization of accountability over the management of the data.
In this RWDG webinar, Bob Seiner will share where Data Governance fits into an effective Data Strategy. As part of the strategy, the program must focus on the governance of people, process, and technology fixated on treating and leveraging data as a valued asset. Join us to learn about the role of Data Governance in a Data Strategy.
Bob will address the following in this webinar:
- A structure for delivery of a Data Strategy
- How to address people, process, and technology in a Data Strategy
- Why Data Governance is an important piece of a Data Strategy
- How to include Data Governance in the structure of the policy
- Examples of how governance has been included in a Data Strategy
This document provides an overview of business intelligence. It discusses how more than 35% of top global companies regularly fail to make insightful decisions. It then describes how business intelligence tools can help by gathering and storing enterprise data systematically to transform it into knowledge through reports and graphs. This helps users make better business decisions. An example is given of a large US retail shop that used business intelligence to discover a connection between diaper and beer sales, allowing them to increase both products' sales by placing them closer together on shelves. The document concludes that business intelligence has great potential to find unexpected insights and can help organizations stand out from competitors by supporting more reliable decision-making.
Introduction to Data Warehouse. Summarized from the first chapter of 'The Data Warehouse Lifecyle Toolkit : Expert Methods for Designing, Developing, and Deploying Data Warehouses' by Ralph Kimball
The document provides information about warehousing and storage. It discusses:
1) The need for storage arises for both raw materials and finished products to create maximum time utility at minimum cost.
2) Storage involves proper management to preserve goods from production until use. Large scale storage in a specified manner is called warehousing.
3) Warehouses now serve as distribution centers rather than just storage, ensuring a continuous supply of goods to meet changing market conditions.
The document outlines concepts related to capacity planning, including:
1. It defines design capacity, effective capacity, and utilization, and provides an example to calculate these metrics for a bakery.
2. It discusses different approaches to managing capacity, such as leading or lagging demand, and making incremental vs. one-time capacity expansions.
3. It introduces break-even analysis as a technique to evaluate capacity alternatives by finding the point where total costs equal total revenue. Key variables in the analysis include fixed costs, variable costs, price, and production volume.
Introduction To Business Architecture – Part 1Alan McSweeney
This is the first of a proposed four part introduction to Business Architecture. It is intended to focus on activities associated with Business Architecture work and engagements.
Business change without a target business architecture and a plan is likely to result in a lack of success and even failure. An effective approach to business architecture and business architecture competency is required to address effectively the pressures on businesses to change. Business architecture connects business strategy to effective implementation and operation:
• Translates business strategic aims to implementations
• Defines the consequences and impacts of strategy
• Isolates focussed business outcomes
• Identifies the changes and deliverables that achieve business success
Enterprise Architecture without Solution Architecture and Business Architecture will not deliver on its potential. Business Architecture is an essential part of the continuum from theory to practice.
It is a brief overview of Big Data. It contains History, Applications and Characteristics on BIg Data.
It also includes some concepts on Hadoop.
It also gives the statistics of big data and impact of it all over the world.
Integrating Data Analytics into a Risk-Based Audit PlanCaseWare IDEA
Presented at a IIA Chapter Meeting.
Although most would agree that internal audit provides an assurance function, it can also be a value-added service. One such value is identifying areas of improvement. This presentation looks at how data analytics can be used within the audit process including risk and controls assessment.
SLIDESHARE: www.slideshare.net/CaseWare_Analytics
WEBSITE: www.casewareanalytics.com
BLOG: www.casewareanalytics.com/blog
TWITTER: www.twitter.com/CW_Analytic
Data-Ed Online: Data Management Maturity ModelDATAVERSITY
The Data Management Maturity (DMM) model is a framework for the evaluation and assessment of an organization's data management capabilities. The model allows an organization to evaluate its current state data management capabilities, discover gaps to remediate, and strengths to leverage. The assessment method reveals priorities, business needs, and a clear, rapid path for process improvements. This webinar will describe the DMM, its evolution, and illustrate its use as a roadmap guiding organizational data management improvements.
Takeaways:
Our profession is advancing its knowledge and has a wide spread basis for partnerships
New industry assessment standard is based on successful CMM/CMMI foundation
Clear need for data strategy
A clear and unambiguous call for participation
About the Speakers
Business process reengineering (BPR) involves fundamentally rethinking and radically redesigning business processes to achieve dramatic improvements in critical performance measures like cost, quality, service and speed. It focuses on how work is done, moving away from functional silos to a process view that cuts across organizational boundaries. BPR aims for breakthrough goals through fundamental changes that question existing structures and procedures, taking nothing for granted. Key steps in BPR include selecting processes for reengineering, understanding the current process, developing a vision for an improved process, identifying an action plan, and executing the plan. Common challenges include not making changes radical enough, over-reliance on the existing process, and failure to gain organizational commitment.
Data Quality - Standards and Application to Open DataMarco Torchiano
This document provides an overview of data quality standards and their application to open data. It discusses ISO standards for data quality, including ISO 25012 which defines a data quality model. Key data quality characteristics like accuracy, completeness, consistency and understandability are explained. The document also presents two case studies on open data quality: Open Coesione portal data in Italy and public contract data from Italian universities. Various data quality measures defined in ISO 25024 are calculated for the case studies, and findings around areas like traceability, metadata and decentralized vs centralized disclosure are discussed.
A transaction processing system (TPS) collects, stores, modifies, and retrieves data about business transactions. TPS are designed to efficiently process large volumes of routine transactions through automation. The objectives of a TPS are to accurately process transaction data, maintain data integrity, produce timely reports, and increase efficiency. A TPS has users within the owning organization and participants who conduct transactions. It uses either batch processing, where transactions are collected and processed in batches, or online transaction processing, where each transaction is immediately processed. The transaction processing cycle includes data collection, editing, correction, manipulation, storage, and document production.
The document discusses monitoring and evaluation of education programs for sustainable development. It aims to identify learning processes aligned with ESD and their contributions. Key learning processes include collaboration, engaging stakeholders, and active participation. ESD learning refers to gaining knowledge as well as learning critical thinking and envisioning positive futures. However, data on ESD processes and outcomes is limited. The review recommends improved data collection focusing on experiences rather than literature. More evidence is still needed to fully understand ESD's contributions to sustainable development.
Research, Monitoring and Evaluation, in Public Healthaghedogodday
This is a presentation on the overview of the role of monitoring and evaluation in public health. It describes the various components and how a robust M&E system can possitively impact the results or effectiveness of a public health intervention.
This presentation has a vivid description of the basics of doing a program evaluation, with detailed explanation of the " Log Frame work " ( LFA) with practical example from the CLICS project. This presentation also includes the CDC framework for evaluation of program.
N.B: Kindly open the ppt in slide share mode to fully use all the animations wheresoever made.
Collaborative 2 ingrid margarita and sandraSandra Guevara
This document provides guidance on project evaluation. It discusses what project evaluation is, its importance in project design and implementation, additional benefits like project improvement and capacity building. It outlines the planning, data collection, analysis, and reporting process for evaluations. Key steps include examining issues and objectives, establishing a team, identifying the purpose, focusing on improvement, assessing outcomes and impacts, and creating a report to synthesize findings. The goal is to help determine what is and is not working to improve the project.
Curriculum monitoring involves periodically assessing curriculum implementation and making adjustments. It determines how well the curriculum is working and informs decisions about retaining, improving, or modifying aspects. The document outlines the definition, rationale, types, roles, process, and similarities and differences between monitoring and evaluation. An effective monitoring system is simple, provides timely feedback, is cost-effective, flexible, accurate, comprehensive, relevant, and leads to learning. It involves clarifying roles, identifying evidence, data collection tools, training monitors, preparing staff, conducting monitoring, analyzing and sharing results, and determining a plan of action.
Theory-driven evaluation is an important approach in implementation science that focuses on mechanisms of change rather than just outcomes. It involves developing a program theory or theory of change that explains how a strategy is expected to work. A theory-driven evaluation then assesses whether the actual implementation and effects match the initial program theory. It aims to learn whether a strategy works, for whom, in what contexts, and how. This provides valuable information for improving strategies and assessing their transferability.
This document discusses developing logic models to focus program evaluations. It defines logic models and their components, and provides an example logic model for an education program to prevent HIV infection. Logic models describe the resources, activities, outputs, and short- and long-term outcomes of a program, helping evaluators design focused evaluation questions. The document emphasizes engaging stakeholders in developing the logic model and determining the evaluation's purpose and questions.
Monitoring and evaluation are important project management tools. Monitoring involves regularly collecting and analyzing information to track progress over time, while evaluation analyzes effectiveness and impact through making judgments about progress. Participatory monitoring and evaluation involves stakeholders jointly monitoring and evaluating activities. The main purposes of monitoring and evaluation are to assess results, improve management, promote learning, understand stakeholder perspectives, and ensure accountability.
The document outlines DataActiva's approach to program evaluation through 10 tasks:
1) Conduct start-up meetings to discuss the research plan and identify data sources
2) Design surveys for participants, non-participants, and stakeholders
3) Develop a sampling plan to collect necessary information from target groups
4) Collect accurate data from the samples through online/phone/in-person methods
5) Conduct a process evaluation through stakeholder interviews and customer surveys
6) Conduct an impact evaluation combining data sources to assess program effects
7) Reporting will describe methods, results, and provide an assessment of the program
Project monitoring and evaluation by Samuel Obino MokayaDiscover JKUAT
This document discusses project monitoring and evaluation. It defines monitoring as assessing project implementation against agreed schedules to identify successes and problems. Evaluation assesses a project's relevance, performance, impact and effectiveness. Several monitoring and evaluation tools are described, including reports, validation, participation and different types of evaluations. Good monitoring and evaluation provides feedback to improve projects and identify issues early. It should establish indicators and collect data through methods like interviews, observation and documentation review.
The document discusses research methodology. It defines methodology as the systematic process used to solve a research problem. It lists the key parts of methodology as the research design, sample size determination, sampling techniques, subjects, research instruments, validation of instruments, data gathering procedures, data processing methods, and statistical treatment. It explains the importance of methodology to customers, business partners, suppliers, and professionals. It also outlines some key characteristics of methodology such as rationale, aims, description, and tips for determining sample size.
Definations for Learning 24 July 2022 [Autosaved].pptxInayatUllah780749
1. M&E definitions provide explanations of key terms like monitoring, evaluation, and different types of evaluations such as formative, process, outcome, impact, and summative evaluations.
2. Different types of evaluations occur at various stages of a project and serve different purposes, such as improving project implementation, assessing progress, or evaluating overall impact.
3. Evaluating coherence considers how well a project's internal components and external partnerships support its goals, highlighting the importance of synergies within and beyond the project.
This document discusses evaluation principles, processes, components, and strategies for evaluating community health programs. It begins by defining evaluation and explaining that the community nurse evaluates community responses to health programs to measure progress towards goals and objectives. The evaluation process involves assessing implementation, short-term impacts, and long-term outcomes. Key components of evaluation include relevance, progress, cost-efficiency, effectiveness, and outcomes. The document then describes various evaluation strategies like case studies, surveys, experimental design, monitoring, and cost-benefit/cost-effectiveness analyses and how they can be useful for evaluation.
Monitoring and Evaluation for Project management.Muthuraj K
Monitoring and evaluation (M&E) is a set of techniques used in project management to establish controls and ensure a project stays on track to achieve its objectives. Monitoring involves systematically collecting, analyzing, and using information for management decisions and control. It provides information to identify and solve problems and assess progress. Evaluation determines the effectiveness, efficiency, relevance, impact, and sustainability of a project. Both monitoring and evaluation are important for project management and should be integrated throughout the project cycle.
Monitoring involves continuous assessment of project implementation to provide feedback and identify successes and problems. It focuses on schedules, inputs, and services. Evaluation assesses outcomes, impacts, effectiveness, and sustainability. The document discusses the importance of monitoring and evaluation for improving decision-making, achieving outcomes, and organizational learning. It provides definitions and comparisons of monitoring and evaluation. Participatory approaches are emphasized to empower stakeholders. Clear objectives and indicators are needed to measure progress.
This document discusses management-oriented evaluation approaches. It begins by stating that these approaches aim to serve decision makers by providing evaluation information to help with good decision making. It describes the CIPP model created by Stuffbeam which evaluates programs based on Context, Input, Process, and Product. The document also discusses other early evaluation models like the UCLA model. It notes strengths of the management approach include focusing evaluations and linking them to decision making. Potential limitations include the evaluator becoming too aligned with management or evaluations becoming too complex.
Process monitoring falls under program evaluation and assesses how program activities are implemented. It involves regularly tracking implementation through methods like reviewing reports and field observations. Process monitoring aims to improve efficiency and inform reprogramming. It answers questions about what is being done, by whom, for whom, how, when, and where. The information collected through process monitoring can then be used by managers, donors, governments, and communities to improve implementation and inform future programs. A successful process monitoring framework involves determining the purpose and uses of monitoring, developing measurable objectives, evaluation questions, collecting credible evidence, analyzing the information, and reporting findings.
At Lovely Professional University (LPU), the mess facilities are designed to provide students with nutritious and well-balanced meals. Some of the benefits of the LPU mess include:
Variety of Meals: The mess offers a wide variety of meals to cater to different tastes, including Indian, Continental, and regional cuisines. They also offer options for breakfast, lunch, dinner, and snacks.
Hygiene and Cleanliness: LPU places a strong emphasis on the cleanliness and hygiene of its mess. Regular cleaning of the dining areas and kitchen ensures a safe and healthy environment.
Nutrition: The meals are planned by nutrition experts to ensure they are balanced and meet the dietary requirements of students.
Affordable: The mess charges are relatively affordable, making it easier for students to access regular meals without spending too much. The cost is often included in the hostel fees.
Availability of Special Diets: For students with specific dietary needs (e.g., vegetarian, vegan, gluten-free, etc.), LPU offers customized meal options to accommodate various preferences.
24/7 Availability: In some hostels, students have access to food services 24/7, ensuring they are never left without food, especially for those with late-night study sessions.
Location and Accessibility: The mess is conveniently located near hostels and academic buildings, making it easy for students to grab a meal between classes or while in their rooms.
Cafeterias and Food Courts: Apart from the mess, there are multiple cafeterias and food courts on campus, offering a range of snacks, fast food, and beverages.
Slide Show Notes
OK, let’s try a short multiple choice quiz now to see how much you remember about the information presented in the previous slides. Click on the best answer—a or b—to complete each statement on the screen. Go ahead now. [PAUSE]
How did you do? Did you get all the answers right? Let’s take a couple of minutes to review.
The correct answer is b. While working on the computer, your elbows should be close to your body to prevent stress on the elbow joint.
The correct answer is a. Your computer monitor should be positioned in front of you. If it’s off to one side, you have to twist your neck all the time to see the screen, and eventually that’s going to cause an injury.
The correct answer is b. While you’re typing, your wrists should be straight and in line with the forearm. This is called the “neutral” position, and it helps prevent carpal tunnel syndrome.
The correct answer is b. Control the mouse with elbow movements. Using your wrist will place stravvvvvvvvvvvvvvvvvvvvvvvvvvvin on the nerves, blood vessels, and other soft tissues in the wrist.
Healthy Diet for Rabbits: The Ultimate Guide to Rabbit Nutrition.pptxcatherinemilan38
This PowerPoint presentation offers a clear, beginner-friendly overview of rabbit nutrition, focusing on practical tips for feeding rabbits a healthy, balanced diet. It covers the role of high-fiber hay, leafy greens, pellets, and water in daily care. With clean visuals and simple explanations, it highlights the dangers of poor diet and introduces essential nutrition needs to support a rabbit’s long-term health and well-being. Ideal for pet owners who want straightforward, professional advice with a visually engaging format.
FSSAI Act and its Food safety initiativesAarti Nimesh
The Food Safety and Standards Authority of India (FSSAI) is a statutory body established under the Food Safety and Standards Act, 2006, operating under the Ministry of Health and Family Welfare, Government of India. Its primary mandate is to ensure the availability of safe and wholesome food for human consumption across the country. FSSAI is responsible for framing science-based standards for food products and regulating their manufacture, storage, distribution, sale, and import. It plays a central role in monitoring and supervising food safety, issuing licenses and registrations to food business operators (FBOs), and conducting food testing through recognized laboratories.
To strengthen India’s food safety ecosystem, FSSAI has launched several impactful initiatives. The Eat Right India movement encourages citizens to make healthier food choices and promotes sustainable eating habits. The Food Fortification initiative supports the addition of essential micronutrients (like iron, vitamin A, and iodine) to common foods such as salt, flour, oil, and milk to combat malnutrition. Under the Clean Street Food Hub program, FSSAI collaborates with local authorities to improve hygiene standards among street food vendors. The Safe and Nutritious Food (SNF) campaign targets workplaces, schools, and homes to raise awareness about food safety and hygiene. Another notable program is RUCO (Repurpose Used Cooking Oil), which encourages safe disposal and conversion of used oil into biodiesel to prevent health hazards. FSSAI also operates FoSCoS (Food Safety Compliance System), a digital platform for streamlining licensing, registration, and compliance processes. Through these initiatives, FSSAI continues to work toward building a healthier and safer food environment in India.
The Food Safety and Standards Authority of India (FSSAI) is a statutory body established under the Food Safety and Standards Act, 2006, operating under the Ministry of Health and Family Welfare, Government of India. Its primary mandate is to ensure the availability of safe and wholesome food for human consumption across the country. FSSAI is responsible for framing science-based standards for food products and regulating their manufacture, storage, distribution, sale, and import. It plays a central role in monitoring and supervising food safety, issuing licenses and registrations to food business operators (FBOs), and conducting food testing through recognized laboratories.
To strengthen India’s food safety ecosystem, FSSAI has launched several impactful initiatives. The Eat Right India movement encourages citizens to make healthier food choices and promotes sustainable eating habits. The Food Fortification initiative supports the addition of essential micronutrients (like iron, vitamin A, and iodine) to common foods such as salt, flour, oil, and milk to combat malnutrition. Under the Clean Street Food Hub program.
Real-Time Grocery Price Monitoring for Zepto & Blinkit.pdfwebdata crawler
Explore how real-time grocery price monitoring tracks pricing on Zepto, Blinkit and other platforms to optimize pricing, improve margins, and stay competitive.
2. CONTENTS
Introduction
Importance of monitoring R&D activities
What is monitoring?
Techniques of monitoring the R&D activities
Peer review/Expert management
Bibliometric methods- Counts and citation analysis
Bibliometric methods- Data mining
Bibliometric methods- Hotspot analysis
Survey method
Technology commercialization tracking model
Network analysis
Case study method
More tools
Conclusion
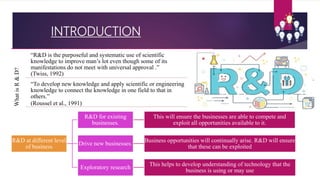
3. INTRODUCTION
WhatisR&D?
“R&D is the purposeful and systematic use of scientific
knowledge to improve man’s lot even though some of its
manifestations do not meet with universal approval .”
(Twiss, 1992)
“To develop new knowledge and apply scientific or engineering
knowledge to connect the knowledge in one field to that in
others.”
(Roussel et al., 1991)
R&D at different level
of business
R&D for existing
businesses.
This will ensure the businesses are able to compete and
exploit all opportunities available to it.
Drive new businesses.
Business opportunities will continually arise. R&D will ensure
that these can be exploited
Exploratory research
This helps to develop understanding of technology that the
business is using or may use
4. Defend, Support.
And Expand
Existing Business
Drive New
Business
Broaden/Deepen
Technological
Capability
R&D has three main strategic purposes to a business
The effective use of R&D naturally parallels the business cycle
for a product or industry
There are numerous Businesses R&D is into:
• Information and communication systems
• Electronic devices
• Power & Industrial systems
• Digital media & consumer products
• Logistic services
• Higher education institutes
• Medicine
• Food industries etc.
5. Goal of technology development R&D manager
To complete research objectives that lead to successfully commercialized technologies.
To continuously improve the program
To communicate effectively to others for benefitting the program
What is the need for monitoring?
Monitoring is a good management practice
It helps managers plan, verify, and communicate what they aim to do, decide how to allocate resources,
learn how best to modify or redesign programs, and estimate the resulting program outputs, outcomes,
and impacts.
Equip program managers with the information needed to improve their programs
To communicate effectively to others the full range of benefits from R&D efforts
It is a tool that not only helps measure a program’s success, but also contributes to its success.
6. IMPORTANCE OF MONITORING
R&D ACTIVITIES
Program managers may need to know:
If their research is done right (efficiency and quality of research)
If the program’s R&D efforts are focussed on the right research areas
How program-created knowledge finds varied applications that generate additional benefits to the nation
How collaborations and other activities stimulated by the program have affected nation’s R&D
capabilities.
How their programs are providing benefits to the users of resulting energy-saving and energy-producing
innovations.
How their programs are enhancing energy security by providing alternative energy sources, protecting
existing sources and having options ready for deployment if warranted by changing circumstances.
If their past efforts were worth it and if planned new initiatives will be worth it.
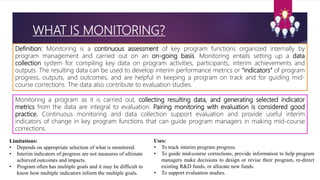
7. WHAT IS MONITORING?
Definition: Monitoring is a continuous assessment of key program functions organized internally by
program management and carried out on an on-going basis. Monitoring entails setting up a data
collection system for compiling key data on program activities, participants, interim achievements and
outputs. The resulting data can be used to develop interim performance metrics or “indicators” of program
progress, outputs, and outcomes, and are helpful in keeping a program on track and for guiding mid-
course corrections. The data also contribute to evaluation studies.
Monitoring a program as it is carried out, collecting resulting data, and generating selected indicator
metrics from the data are integral to evaluation. Pairing monitoring with evaluation is considered good
practice. Continuous monitoring and data collection support evaluation and provide useful interim
indicators of change in key program functions that can guide program managers in making mid-course
corrections.
Limitations:
• Depends on appropriate selection of what is monitored.
• Interim indicators of progress are not measures of ultimate
achieved outcomes and impacts.
• Program often has multiple goals and it may be difficult to
know how multiple indicators inform the multiple goals.
Uses:
• To track interim program progress.
• To guide mid-course corrections; provide information to help program
managers make decisions to design or revise their program, re-direct
existing R&D funds, or allocate new funds.
• To support evaluation studies.
8. How monitoring and data collection are organized
and conducted:
Developing a monitoring system with data collection and construction of indicators starts with review of the
program’s detailed logic model.
From the logic model, it is possible to identify key activities, expected program participants, expected outputs, and,
perhaps, some expected outcomes that are conducive to monitoring, such as number of technologies under
commercialization.
A closer look at projects or research activities that comprise a program or initiative reveals the technical goals,
against which progress can be tracked.
After deciding what to monitor, the next step is to establish the supporting data collection strategies, databases,
and information technology framework.
It is necessary that program management identify which indicator metrics will best provide interim guidance.
Often graphical depictions of the selected indicators are helpful in revealing trends in key program functions, and
in guiding mid-course corrections.
When evaluation studies are launched, the data collected through program monitoring tend to be invaluable.
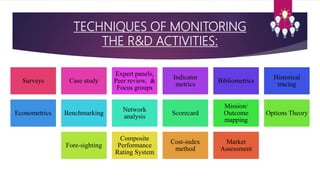
9. TECHNIQUES OF MONITORING
THE R&D ACTIVITIES:
Surveys Case study
Expert panels,
Peer review, &
Focus groups
Indicator
metrics
Bibliometrics
Historical
tracing
Econometrics Benchmarking
Network
analysis
Scorecard
Mission/
Outcome
mapping
Options Theory
Fore-sighting
Composite
Performance
Rating System
Cost-index
method
Market
Assessment
10. PEER REVIEW/ EXPERT JUDGEMENT
Definition: Peer Review/Expert Judgment is qualitative review, opinion, and advice from experts on the
subject being evaluated, based on objective criteria. The method combines program performance
information (provided to the experts) with the many years of cumulative experience of the subject-matter
experts, and focuses that informed expertise and experience on addressing key questions about a program,
initiative, project, proposal, paper, topic, or other subject of focus. While information from other sources,
including other methods of evaluation, may provide influential evidence, the ultimate conclusions about
performance are based on the judgment of the experts.
EERE’s Peer Review Guide (2004) defines in-progress peer review as:
A rigorous, formal, and documented evaluation process using objective criteria and qualified and
independent reviewers to make a judgment of the technical/ scientific/business merit, the actual or anticipated
results, and the productivity and management effectiveness of programs and/or projects.
11. How in-progress peer reviews are organized, conducted, and analyzed
• Peer Review Guide sets out minimum requirements for planning, conducting, and responding to peer
reviews.
• A primary requirement is that the reviews be independent both in fact and in terms of public
perception.
• This is achieved through having processes that are transparent and having third parties involved in the
selection of reviewers.
• To a large extent, the quality of the results depends upon the choice of qualified and independent
reviewers.
• In addition to being experts in the subject matter, reviewers should have no real or perceived conflict of
interest.
• Their judgments should be guided by the objective evaluation criteria, established prior to the review,
and should address the specific questions established for the review.
• When used to review an individual project or a collection of projects, peer review generally focuses on the
question “are we doing it right?” A program-level review will focus on the broader issue of “is the program
doing the right thing?”
12. • Used to answer a variety of questions throughout
the program performance cycle, as well as in other
applications.
• It is widely used by industry, government, and
academia. In practice, it ranges from a formal
process conducted according to strict protocol to
an informal process.
• It is used, for example, for support of strategic
planning decisions, selecting among projects and
programs, for in-progress project and program
review, for process assessment, for stage-gate
decisions, for merit review of papers for
publications, and for making judgments about
diverse topics, when supported by results from
application of other methods—the overall success
of a program.
Characteristics:
• Low-cost
• Fast-to-apply
• Widely accepted
• Versatile evaluation method
Uses:
• To conduct in-progress reviews of scientific quality
and productivity.
• To help answer questions about the relevancy,
timeliness, riskiness and management of existing
program research activities, and resource sufficiency
of new program initiatives.
• To score and rate projects under review to aid
decisions to continue, discontinue, or modify existing
or planned projects, programs, or program initiatives.
• To help assess appropriateness of program
mechanisms, processes, and activities and how they
might be strengthened.
• To integrate across multiple evaluation results and
render judgments about the overall success of a
program or program initiative.
Limitations:
• Steps may be needed to calibrate reviewer ratings
• Defining appropriate criteria
• Type of data needed for retrospective impact assessment cannot
be created in an expert review panel format
13. BIBLIOMETRIC METHODS-
COUNTS AND CITATION ANALYSIS
Definition: Counts of publications and patents are often used by R&D programs as indicators of program
knowledge outputs. Citation analysis of publications and patents is used to reveal relationships and linkages
between a program’s knowledge outputs and efforts undertaken by others. The frequency of citations may
signal the importance of a program’s knowledge outputs to others. Counts of publications and patents filed
are often included among an R&D program’s outputs, and measures of patents granted and citations of
publication and patents are often used in assessing an R&D program’s outcomes. Evaluators are increasingly
using patents and their citations as indicators of innovation, information flow, and value creation.
Bibliometric methods are used to show that knowledge has been created and disseminated, and to show
emergence of new ideas and development of relationships and patterns. These methods use text and text-
related materials to evaluate R&D programs. They are particularly relevant to R&D evaluation because the
output of research typically is knowledge, and knowledge is often expressed at least in part in reports,
publications, and patents.
14. How bibliometric studies of publication and patent counts and
citations are organized, conducted, and analyzed:
Tabulating counts of publications and patents is relatively straightforward.
These records are often routinely compiled by R&D organizations in their publication review and approval
and patent filing processes and captured in program performance monitoring systems.
Search engines may also be helpful in compiling data on publications and in making comparisons.
Citations analysis is generally performed as a forward search in time from an initial publication or patent
program output to downstream publications or patents which cite that produced by the program, but it
may also be performed backward to attribute current work to knowledge generated in the past by your
program or organization.
Uses:
• To provide measures of program knowledge outputs and evidence of outcome in the form of knowledge
dissemination and knowledge spillovers.
• To reveal linkages from Federal R&D to downstream outcomes.
• To identify users of a program’s knowledge and technology.
15. BIBLIOMETRIC METHODS- DATA MINING
Definition: Data mining is the extraction of key concepts or relationships from large quantities of digitized
natural language text. The method has also been called “literature-based discovery” (LBD), a descriptive
name. As in the case of the other bibliometric methods, this approach focuses on written documents--a
major output of research, and may include reports, publications, and textual components of patents or other
documents. Data mining enables the efficient and effective management and use of large volumes of R&D
texts by making it possible to integrate across document collections and to discover new information from
existing sources.
Data mining is a bibliometric method which searches texts for keywords to identify the origin of important
ideas and concepts. It is also used in evaluation to identify the emergence of relationships among research
organizations and disciplines.
16. How data mining studies are organized,
conducted, and analyzed:
Data mining studies are organized to automate searches of large volumes of information in order to
identify relationships and patterns of interest that would be slow, and difficult or impossible to find by
human analysts working without specialized tools.
Conducting a data mining study starts with the availability of subject texts in digital form; proceeds with
computer processing using various search and analysis algorithms to extract useful information, and
finishes with human analysis and interpretation of the results.
Databases of technical reports, such as a program’s database of its own reports and the many others that
now exist (including, for example, Science Citation Index, Engineering Compendex, Medline, NTIS Technical
Reports, and RaDiUS database) can provide sources of text.
Specialized data mining tools, developed and supplied by a variety of vendors, facilitate the processing
step; examples include WORDSTAT a data mining module for SIMSTAT, SPSS tools for data mining, SAS
data mining tools, among others.
Information visualization support, such as that provided by PNNL, added to data mining serves as a
valuable assist in gaining insight from the results.
17. Uses:
To show the origin of important ideas and concepts; more specifically to show that past investments in
R&D program contributed to emergent fields and technologies.
To show relationships among research organizations and disciplines.
To influence public S&T policy by providing decision makers insight into how cutting-edge technologies
develop from combinations of diverse research efforts over time.
To gather technical intelligence that may alert evaluators to developments in precursor, rival, or
complementary technologies affecting the impact of a technology of interest.
To provide information to help program managers make decisions to design or revise their program, re-
direct existing R&D funds, or allocate new funds.
To help guide investment decisions in R&D in emergent areas.
18. BIBLIOMETRICS- HOTSPOT PATENT ANALYSIS
Definition: Hotspot patent analysis identifies patents that are highly cited by recently issued patents. The
technique offers an unobtrusive and unbiased way to uncover technological “hotspot clusters,” i.e., patented
technologies that are currently having a large impact on innovation. According to recent studies,
approximately 2% of recent patents are designated hotspots. Old patents can also be hotspots if there is a
recent big spike in citations of them.
A recently developed, specialized application of patent analysis in bibliometrics is “Hotspot Patent Analysis,”
which looks at patenting frequency to identify patents that appear to be having a particularly large impact
on innovation and also “Next Generation Patents,” which are building on “Hotspot Clusters.” This analysis
helps to assess the relative importance of a program’s patents to technological innovation.
Limitations:
Issues with completeness and accuracy of data records
Interpretation of results and their implications for different R&D programs
19. Uses:
To identify current clusters of intensive innovative activity and developing “hot” trends in technology.
To assess the positioning of an R&D program’s output (as measured by patents and citations of the
agency’s publications by patents) relative to new and developing clusters of innovative activity.
To identify the regional impact of a public R&D program in order to better organize the program’s
outreach activities.
To analyze the organizational and collaborative characteristics of identified clusters of innovative activity.
To analyze hotspots in a selected technology area (e.g., fuels, alternative vehicles, etc.) in order to assess
how these hotspots and next generation patents are linked to an R&D program (e.g., EERE).
To gather competitive technical intelligence for R&D organizations.
To provide information to help program managers make decisions to design or revise their program, re-
direct existing R&D funds, or allocate new funds.
20. SURVEY METHOD
Definition: Survey is a method of obtaining information directly from people about their ideas, opinions,
attitudes, beliefs, preferences, concerns, plans, experiences, observations, and virtually any other issue. A
survey collects information by asking people questions and recording their responses. Surveys are often
used when the desired data are not available through other sources, but could be obtained by asking
people. Surveys are used in R&D evaluation for a variety of purposes, such as learning about a program’s
progress and effects; discovering the opinions of those participating in a program or using its outputs;
addressing stakeholder questions; and gathering information to supplement other sources of information.
A survey collects information by asking people questions—the answers to which can be expressed in terms
of statistics. This method is particularly useful for characterizing a program’s progress, learning more detailed
information about that progress, assessing customer satisfaction, and answering a variety of stakeholder
questions
21. How survey studies are organized,
conducted, and analyzed:
Given that surveys obtain information from people, it is necessary to decide which people and how many people
to ask; what to ask; how to structure the questions; when and how often to ask; and how to submit the
questions—all aspects of survey design.
Using samples reduces study costs, but if a sample is too small, it may not adequately represent the population
of people it is intended to represent.
A survey may be administered just once to a given group to obtain data as they exist at that time, in which case it
is “cross-sectional.” Alternatively, a survey may be administered to the same group of people at different times
to assess changes over time within the group, in which case it is “longitudinal.”
Alternatives for administering a survey include paper copies or computer disks, electronic copies sent via e-mail
or web-based, questions asked by an interviewer face-to-face or by telephone.
A balance must be struck between collecting needed data and avoiding being overly intrusive or imposing too
much burden. Survey data are commonly analyzed using descriptive statistics, such as counts, percentages,
averages, ranges, and measures of central tendency and measures of variation. Survey data may also be analyzed
to show relationships, to compare groups, and to determine trends and changes over time.
22. Uses:
To describe a program statistically.
To assess customer satisfaction.
To answer stakeholder questions about a program and its effects.
To support evaluation studies.
To provide information to help program managers make decisions to design or revise their program, re-
direct existing R&D funds, or allocate new funds.
Limitations:
Failure to adequately reflect the target population (due to weakness in survey design)
Individual responses are understood to be treated as confidential without the explicit agreement of the
respondent to the contrary.
23. TECHNOLOGY COMMERCIALIZATION
TRACKING MODEL
Definition: The technology commercialization tracking method tracks the new, energy-efficiency technologies
developed through R&D projects sponsored by the program and that may include research cost-shared with
industry. It classifies those technologies showing a requisite level of development, such as either “emerging,”
“commercially successful,” or “mature.” For example, a technology could be considered emerging when it is
thought to be within approximately one to three years of commercialization. It could be considered
commercially successful when full-scale commercial units of a technology have been made operational in
private industry and are available for sale. It could be considered mature once a commercially successful
technology has been in operation for 10 years or longer. It is considered a historical technology when it is no
longer being sold in the U.S. When a technology is emerging, preliminary information is collected. When a
technology is commercially successful, it is placed on the active tracking list and additional data are collected,
which are used to analyze benefits from program-sponsored R&D. Mature and historical technologies do not
need to be tracked.
24. Technology commercialization tracking involves monitoring technologies considered to be commercially
successful and their associated energy savings, economic and environmental benefits. Market and cost data is
used to estimate the cumulative net benefits of the program.
Uses:
To identify which projects funded by the program were commercialized and to what extent.
To provide documented evidence of the impact of program-sponsored technology development and
deployment efforts.
To estimate the cumulative net benefits of the program.
25. NETWORK ANALYSIS
Definition: This is a method of visually mapping and measuring relationships and linkages among
researchers, groups of researchers, laboratories, or other organizations. Network analysis is relevant to
evaluation of R&D programs because it identifies routes of interactions by which ideas, knowledge, and
information flow among participants in R&D, thereby possibly influencing the nature, quality, quantity, and
speed of research and innovation, as well as the dissemination of created knowledge through the network.
The underlying concept is that the conduct of science is a social activity collectively performed and
resulting in “communities of practice.” Advances in knowledge stem from knowledge sharing and
knowledge combining activities. Networks can link researchers to a rich flow of ideas and information. A
network of researchers creates a knowledge system that may yield much more than the individuals acting
independently. The network analysis method, which examines flows of knowledge into and through the
social network, is seen as a promising approach to understanding, predicting, and improving knowledge
outcomes. Network shape, size, and density can serve as indicators of the strength of communities of
practice and signal relative roles and relationships.
26. Limitations:
It does not provide a quantitative measure of its value.
Network diagram may be time limited
Costs can be a limiting factor in the use of network analysis
Network analysis, which shows linkages among researchers or organizations and how they develop over
time, is useful in assessing a program’s impact on collaboration and emerging roles and positions of
influence of researchers and organizations. While bibliometric methods show how knowledge is
disseminated via citing publications and patents, network analysis shows how knowledge particularly tacit
knowledge is disseminated via a variety of communication flows. Development of research networks is
significant because it is expected to increase research capabilities, progress, and impacts.
27. How network analysis studies are organized,
conducted, and analyzed:
To analyze results of network analysis, several measures are used.
1. One measure is of centrality, based on the number of direct links one node has to other nodes.
2. Another measure indicates the extent of influence a node has over flows in the network to other nodes.
3. A third measure indicates how closely linked a nodule is both directly and indirectly to all other nodules in
the network.
An entity in a network may be a “hub,” i.e., a node with a high degree of centrality and also important as a link to
other parts of the network. An entity may be a “peripheral player,” a node on the periphery of an identified
network. It may be a “boundary spanner,” a node connecting one network cluster to another.
“Clusters” may develop within networks, i.e., groups within the network connected through multiple links.
Analysis of networks can reveal areas of potential failure, such as the vulnerability of a highly centralized
network to the departure of a key researcher. It can also reveal areas of strength, such as clusters with connection
redundancies that make them less vulnerable to removal of single links or nodes
28. Uses:
To analyze the impact of R&D policies on collaborative activity.
To reveal dominant researchers or research organizations, and/or to assess the openness of networks to
members.
To improve understanding of how and why collaborations develop, what form they take, and their
To investigate and demonstrate the impact of an R&D program on applications by examining the flow of
knowledge among researchers, groups of researchers, and users.
To identify and foster emergent knowledge systems; to assess their strengths and weaknesses.
To highlight the importance to participants of intangible asset development, and to assess more fully
knowledge spillovers.
To provide information to help program managers make decisions to design or revise their program, re-
direct existing R&D funds, or allocate new funds.
29. CASE STUDY METHOD
Definition: The case study method presents information through a narrative about the subject, often with
supporting data displayed in tables and graphs. Case study is a method widely used by R&D programs for
evaluation, both to describe programs and how they work and to investigate underlying functional
relationships. One reason for its widespread use is that the narrative can often capture the richness of detail
and complexities of scientific research and development, particularly for a non-scientific audience, while
quantitative results can be often be provided with little additional effort.
Case studies use narratives supported by data to describe, explain, and explore phenomena and events.
Case studies are a particularly useful strategy for addressing how and why questions within a real-life
context. For example, case studies can be used to shed light on how innovation occurs, why certain
decisions are made, and why some processes work better than others.
30. How case studies are organized, conducted,
and analyzed:
There is no single format, rather there are a variety of formats or structures which may be used for writing
case-studies.
One format is the chronological structure, reflecting cases that cover events as sequences over time.
Descriptive case studies are often presented using key areas of information as subtopics, such as the origin
of a research idea, the source of technology, the role of government, estimated sales, etc.
Exploratory and explanatory case studies may present a series of hypotheses, followed by what the case or
cases show.
A linear-analytical structure is one of several other alternatives, whereby the purpose of the study is
followed by the methodology, the findings from information collected and analyzed, and then by conclusions.
31. Uses:
To explore the genesis of research ideas and their consequences.
To tell the stories of the people, organizations, projects, and programs involved in scientific pursuit.
To investigate underlying theories and explore process dynamics.
To answer specific what, why, and how questions.
To provide illustrative examples of how a program works.
To provide information to help program managers make decisions to design or revise their program, re-
direct existing R&D funds, or allocate new funds.
Limitations:
• Provides anecdotal evidence rather than quantitative evidence
• Less persuasive
32. THERE ARE MANY MORE TOOLS:
1. Econometric methods encompass a number of mathematical and statistical techniques that are used to
increase the rigor of estimation of economic relationships. Econometric methods are often used to
estimate program impacts.
2. The historical tracing method has been successfully used to trace highly successful commercial products
back to earlier DOE research. Showing these linkages helps to demonstrate the importance of past
research and suggests the potential importance of present research not yet incorporated in commercial
products.
3. Benchmarking means making comparisons to see how people, programs, organizations, regions, or
countries compare in terms of some aspect of their performance—to identify where and how to make
improvements.
33. 4. Benefit-cost case studies quantify positive and negative effects of a project, a cluster of projects, or a
program, and compare benefits against the costs using any of several measures. An essential feature of
this method is accounting for “additionality,” i.e., benefits and costs with the project, cluster of projects, or
program as compared with the benefits and costs without it. Benefit-cost analysis has a long history of
use in evaluating government projects.
5. Spillover analysis can be used to measure the surplus benefits to producers who use new and
improved technologies, the surplus benefits to consumers who buy goods and services incorporating the
new and improved technologies, the benefits to those in other industries who are able to use the
knowledge from the research without having paid for it, and the benefits realized by those whose
existing goods and services are increased in value due to complementarities of the new and improved
technologies. Spillover analysis reveals to a fuller extent the value to society of research and thereby is
important to avoiding underinvestment in research.
34. CONCLUSION
There is no single tool or technique that can handle the whole process to simultaneously shape, integrate
and monitor R&D strategy to support corporate strategy.
Peer review/expert judgment helps R&D managers learn how to design and redesign program elements
and processes, to select projects, to decide whether to continue or discontinue projects, and how best to
modify the research direction of the R&D portfolio.
Network analysis is useful for answering questions about a program’s impact on collaborative research
and the dissemination of knowledge particularly tacit knowledge.
Surveys are useful in answering a host of questions, such as how satisfied are the program’s customers
and how are customers using program outputs.
Citation analysis helps document the linkages between a program’s outputs and downstream users.
35. Economic case studies can estimate the benefits and costs of program outputs, including those
measurable in monetary terms and those more difficult to measure such as environmental effects and
energy security effects.
Benchmarking can help identify where and how to make improvements by comparing a program with its
counterparts abroad.
Econometric methods can help demonstrate that it was the program that caused an outcome and not
something else.
Using these and other methods can help a program manager better understand and manage his or her
program so as to achieve its goals, and obtain results needed to communicate achievements to others.
There is a need to join the best tools and techniques in a literature that can provide managers with an
overview of how to shape, integrate and monitor R&D strategy to successfully support strategy.
Editor's Notes
#5: Phillip A. Roussel. Third Generation R&D, Harvard business school, 19