SlideShare a Scribd company logo
Copyright © 2014, Oracle and/or its affiliates. All rights reserved. |
MySQL Troubleshooting with the 
Performance Schema 
Sveta Smirnova 
Senior Principal Technical Support Engineer 
Lig Isler-Turmelle 
Principle Technical Support Engineer 
MySQL Support 
September, 29, 2014 
Copyright © 2014, Oracle and/or its affiliates. AAllll rriigghhttss rreesseerrvveedd.. ||
Safe Harbor Statement 
The following is intended to outline our general product direction. It is 
intended for information purposes only, and may not be incorporated 
into any contract. It is not a commitment to deliver any material, code, 
or functionality, and should not be relied upon in making purchasing 
decisions. The development, release, and timing of any features or 
functionality described for Oracle’s products remains at the sole 
discretion of Oracle. 
Copyright © 2014, Oracle and/or its affiliates. All rights reserved. |
Copyright © 2014, Oracle and/or its affiliates. All rights reserved. | 
Program Agenda 
What will we teach you? 
Initial setup 
Topics 
Further studying 
1 
2 
3 
4
Copyright © 2014, Oracle and/or its affiliates. All rights reserved. | 
The topics 
Why are your slowest statements slow? 
Which internal operations are most involved? 
What happens inside the MySQL server? 
1 
2 
3
What will we teach you? 
Copyright © 2014, Oracle and/or its affiliates. All rights reserved. |
Performance Schema in MySQL 5.6 
• What is inside? 
– 52 tables 
– 554 instruments 
– 31 variables 
• What is it used for? 
– Overview of MySQL server performance 
• Bottlenecks in statements execution 
• Server-level and engine-level locks 
• More 
Copyright © 2014, Oracle and/or its affiliates. All rights reserved. | 
Checked with 5.6.20
With Performance Schema you can find 
• Which statements are less optimal 
• Which operations take most of the time 
• Which locks and mutexes are taken most often 
• Why users cannot connect from particular host 
• More 
Copyright © 2014, Oracle and/or its affiliates. All rights reserved. |
Today we will discuss 
• Statement bottlenecks 
• Threads in states which can be symptom of a problem 
• Most popular mutex issues 
• How to deal with MDL locks 
Copyright © 2014, Oracle and/or its affiliates. All rights reserved. |
Copyright © 2014, Oracle and/or its affiliates. All rights reserved. | 
Initial setup
Copyright © 2014, Oracle and/or its affiliates. All rights reserved. | 
Default P_S settings 
• It is ON by default 
• Only global and thread instrumentation is enabled 
• All other consumers are disabled
Default P_S settings 
mysql> select * from setup_consumers; 
+­­­­­­­­­­­­­­­­­­­­­­­­­­­­­­­­+ 
­­­­­­­­­+ 
| NAME | ENABLED | 
+­­­­­­­­­­­­­­­­­­­­­­­­­­­­­­­­+ 
­­­­­­­­­+ 
| events_stages_current | NO | 
| events_stages_history | NO | 
| events_stages_history_long | NO | 
| events_statements_current | YES | 
| events_statements_history | NO | 
... 
… 
| events_statements_history_long | NO | 
| events_waits_current | NO | 
| events_waits_history | NO | 
| events_waits_history_long | NO | 
| global_instrumentation | YES | 
| thread_instrumentation | YES | 
| statements_digest | YES | 
+­­­­­­­­­­­­­­­­­­­­­­­­­­­­­­­­+ 
­­­­­­­­­+ 
12 rows in set (0.00 sec) 
Copyright © 2014, Oracle and/or its affiliates. All rights reserved. |
Copyright © 2014, Oracle and/or its affiliates. All rights reserved. | 
We need 
• events_stages_* 
• events_statements_* 
• events_waits_* 
• Be careful! 
● They are memory and CPU intensive 
● Do not turn all of them them ON until needed
Copyright © 2014, Oracle and/or its affiliates. All rights reserved. | 
Prepare 
mysql> update performance_schema.setup_consumers  
set enabled='yes' where name like 'events_statements_%'; 
Query OK, 2 rows affected (0.00 sec) 
Rows matched: 3 Changed: 2 Warnings: 0 
mysql> update performance_schema.setup_consumers  
set enabled='yes' where name like 'events_waits_%'; 
Query OK, 3 rows affected (0.00 sec) 
Rows matched: 3 Changed: 3 Warnings: 0
Copyright © 2014, Oracle and/or its affiliates. All rights reserved. | 
Prepare 
mysql> update performance_schema.setup_consumers  
set enabled='yes' where name like 'events_stages_%'; 
Query OK, 3 rows affected (0.04 sec) 
Rows matched: 3 Changed: 3 Warnings: 0 
mysql> update performance_schema.setup_instruments  
set enabled='yes', timed='yes' where name like 'stage/%'; 
Query OK, 108 rows affected (0.02 sec) 
Rows matched: 108 Changed: 108 Warnings: 0
Copyright © 2014, Oracle and/or its affiliates. All rights reserved. | 
Test 
mysql> use test 
Database changed 
mysql> select * from 
performance_schema. 
events_statements_currentG 
************** 1. row ************** 
THREAD_ID: 10120 
EVENT_ID: 587 
END_EVENT_ID: NULL 
EVENT_NAME: 
statement/sql/select 
SOURCE: 
mysqld.cc:956 
TIMER_START: 
990311405368794000 
TIMER_END: NULL 
TIMER_WAIT: NULL 
LOCK_TIME: 104000000 
... 
SQL_TEXT: select 
* from performance_schema. 
events_statements_current 
DIGEST: NULL 
DIGEST_TEXT: NULL 
CURRENT_SCHEMA: test 
OBJECT_TYPE: NULL 
OBJECT_SCHEMA: NULL 
OBJECT_NAME: NULL 
OBJECT_INSTANCE_BEGIN: NULL 
MYSQL_ERRNO: 0 
RETURNED_SQLSTATE: NULL 
MESSAGE_TEXT: NULL 
ERRORS: 0 
WARNINGS: 0 
ROWS_AFFECTED: 0 
... 
ROWS_SENT: 0 
ROWS_EXAMINED: 0 
CREATED_TMP_DISK_TABLES: 0 
CREATED_TMP_TABLES: 0 
SELECT_FULL_JOIN: 0 
SELECT_FULL_RANGE_JOIN: 0 
SELECT_RANGE: 0 
SELECT_RANGE_CHECK: 0 
SELECT_SCAN: 1 
SORT_MERGE_PASSES: 0 
SORT_RANGE: 0 
SORT_ROWS: 0 
SORT_SCAN: 0 
NO_INDEX_USED: 1 
NO_GOOD_INDEX_USED: 0 
NESTING_EVENT_ID: NULL 
NESTING_EVENT_TYPE: NULL 
1 row in set (0.00 sec)
Why are your slowest statements slow? 
Copyright © 2014, Oracle and/or its affiliates. All rights reserved. |
Statements can be slow when 
• They examine more rows than return 
• They use disk instead of memory 
• They use temporary tables instead of index 
• There are more reasons 
Copyright © 2014, Oracle and/or its affiliates. All rights reserved. |
Copyright © 2014, Oracle and/or its affiliates. All rights reserved. | 
Example 1. 
Run example query 
$mysql employees 
… 
mysql > select count(emp_no) from employees join titles 
using(emp_no) where title = 'Senior Engineer'; 
+­­­­­­­­­­­­­­­+ 
| count(emp_no) | 
+­­­­­­­­­­­­­­­+ 
| 97750 | 
+­­­­­­­­­­­­­­­+ 
1 row in set (0.80 sec)
What about queries 
that examine too many rows? 
mysql> select THREAD_ID as TID, substr(SQL_TEXT, 1, 50) as 
SQL_TEXT, ROWS_SENT as RS, ROWS_EXAMINED as RE from 
performance_schema.events_statements_history_long where 
ROWS_EXAMINED > ROWS_SENT * 10 and SQL_TEXT like 'select%'G 
*************************** 1. row *************************** 
Copyright © 2014, Oracle and/or its affiliates. All rights reserved. | 
TID: 10124 
SQL_TEXT: select count(emp_no) from employees join titles us 
RS: 1 
RE: 397774 
...
events_statements_* 
Copyright © 2014, Oracle and/or its affiliates. All rights reserved. | 
What else is worth attention? 
• CREATED_TMP_DISK_TABLES 
• CREATED_TMP_TABLES 
• SELECT_FULL_JOIN 
• SELECT_RANGE_CHECK 
• SELECT_SCAN 
• SORT_MERGE_PASSES 
• SORT_SCAN 
• NO_INDEX_USED 
• NO_GOOD_INDEX_USED 
•
Copyright © 2014, Oracle and/or its affiliates. All rights reserved. | 
Example 2. 
Run example query 
mysql> select emp_no, first_name, last_name from employees join 
titles using(emp_no) where title = 'Senior Engineer'; 
… 
| 499964 | Randy | Matzov | 
| 499972 | Katsuo | Leuchs | 
| 499984 | Kaijung | Rodham | 
| 499996 | Zito | Baaz | 
| 499997 | Berhard | Lenart | 
+­­­­­­­­+ 
­­­­­­­­­­­­­­­­+ 
­­­­­­­­­­­­­­­­­­+ 
97750 rows in set (0.69 sec)
What about index usage? 
mysql> select THREAD_ID as TID, substr(SQL_TEXT, 1, 50) as SQL_TEXT, ROWS_SENT as RS,  
ROWS_EXAMINED as RE, CREATED_TMP_TABLES, NO_INDEX_USED, NO_GOOD_INDEX_USED  
from performance_schema.events_statements_history where NO_INDEX_USED=1  
or NO_GOOD_INDEX_USED=1G 
*************************** 1. row *************************** 
Copyright © 2014, Oracle and/or its affiliates. All rights reserved. | 
TID: 10124 
SQL_TEXT: select emp_no, first_name, last_name from employee 
RS: 97750 
RE: 397774 
CREATED_TMP_TABLES: 0 
NO_INDEX_USED: 1 
NO_GOOD_INDEX_USED: 0 
...
Easier? Database sys 
mysql> select query, total_latency, no_index_used_count, rows_sent, 
rows_examined from sys.statements_with_full_table_scans where 
db='employees' and query not like '%performance_schema%'G 
*************************** 1. row *************************** 
query: SELECT COUNT ( `emp_no` ) FROM ... `emp_no` ) 
Copyright © 2014, Oracle and/or its affiliates. All rights reserved. | 
WHERE `title` = ? 
total_latency: 805.37 ms 
no_index_used_count: 1 
rows_sent: 1 
rows_examined: 397774 
...
events_statements_* 
• statement_analysis 
• statements_with_runtimes_in_95th_percentile 
• statements_with_temp_tables 
• statements_with_sorting 
• statements_with_full_table_scans 
• statements_with_errors_or_warnings 
Copyright © 2014, Oracle and/or its affiliates. All rights reserved. | 
Database sys
Which internal operations are most involved? 
Copyright © 2014, Oracle and/or its affiliates. All rights reserved. |
Why do we need to care about internal 
operations? 
• They show why a query is running and did not return results 
yet 
• Watching stages can identify issues, not related to query 
itself, but badly affecting performance 
– A query is waiting for a lock 
– Network issues slow down result set retrieval 
– Slow disk does not allow to read rows faster 
–More 
Copyright © 2014, Oracle and/or its affiliates. All rights reserved. |
Copyright © 2014, Oracle and/or its affiliates. All rights reserved. | 
Example 3. 
Run example query 
mysql> select count(emp_no) from employees join  
salaries using(emp_no) where hire_date = from_date; 
+­­­­­­­­­­­­­­­+ 
| count(emp_no) | 
+­­­­­­­­­­­­­­­+ 
| 150291 | 
+­­­­­­­­­­­­­­­+ 
1 row in set (0.82 sec)
Which states took critically long time? 
mysql> select eshl.event_name, sql_text, eshl.timer_wait/1000000000000 
wait_s from performance_schema.events_stages_history_long eshl join 
performance_schema.events_statements_history_long esthl on 
(eshl.nesting_event_id = esthl.event_id) where eshl.timer_wait > 
1*10000000000G 
*************************** 1. row *************************** 
event_name: stage/sql/Sending data 
sql_text: select count(emp_no) from employees join salaries 
using(emp_no) where hire_date = from_date 
Copyright © 2014, Oracle and/or its affiliates. All rights reserved. | 
wait_s: 0.8170 
1 row in set (0.00 sec)
Copyright © 2014, Oracle and/or its affiliates. All rights reserved. | 
events_stages_* 
What else is worth attention? 
• Everything, related to temporary tables 
● EVENT_NAME LIKE 'stage/sql/%tmp%' 
• Everything, related to locks 
● EVENT_NAME LIKE 'stage/sql/%lock%' 
• Everything in state «Waiting for» 
● EVENT_NAME LIKE 'stage/%/Waiting for%' 
• Frequently met issues (from our experience in MySQL Support Team) 
● EVENT_NAME='stage/sql/end' 
● EVENT_NAME='stage/sql/freeing items' 
● EVENT_NAME='stage/sql/Sending data' 
● EVENT_NAME='stage/sql/cleaning up' 
● EVENT_NAME='stage/sql/closing tables'
What happens inside the MySQL server? 
Copyright © 2014, Oracle and/or its affiliates. All rights reserved. |
Performance Schema contains a lot of 
information about what is going on inside 
• Only information, available in 5.5 
• Hard to understand 
– If you are not C programmer 
– If you don't know MySQL source code by heart 
• We will teach you 
– How you can use of this information 
–Where you can find more human-readable details 
Copyright © 2014, Oracle and/or its affiliates. All rights reserved. |
Copyright © 2014, Oracle and/or its affiliates. All rights reserved. | 
Example 4. 
Prepare test 
mysql> create database sbtest; 
Query OK, 1 row affected (0.07 sec) 
$sysbench ­­mysql­user= 
root ­­mysql­password= 
oracle ­­test= 
oltp 
­­oltp­table­size= 
1000000 ­­db­driver= 
mysql prepare 
mysql> update performance_schema.setup_instruments set enabled='yes', 
timed='yes' where name like 'wait/%'; 
Query OK, 229 rows affected (0.02 sec) 
Rows matched: 277 Changed: 229 Warnings: 0 
mysql> truncate 
performance_schema.events_waits_summary_global_by_event_name; 
Query OK, 0 rows affected (0.00 sec)
Copyright © 2014, Oracle and/or its affiliates. All rights reserved. | 
Run some load 
$ sysbench ­­mysql­user= 
root ­­mysql­password= 
oracle ­­test= 
oltp 
­­num­threads= 
16 ­­db­driver= 
mysql run 
sysbench 0.4.12: multi­threaded 
system evaluation benchmark 
... 
Threads started! 
… 
Threads fairness: 
events (avg/stddev): 626.2500/3.23 
execution time (avg/stddev): 62.5864/0.03 
$
Copyright © 2014, Oracle and/or its affiliates. All rights reserved. | 
See what happened 
mysql> select EVENT_NAME, COUNT_STAR, AVG_TIMER_WAIT  
from performance_schema.events_waits_summary_global_by_event_name where count_star>0 order by count_star desc; 
+­­­­­­­­­­­­­­­­­­­­­­­­­­­­­­­­­­­­­­­­­+ 
­­­­­­­­­­­­+ 
­­­­­­­­­­­­­­­­+ 
| EVENT_NAME | COUNT_STAR | AVG_TIMER_WAIT | 
+­­­­­­­­­­­­­­­­­­­­­­­­­­­­­­­­­­­­­­­­­+ 
­­­­­­­­­­­­+ 
­­­­­­­­­­­­­­­­+ 
| wait/io/table/sql/handler | 4250176 | 9792048 | 
| wait/synch/mutex/sql/THD::LOCK_thd_data | 1214516 | 149382 | 
| wait/io/socket/sql/client_connection | 421690 | 20091686 | 
| wait/lock/table/sql/handler | 380912 | 497554 | 
| idle | 200081 | 10359000000 | 
| wait/synch/mutex/innodb/trx_mutex | 96441 | 84534 | 
| wait/synch/mutex/innodb/trx_undo_mutex | 50120 | 79130 | 
| wait/io/file/innodb/innodb_data_file | 3534 | 3486992374 | 
| wait/io/file/innodb/innodb_log_file | 2565 | 22204344288 | 
| wait/synch/rwlock/sql/MDL_lock::rwlock | 1 | 534224 | 
+­­­­­­­­­­­­­­­­­­­­­­­­­­­­­­­­­­­­­­­­­+ 
­­­­­­­­­­­­+ 
­­­­­­­­­­­­­­­­+ 
10 rows in set (0.02 sec)
Copyright © 2014, Oracle and/or its affiliates. All rights reserved. | 
What does it mean? 
mysql> select source from 
performance_schema.events_waits_current where 
event_name='wait/io/file/innodb/innodb_log_file'; 
+­­­­­­­­­­­­­­­­­+ 
| source | 
+­­­­­­­­­­­­­­­­­+ 
| fil0fil.cc:5886 | 
| fil0fil.cc:5692 | 
+­­­­­­­­­­­­­­­­­+ 
2 rows in set (0.00 sec)
Copyright © 2014, Oracle and/or its affiliates. All rights reserved. | 
What does it mean? 
$ cd $HOME/HOL/sample­data/ 
mysql­5.6.20 
$ cat ­n 
storage/innobase/fil/fil0fil.cc | grep ­E 
"588[[:digit:]]" 
5880 ut_a(node­> 
open); 
5881 file = node­> 
handle; 
5882 node­> 
n_pending_flushes++; 
5883 
5884 mutex_exit(&fil_system­> 
mutex); 
5885 
5886 os_file_flush(file); 
5887 
5888 mutex_enter(&fil_system­> 
mutex); 
IO
Copyright © 2014, Oracle and/or its affiliates. All rights reserved. | 
What does it mean? 
$ cat ­n 
storage/innobase/fil/fil0fil.cc | grep ­E 
"569[[:digit:]]" 
5690 /* Queue the aio request */ 
5691 ret = os_aio(type, mode | wake_later, node­> 
name, node­> 
handle, 
buf, 
5692 offset, len, node, message); 
5693 #endif /* UNIV_HOTBACKUP */ 
5694 ut_a(ret); 
IO 
5695 
5696 if (mode == OS_AIO_SYNC) { 
5697 /* The i/o operation is already completed when we return from 
5698 os_aio: */
Copyright © 2014, Oracle and/or its affiliates. All rights reserved. | 
Example 5. 
One more test 
mysql> CALL sys.ps_truncate_all_tables(false); 
+­­­­­­­­­­­­­­­­­­­­­+ 
| summary | 
+­­­­­­­­­­­­­­­­­­­­­+ 
| Truncated 31 tables | 
+­­­­­­­­­­­­­­­­­­­­­+ 
1 row in set (0.02 sec) 
Query OK, 0 rows affected (0.02 sec)
Copyright © 2014, Oracle and/or its affiliates. All rights reserved. | 
One more test 
mysql> use sbtest 
Reading table information for completion of table and 
column names 
You can turn off this feature to get a quicker startup 
with ­A 
Database changed 
mysql> alter table sbtest add key(c,pad); 
...
In parallel terminal window 
$ sysbench ­­mysql­user= 
root ­­mysql­password= 
oracle ­­test= 
oltp 
­­num­threads= 
16 ­­db­driver= 
mysql run 
sysbench 0.4.12: multi­threaded 
system evaluation benchmark 
... 
Threads started! 
… 
Threads fairness: 
events (avg/stddev): 625.7500/3.27 
execution time (avg/stddev): 141.6036/0.02 
Copyright © 2014, Oracle and/or its affiliates. All rights reserved. | 
$
Compare with previous result 
mysql> select EVENT_NAME, COUNT_STAR, AVG_TIMER_WAIT from 
performance_schema.events_waits_summary_global_by_event_name  
where count_star>0 order by avg_timer_wait desc, count_star desc; 
+­­­­­­­­­­­­­­­­­­­­­­­­­­­­­­­­­­­­­­­­­­­­­­­­­­­­­+ 
­­­­­­­­­­­­+ 
­­­­­­­­­­­­­­­­+ 
| EVENT_NAME | COUNT_STAR | AVG_TIMER_WAIT | 
+­­­­­­­­­­­­­­­­­­­­­­­­­­­­­­­­­­­­­­­­­­­­­­­­­­­­­+ 
­­­­­­­­­­­­+ 
­­­­­­­­­­­­­­­­+ 
| wait/synch/cond/sql/MDL_context::COND_wait_status | 17 | 453990564188 | 
| idle | 198053 | 56658000000 | 
| wait/io/file/innodb/innodb_log_file | 2876 | 45177967662 | 
| wait/io/file/innodb/innodb_temp_file | 3196 | 13644966830 | 
| wait/io/file/innodb/innodb_data_file | 32694 | 2927208612 | 
| wait/io/file/sql/FRM | 153 | 751453606 | 
| wait/synch/rwlock/innodb/index_tree_rw_lock | 1369436 | 83586370 | 
... 
Copyright © 2014, Oracle and/or its affiliates. All rights reserved. |
Even more information! 
mysql> select file, count_write, total_written from sys.io_global_by_file_by_bytes  
where count_write>0 order by count_write desc; 
+­­­­­­­­­­­­­­­­­­­­­­­­­­­­­­­­­­­­­­­­+ 
­­­­­­­­­­­­­+ 
­­­­­­­­­­­­­­­+ 
| file | count_write | total_written | 
+­­­­­­­­­­­­­­­­­­­­­­­­­­­­­­­­­­­­­­­­+ 
­­­­­­­­­­­­­+ 
­­­­­­­­­­­­­­­+ 
| @@datadir/sbtest/sbtest.ibd | 16830 | 479.53 MiB | 
| @@datadir/ibdata1 | 4072 | 372.44 MiB | 
| @@datadir/Innodb Merge Temp File | 1595 | 1.56 GiB | 
| @@datadir/ib_logfile0 | 1299 | 48.63 MiB | 
| @@datadir/ib_logfile1 | 140 | 2.79 MiB | 
| @@datadir/sbtest/#sql­1f8a_ 
27af.frm | 23 | 4.79 KiB | 
| @@datadir/mysql/innodb_index_stats.ibd | 1 | 16.00 KiB | 
| @@datadir/mysql/innodb_table_stats.ibd | 1 | 16.00 KiB | 
+­­­­­­­­­­­­­­­­­­­­­­­­­­­­­­­­­­­­­­­­+ 
­­­­­­­­­­­­­+ 
­­­­­­­­­­­­­­­+ 
8 rows in set (0.00 sec) 
Explains 
why ALTER 
is expensive 
Copyright © 2014, Oracle and/or its affiliates. All rights reserved. |
Copyright © 2014, Oracle and/or its affiliates. All rights reserved. | 
Further studying
Performance Schema in MySQL 5.7 
• MDL locks hunting 
– Not only information about transaction, waiting the lock, but also 
Copyright © 2014, Oracle and/or its affiliates. All rights reserved. | 
about one, holding the lock 
• Replication information 
• Information about transactions 
–Includes server-level 
• Memory usage 
–Database sys 
• More
MDL hunting before 5.7 
Only information about transaction waiting the lock: 
mysql> select processlist_id, mi.name, locked_by_thread_id 
from mutex_instances mi join threads on(locked_by_thread_id=thread_id) 
where locked_by_thread_id is not nullG 
******************* 1. row ******************* 
Copyright © 2014, Oracle and/or its affiliates. All rights reserved. | 
processlist_id: 4 
name: 
wait/synch/mutex/sql/MDL_wait::LOCK_wait_status 
locked_by_thread_id: 20 
1 row in set (0.02 sec)
MDL hunting before 5.7 
Can also be found in PROCESSLIST: 
mysql> select id, state, info from information_schema.processlistG 
******************** 1. row ******************** 
Copyright © 2014, Oracle and/or its affiliates. All rights reserved. | 
id: 4 
state: Waiting for table metadata lock 
info: alter table titles add column f1 int 
******************** 2. row ******************** 
id: 2 
state: executing 
info: select id, state, info from information_schema.processlist
Copyright © 2014, Oracle and/or its affiliates. All rights reserved. | 
MDL hunting in 5.7 
mysql> select processlist_id, object_type, lock_type, lock_status, source from metadata_locks join 
threads on 
(owner_thread_id=thread_id) where object_schema='employees' and object_name='titles'G 
*************************** 1. row *************************** 
processlist_id: 4 
object_type: TABLE 
lock_type: EXCLUSIVE 
lock_status: PENDING 
source: mdl.cc:3263 
*************************** 2. row *************************** 
processlist_id: 5 
object_type: TABLE 
lock_type: SHARED_READ 
lock_status: GRANTED 
source: sql_parse.cc:5707
PERFORMANCE_SCHEMA.REPLICATION_% tables 
Last_SQL_Error: Error 'Unknown table 'test.t1'' on query. Default database: 'test'. 
... 
mysql> select SERVICE_STATE, RECEIVED_TRANSACTION_SET, LAST_ERROR_NUMBER from 
replication_connection_statusG 
************************ 1. row ************************ 
Copyright © 2014, Oracle and/or its affiliates. All rights reserved. | 
SERVICE_STATE: ON 
RECEIVED_TRANSACTION_SET: 9fa18fb7­d6f2­11e3­bc7e­a088b4923078: 
1­12 
LAST_ERROR_NUMBER: 0 
1 row in set (0.00 sec) 
mysql> select * from replication_execute_statusG 
************************ 1. row ************************ 
SERVICE_STATE: OFF 
REMAINING_DELAY: NULL 
1 row in set (0.00 sec)
MySQL Central sessions 
• MySQL’s Performance Schema: New Features in 5.6 and 5.7 
[CON2222] 
• The MySQL sys Schema [CON3751] 
• MySQL 5.7: Performance and Scalability Benchmarks [CON5066] 
• Evolving the MySQL Server Architecture [CON2387] 
• Using MySQL Workbench Performance Tools [HOL9237] 
• MySQL Query Patterns, Optimized [CON5346] 
• MySQL Replication: What’s New in 5.7 and Beyond [CON5071] 
Copyright © 2014, Oracle and/or its affiliates. All rights reserved. |
You will find more information at 
• In the full version of these slides 
• http://marcalff.blogspot.ru 
• http://www.markleith.co.uk/ps_helper/ 
• http://dimitrik.free.fr/blog/ 
• http://www.slideshare.net/SvetaSmirnova/performance-schema-for-mysql-troubleshooting 
• http://dev.mysql.com/doc/refman/5.6/en/performance-schema.html 
Copyright © 2014, Oracle and/or its affiliates. All rights reserved. |
You will find authors of this Lab at 
• https://twitter.com/svetsmirnova 
• https://blogs.oracle.com/svetasmirnova/ 
• https://twitter.com/lig 
Copyright © 2014, Oracle and/or its affiliates. All rights reserved. |
Copyright © 2014, Oracle and/or its affiliates. All rights reserved. | 
Thank you!
Copyright © 2014, Oracle and/or its affiliates. All rights reserved. |

More Related Content

What's hot (20)

PDF
Performance schema and sys schema
Mark Leith
 
PDF
MySQL's Performance Schema, SYS Schema and Workbench Integration
Mario Beck
 
PDF
Troubleshooting MySQL Performance
Sveta Smirnova
 
PDF
MySQL for Oracle DBAs
Mark Leith
 
ODP
MySQL Monitoring Mechanisms
Mark Leith
 
PDF
Why Use EXPLAIN FORMAT=JSON?
Sveta Smirnova
 
ODP
Getting to Know MySQL Enterprise Monitor
Mark Leith
 
PDF
The MySQL Performance Schema & New SYS Schema
Ted Wennmark
 
ODP
MySQL Administration and Monitoring
Mark Leith
 
PDF
MySQL sys schema deep dive
Mark Leith
 
PDF
MySQL Performance schema missing_manual_flossuk
Valeriy Kravchuk
 
PDF
MySQL Performance Schema in Action
Sveta Smirnova
 
PPT
Understanding MySql locking issues
Om Vikram Thapa
 
PDF
Performance Schema for MySQL Troubleshooting
Sveta Smirnova
 
PDF
New features in Performance Schema 5.7 in action
Sveta Smirnova
 
PDF
Basic MySQL Troubleshooting for Oracle Database Administrators
Sveta Smirnova
 
PDF
In Memory Database In Action by Tanel Poder and Kerry Osborne
Enkitec
 
PPTX
DBA Commands and Concepts That Every Developer Should Know - Part 2
Alex Zaballa
 
PDF
Extending MySQL Enterprise Monitor
Mark Leith
 
PPT
MySQL 5.7: Performance Schema Improvements
Mark Leith
 
Performance schema and sys schema
Mark Leith
 
MySQL's Performance Schema, SYS Schema and Workbench Integration
Mario Beck
 
Troubleshooting MySQL Performance
Sveta Smirnova
 
MySQL for Oracle DBAs
Mark Leith
 
MySQL Monitoring Mechanisms
Mark Leith
 
Why Use EXPLAIN FORMAT=JSON?
Sveta Smirnova
 
Getting to Know MySQL Enterprise Monitor
Mark Leith
 
The MySQL Performance Schema & New SYS Schema
Ted Wennmark
 
MySQL Administration and Monitoring
Mark Leith
 
MySQL sys schema deep dive
Mark Leith
 
MySQL Performance schema missing_manual_flossuk
Valeriy Kravchuk
 
MySQL Performance Schema in Action
Sveta Smirnova
 
Understanding MySql locking issues
Om Vikram Thapa
 
Performance Schema for MySQL Troubleshooting
Sveta Smirnova
 
New features in Performance Schema 5.7 in action
Sveta Smirnova
 
Basic MySQL Troubleshooting for Oracle Database Administrators
Sveta Smirnova
 
In Memory Database In Action by Tanel Poder and Kerry Osborne
Enkitec
 
DBA Commands and Concepts That Every Developer Should Know - Part 2
Alex Zaballa
 
Extending MySQL Enterprise Monitor
Mark Leith
 
MySQL 5.7: Performance Schema Improvements
Mark Leith
 

Viewers also liked (20)

KEY
MySQL Performance - SydPHP October 2011
Graham Weldon
 
PDF
Performance Schema in MySQL (Danil Zburivsky)
Ontico
 
PDF
MySQL Oslayer performace optimization
Louis liu
 
PDF
An Overview to MySQL SYS Schema
Mydbops
 
ODP
MySQL Monitoring Mechanisms
Mark Leith
 
PDF
MySQL User Camp: MySQL Cluster
Shivji Kumar Jha
 
PDF
MySQL User Camp: GTIDs
Shivji Kumar Jha
 
PDF
Performance Schema for MySQL Troubleshooting
Sveta Smirnova
 
PDF
Open source India - MySQL Labs: Multi-Source Replication
Shivji Kumar Jha
 
PDF
Mysql tech day_paris_ps_and_sys
Mark Leith
 
PPTX
MySQL 5.7 New Features for Developers
Zohar Elkayam
 
PDF
MySQL Query Optimization.
Remote MySQL DBA
 
PDF
My sql 5.7-upcoming-changes-v2
Morgan Tocker
 
PDF
MySQL 5.6 - Operations and Diagnostics Improvements
Morgan Tocker
 
PDF
MySQL For Linux Sysadmins
Morgan Tocker
 
PDF
MySQL: Indexing for Better Performance
jkeriaki
 
PDF
Instrumenting plugins for Performance Schema
Mark Leith
 
PDF
Making the case for write-optimized database algorithms / Mark Callaghan (Fac...
Ontico
 
PDF
The InnoDB Storage Engine for MySQL
Morgan Tocker
 
PPT
MySQL Atchitecture and Concepts
Tuyen Vuong
 
MySQL Performance - SydPHP October 2011
Graham Weldon
 
Performance Schema in MySQL (Danil Zburivsky)
Ontico
 
MySQL Oslayer performace optimization
Louis liu
 
An Overview to MySQL SYS Schema
Mydbops
 
MySQL Monitoring Mechanisms
Mark Leith
 
MySQL User Camp: MySQL Cluster
Shivji Kumar Jha
 
MySQL User Camp: GTIDs
Shivji Kumar Jha
 
Performance Schema for MySQL Troubleshooting
Sveta Smirnova
 
Open source India - MySQL Labs: Multi-Source Replication
Shivji Kumar Jha
 
Mysql tech day_paris_ps_and_sys
Mark Leith
 
MySQL 5.7 New Features for Developers
Zohar Elkayam
 
MySQL Query Optimization.
Remote MySQL DBA
 
My sql 5.7-upcoming-changes-v2
Morgan Tocker
 
MySQL 5.6 - Operations and Diagnostics Improvements
Morgan Tocker
 
MySQL For Linux Sysadmins
Morgan Tocker
 
MySQL: Indexing for Better Performance
jkeriaki
 
Instrumenting plugins for Performance Schema
Mark Leith
 
Making the case for write-optimized database algorithms / Mark Callaghan (Fac...
Ontico
 
The InnoDB Storage Engine for MySQL
Morgan Tocker
 
MySQL Atchitecture and Concepts
Tuyen Vuong
 
Ad

Similar to MySQL Troubleshooting with the Performance Schema (20)

PPTX
MySQL Performance Schema : fossasia
Mayank Prasad
 
PDF
MySQL Performance Schema in Action
Sveta Smirnova
 
PDF
MySQL Performance Schema in Action
Sveta Smirnova
 
PDF
MySQL Performance Schema in Action: the Complete Tutorial
Sveta Smirnova
 
PDF
MySQL Performance Schema in 20 Minutes
Sveta Smirnova
 
PPTX
MySQL performance tuning
Anurag Srivastava
 
PDF
RivieraJUG - MySQL Indexes and Histograms
Frederic Descamps
 
PDF
Open Source 101 2022 - MySQL Indexes and Histograms
Frederic Descamps
 
PDF
How to analyze and tune sql queries for better performance vts2016
oysteing
 
PPTX
MySQL Performance Schema in MySQL 8.0
Mayank Prasad
 
PDF
20150110 my sql-performanceschema
Ivan Ma
 
PDF
Performance Schema for MySQL Troubleshooting
Sveta Smirnova
 
PDF
How to Analyze and Tune MySQL Queries for Better Performance
oysteing
 
PPTX
MySQL Performance Schema, Open Source India, 2015
Mayank Prasad
 
ODP
Performance schema and_ps_helper
Mark Leith
 
PDF
sveta smirnova - my sql performance schema in action
Dariia Seimova
 
PDF
Performance Schema in Action: demo
Sveta Smirnova
 
DOCX
Performence tuning
Vasudeva Rao
 
PPTX
Mysql Performance Schema - fossasia 2016
Mayank Prasad
 
PDF
How to analyze and tune sql queries for better performance
oysteing
 
MySQL Performance Schema : fossasia
Mayank Prasad
 
MySQL Performance Schema in Action
Sveta Smirnova
 
MySQL Performance Schema in Action
Sveta Smirnova
 
MySQL Performance Schema in Action: the Complete Tutorial
Sveta Smirnova
 
MySQL Performance Schema in 20 Minutes
Sveta Smirnova
 
MySQL performance tuning
Anurag Srivastava
 
RivieraJUG - MySQL Indexes and Histograms
Frederic Descamps
 
Open Source 101 2022 - MySQL Indexes and Histograms
Frederic Descamps
 
How to analyze and tune sql queries for better performance vts2016
oysteing
 
MySQL Performance Schema in MySQL 8.0
Mayank Prasad
 
20150110 my sql-performanceschema
Ivan Ma
 
Performance Schema for MySQL Troubleshooting
Sveta Smirnova
 
How to Analyze and Tune MySQL Queries for Better Performance
oysteing
 
MySQL Performance Schema, Open Source India, 2015
Mayank Prasad
 
Performance schema and_ps_helper
Mark Leith
 
sveta smirnova - my sql performance schema in action
Dariia Seimova
 
Performance Schema in Action: demo
Sveta Smirnova
 
Performence tuning
Vasudeva Rao
 
Mysql Performance Schema - fossasia 2016
Mayank Prasad
 
How to analyze and tune sql queries for better performance
oysteing
 
Ad

More from Sveta Smirnova (20)

PDF
War Story: Removing Offensive Language from Percona Toolkit
Sveta Smirnova
 
PDF
MySQL 2024: Зачем переходить на MySQL 8, если в 5.х всё устраивает?
Sveta Smirnova
 
PDF
Database in Kubernetes: Diagnostics and Monitoring
Sveta Smirnova
 
PDF
MySQL Database Monitoring: Must, Good and Nice to Have
Sveta Smirnova
 
PDF
MySQL Cookbook: Recipes for Developers
Sveta Smirnova
 
PDF
MySQL Performance for DevOps
Sveta Smirnova
 
PDF
MySQL Test Framework для поддержки клиентов и верификации багов
Sveta Smirnova
 
PDF
MySQL Cookbook: Recipes for Your Business
Sveta Smirnova
 
PDF
Introduction into MySQL Query Tuning for Dev[Op]s
Sveta Smirnova
 
PDF
Производительность MySQL для DevOps
Sveta Smirnova
 
PDF
MySQL Performance for DevOps
Sveta Smirnova
 
PDF
How to Avoid Pitfalls in Schema Upgrade with Percona XtraDB Cluster
Sveta Smirnova
 
PDF
How to migrate from MySQL to MariaDB without tears
Sveta Smirnova
 
PDF
Modern solutions for modern database load: improvements in the latest MariaDB...
Sveta Smirnova
 
PDF
How Safe is Asynchronous Master-Master Setup?
Sveta Smirnova
 
PDF
Современному хайлоду - современные решения: MySQL 8.0 и улучшения Percona
Sveta Smirnova
 
PDF
How to Avoid Pitfalls in Schema Upgrade with Galera
Sveta Smirnova
 
PDF
How Safe is Asynchronous Master-Master Setup?
Sveta Smirnova
 
PDF
Introduction to MySQL Query Tuning for Dev[Op]s
Sveta Smirnova
 
PDF
Billion Goods in Few Categories: How Histograms Save a Life?
Sveta Smirnova
 
War Story: Removing Offensive Language from Percona Toolkit
Sveta Smirnova
 
MySQL 2024: Зачем переходить на MySQL 8, если в 5.х всё устраивает?
Sveta Smirnova
 
Database in Kubernetes: Diagnostics and Monitoring
Sveta Smirnova
 
MySQL Database Monitoring: Must, Good and Nice to Have
Sveta Smirnova
 
MySQL Cookbook: Recipes for Developers
Sveta Smirnova
 
MySQL Performance for DevOps
Sveta Smirnova
 
MySQL Test Framework для поддержки клиентов и верификации багов
Sveta Smirnova
 
MySQL Cookbook: Recipes for Your Business
Sveta Smirnova
 
Introduction into MySQL Query Tuning for Dev[Op]s
Sveta Smirnova
 
Производительность MySQL для DevOps
Sveta Smirnova
 
MySQL Performance for DevOps
Sveta Smirnova
 
How to Avoid Pitfalls in Schema Upgrade with Percona XtraDB Cluster
Sveta Smirnova
 
How to migrate from MySQL to MariaDB without tears
Sveta Smirnova
 
Modern solutions for modern database load: improvements in the latest MariaDB...
Sveta Smirnova
 
How Safe is Asynchronous Master-Master Setup?
Sveta Smirnova
 
Современному хайлоду - современные решения: MySQL 8.0 и улучшения Percona
Sveta Smirnova
 
How to Avoid Pitfalls in Schema Upgrade with Galera
Sveta Smirnova
 
How Safe is Asynchronous Master-Master Setup?
Sveta Smirnova
 
Introduction to MySQL Query Tuning for Dev[Op]s
Sveta Smirnova
 
Billion Goods in Few Categories: How Histograms Save a Life?
Sveta Smirnova
 

Recently uploaded (20)

PDF
Alarm in Android-Scheduling Timed Tasks Using AlarmManager in Android.pdf
Nabin Dhakal
 
PDF
Wondershare PDFelement Pro Crack for MacOS New Version Latest 2025
bashirkhan333g
 
PDF
4K Video Downloader Plus Pro Crack for MacOS New Download 2025
bashirkhan333g
 
PDF
SAP Firmaya İade ABAB Kodları - ABAB ile yazılmıl hazır kod örneği
Salih Küçük
 
PDF
Thread In Android-Mastering Concurrency for Responsive Apps.pdf
Nabin Dhakal
 
PDF
SciPy 2025 - Packaging a Scientific Python Project
Henry Schreiner
 
PPTX
Migrating Millions of Users with Debezium, Apache Kafka, and an Acyclic Synch...
MD Sayem Ahmed
 
PPTX
Tally_Basic_Operations_Presentation.pptx
AditiBansal54083
 
PDF
Why Businesses Are Switching to Open Source Alternatives to Crystal Reports.pdf
Varsha Nayak
 
PPTX
OpenChain @ OSS NA - In From the Cold: Open Source as Part of Mainstream Soft...
Shane Coughlan
 
PDF
Digger Solo: Semantic search and maps for your local files
seanpedersen96
 
PDF
The 5 Reasons for IT Maintenance - Arna Softech
Arna Softech
 
PDF
Alexander Marshalov - How to use AI Assistants with your Monitoring system Q2...
VictoriaMetrics
 
PDF
Generic or Specific? Making sensible software design decisions
Bert Jan Schrijver
 
PDF
Open Chain Q2 Steering Committee Meeting - 2025-06-25
Shane Coughlan
 
PPTX
Hardware(Central Processing Unit ) CU and ALU
RizwanaKalsoom2
 
PDF
Online Queue Management System for Public Service Offices in Nepal [Focused i...
Rishab Acharya
 
PPTX
Agentic Automation Journey Series Day 2 – Prompt Engineering for UiPath Agents
klpathrudu
 
PDF
Download Canva Pro 2025 PC Crack Full Latest Version
bashirkhan333g
 
PPTX
AEM User Group: India Chapter Kickoff Meeting
jennaf3
 
Alarm in Android-Scheduling Timed Tasks Using AlarmManager in Android.pdf
Nabin Dhakal
 
Wondershare PDFelement Pro Crack for MacOS New Version Latest 2025
bashirkhan333g
 
4K Video Downloader Plus Pro Crack for MacOS New Download 2025
bashirkhan333g
 
SAP Firmaya İade ABAB Kodları - ABAB ile yazılmıl hazır kod örneği
Salih Küçük
 
Thread In Android-Mastering Concurrency for Responsive Apps.pdf
Nabin Dhakal
 
SciPy 2025 - Packaging a Scientific Python Project
Henry Schreiner
 
Migrating Millions of Users with Debezium, Apache Kafka, and an Acyclic Synch...
MD Sayem Ahmed
 
Tally_Basic_Operations_Presentation.pptx
AditiBansal54083
 
Why Businesses Are Switching to Open Source Alternatives to Crystal Reports.pdf
Varsha Nayak
 
OpenChain @ OSS NA - In From the Cold: Open Source as Part of Mainstream Soft...
Shane Coughlan
 
Digger Solo: Semantic search and maps for your local files
seanpedersen96
 
The 5 Reasons for IT Maintenance - Arna Softech
Arna Softech
 
Alexander Marshalov - How to use AI Assistants with your Monitoring system Q2...
VictoriaMetrics
 
Generic or Specific? Making sensible software design decisions
Bert Jan Schrijver
 
Open Chain Q2 Steering Committee Meeting - 2025-06-25
Shane Coughlan
 
Hardware(Central Processing Unit ) CU and ALU
RizwanaKalsoom2
 
Online Queue Management System for Public Service Offices in Nepal [Focused i...
Rishab Acharya
 
Agentic Automation Journey Series Day 2 – Prompt Engineering for UiPath Agents
klpathrudu
 
Download Canva Pro 2025 PC Crack Full Latest Version
bashirkhan333g
 
AEM User Group: India Chapter Kickoff Meeting
jennaf3
 

MySQL Troubleshooting with the Performance Schema

  • 1. Copyright © 2014, Oracle and/or its affiliates. All rights reserved. |
  • 2. MySQL Troubleshooting with the Performance Schema Sveta Smirnova Senior Principal Technical Support Engineer Lig Isler-Turmelle Principle Technical Support Engineer MySQL Support September, 29, 2014 Copyright © 2014, Oracle and/or its affiliates. AAllll rriigghhttss rreesseerrvveedd.. ||
  • 3. Safe Harbor Statement The following is intended to outline our general product direction. It is intended for information purposes only, and may not be incorporated into any contract. It is not a commitment to deliver any material, code, or functionality, and should not be relied upon in making purchasing decisions. The development, release, and timing of any features or functionality described for Oracle’s products remains at the sole discretion of Oracle. Copyright © 2014, Oracle and/or its affiliates. All rights reserved. |
  • 4. Copyright © 2014, Oracle and/or its affiliates. All rights reserved. | Program Agenda What will we teach you? Initial setup Topics Further studying 1 2 3 4
  • 5. Copyright © 2014, Oracle and/or its affiliates. All rights reserved. | The topics Why are your slowest statements slow? Which internal operations are most involved? What happens inside the MySQL server? 1 2 3
  • 6. What will we teach you? Copyright © 2014, Oracle and/or its affiliates. All rights reserved. |
  • 7. Performance Schema in MySQL 5.6 • What is inside? – 52 tables – 554 instruments – 31 variables • What is it used for? – Overview of MySQL server performance • Bottlenecks in statements execution • Server-level and engine-level locks • More Copyright © 2014, Oracle and/or its affiliates. All rights reserved. | Checked with 5.6.20
  • 8. With Performance Schema you can find • Which statements are less optimal • Which operations take most of the time • Which locks and mutexes are taken most often • Why users cannot connect from particular host • More Copyright © 2014, Oracle and/or its affiliates. All rights reserved. |
  • 9. Today we will discuss • Statement bottlenecks • Threads in states which can be symptom of a problem • Most popular mutex issues • How to deal with MDL locks Copyright © 2014, Oracle and/or its affiliates. All rights reserved. |
  • 10. Copyright © 2014, Oracle and/or its affiliates. All rights reserved. | Initial setup
  • 11. Copyright © 2014, Oracle and/or its affiliates. All rights reserved. | Default P_S settings • It is ON by default • Only global and thread instrumentation is enabled • All other consumers are disabled
  • 12. Default P_S settings mysql> select * from setup_consumers; +­­­­­­­­­­­­­­­­­­­­­­­­­­­­­­­­+ ­­­­­­­­­+ | NAME | ENABLED | +­­­­­­­­­­­­­­­­­­­­­­­­­­­­­­­­+ ­­­­­­­­­+ | events_stages_current | NO | | events_stages_history | NO | | events_stages_history_long | NO | | events_statements_current | YES | | events_statements_history | NO | ... … | events_statements_history_long | NO | | events_waits_current | NO | | events_waits_history | NO | | events_waits_history_long | NO | | global_instrumentation | YES | | thread_instrumentation | YES | | statements_digest | YES | +­­­­­­­­­­­­­­­­­­­­­­­­­­­­­­­­+ ­­­­­­­­­+ 12 rows in set (0.00 sec) Copyright © 2014, Oracle and/or its affiliates. All rights reserved. |
  • 13. Copyright © 2014, Oracle and/or its affiliates. All rights reserved. | We need • events_stages_* • events_statements_* • events_waits_* • Be careful! ● They are memory and CPU intensive ● Do not turn all of them them ON until needed
  • 14. Copyright © 2014, Oracle and/or its affiliates. All rights reserved. | Prepare mysql> update performance_schema.setup_consumers set enabled='yes' where name like 'events_statements_%'; Query OK, 2 rows affected (0.00 sec) Rows matched: 3 Changed: 2 Warnings: 0 mysql> update performance_schema.setup_consumers set enabled='yes' where name like 'events_waits_%'; Query OK, 3 rows affected (0.00 sec) Rows matched: 3 Changed: 3 Warnings: 0
  • 15. Copyright © 2014, Oracle and/or its affiliates. All rights reserved. | Prepare mysql> update performance_schema.setup_consumers set enabled='yes' where name like 'events_stages_%'; Query OK, 3 rows affected (0.04 sec) Rows matched: 3 Changed: 3 Warnings: 0 mysql> update performance_schema.setup_instruments set enabled='yes', timed='yes' where name like 'stage/%'; Query OK, 108 rows affected (0.02 sec) Rows matched: 108 Changed: 108 Warnings: 0
  • 16. Copyright © 2014, Oracle and/or its affiliates. All rights reserved. | Test mysql> use test Database changed mysql> select * from performance_schema. events_statements_currentG ************** 1. row ************** THREAD_ID: 10120 EVENT_ID: 587 END_EVENT_ID: NULL EVENT_NAME: statement/sql/select SOURCE: mysqld.cc:956 TIMER_START: 990311405368794000 TIMER_END: NULL TIMER_WAIT: NULL LOCK_TIME: 104000000 ... SQL_TEXT: select * from performance_schema. events_statements_current DIGEST: NULL DIGEST_TEXT: NULL CURRENT_SCHEMA: test OBJECT_TYPE: NULL OBJECT_SCHEMA: NULL OBJECT_NAME: NULL OBJECT_INSTANCE_BEGIN: NULL MYSQL_ERRNO: 0 RETURNED_SQLSTATE: NULL MESSAGE_TEXT: NULL ERRORS: 0 WARNINGS: 0 ROWS_AFFECTED: 0 ... ROWS_SENT: 0 ROWS_EXAMINED: 0 CREATED_TMP_DISK_TABLES: 0 CREATED_TMP_TABLES: 0 SELECT_FULL_JOIN: 0 SELECT_FULL_RANGE_JOIN: 0 SELECT_RANGE: 0 SELECT_RANGE_CHECK: 0 SELECT_SCAN: 1 SORT_MERGE_PASSES: 0 SORT_RANGE: 0 SORT_ROWS: 0 SORT_SCAN: 0 NO_INDEX_USED: 1 NO_GOOD_INDEX_USED: 0 NESTING_EVENT_ID: NULL NESTING_EVENT_TYPE: NULL 1 row in set (0.00 sec)
  • 17. Why are your slowest statements slow? Copyright © 2014, Oracle and/or its affiliates. All rights reserved. |
  • 18. Statements can be slow when • They examine more rows than return • They use disk instead of memory • They use temporary tables instead of index • There are more reasons Copyright © 2014, Oracle and/or its affiliates. All rights reserved. |
  • 19. Copyright © 2014, Oracle and/or its affiliates. All rights reserved. | Example 1. Run example query $mysql employees … mysql > select count(emp_no) from employees join titles using(emp_no) where title = 'Senior Engineer'; +­­­­­­­­­­­­­­­+ | count(emp_no) | +­­­­­­­­­­­­­­­+ | 97750 | +­­­­­­­­­­­­­­­+ 1 row in set (0.80 sec)
  • 20. What about queries that examine too many rows? mysql> select THREAD_ID as TID, substr(SQL_TEXT, 1, 50) as SQL_TEXT, ROWS_SENT as RS, ROWS_EXAMINED as RE from performance_schema.events_statements_history_long where ROWS_EXAMINED > ROWS_SENT * 10 and SQL_TEXT like 'select%'G *************************** 1. row *************************** Copyright © 2014, Oracle and/or its affiliates. All rights reserved. | TID: 10124 SQL_TEXT: select count(emp_no) from employees join titles us RS: 1 RE: 397774 ...
  • 21. events_statements_* Copyright © 2014, Oracle and/or its affiliates. All rights reserved. | What else is worth attention? • CREATED_TMP_DISK_TABLES • CREATED_TMP_TABLES • SELECT_FULL_JOIN • SELECT_RANGE_CHECK • SELECT_SCAN • SORT_MERGE_PASSES • SORT_SCAN • NO_INDEX_USED • NO_GOOD_INDEX_USED •
  • 22. Copyright © 2014, Oracle and/or its affiliates. All rights reserved. | Example 2. Run example query mysql> select emp_no, first_name, last_name from employees join titles using(emp_no) where title = 'Senior Engineer'; … | 499964 | Randy | Matzov | | 499972 | Katsuo | Leuchs | | 499984 | Kaijung | Rodham | | 499996 | Zito | Baaz | | 499997 | Berhard | Lenart | +­­­­­­­­+ ­­­­­­­­­­­­­­­­+ ­­­­­­­­­­­­­­­­­­+ 97750 rows in set (0.69 sec)
  • 23. What about index usage? mysql> select THREAD_ID as TID, substr(SQL_TEXT, 1, 50) as SQL_TEXT, ROWS_SENT as RS, ROWS_EXAMINED as RE, CREATED_TMP_TABLES, NO_INDEX_USED, NO_GOOD_INDEX_USED from performance_schema.events_statements_history where NO_INDEX_USED=1 or NO_GOOD_INDEX_USED=1G *************************** 1. row *************************** Copyright © 2014, Oracle and/or its affiliates. All rights reserved. | TID: 10124 SQL_TEXT: select emp_no, first_name, last_name from employee RS: 97750 RE: 397774 CREATED_TMP_TABLES: 0 NO_INDEX_USED: 1 NO_GOOD_INDEX_USED: 0 ...
  • 24. Easier? Database sys mysql> select query, total_latency, no_index_used_count, rows_sent, rows_examined from sys.statements_with_full_table_scans where db='employees' and query not like '%performance_schema%'G *************************** 1. row *************************** query: SELECT COUNT ( `emp_no` ) FROM ... `emp_no` ) Copyright © 2014, Oracle and/or its affiliates. All rights reserved. | WHERE `title` = ? total_latency: 805.37 ms no_index_used_count: 1 rows_sent: 1 rows_examined: 397774 ...
  • 25. events_statements_* • statement_analysis • statements_with_runtimes_in_95th_percentile • statements_with_temp_tables • statements_with_sorting • statements_with_full_table_scans • statements_with_errors_or_warnings Copyright © 2014, Oracle and/or its affiliates. All rights reserved. | Database sys
  • 26. Which internal operations are most involved? Copyright © 2014, Oracle and/or its affiliates. All rights reserved. |
  • 27. Why do we need to care about internal operations? • They show why a query is running and did not return results yet • Watching stages can identify issues, not related to query itself, but badly affecting performance – A query is waiting for a lock – Network issues slow down result set retrieval – Slow disk does not allow to read rows faster –More Copyright © 2014, Oracle and/or its affiliates. All rights reserved. |
  • 28. Copyright © 2014, Oracle and/or its affiliates. All rights reserved. | Example 3. Run example query mysql> select count(emp_no) from employees join salaries using(emp_no) where hire_date = from_date; +­­­­­­­­­­­­­­­+ | count(emp_no) | +­­­­­­­­­­­­­­­+ | 150291 | +­­­­­­­­­­­­­­­+ 1 row in set (0.82 sec)
  • 29. Which states took critically long time? mysql> select eshl.event_name, sql_text, eshl.timer_wait/1000000000000 wait_s from performance_schema.events_stages_history_long eshl join performance_schema.events_statements_history_long esthl on (eshl.nesting_event_id = esthl.event_id) where eshl.timer_wait > 1*10000000000G *************************** 1. row *************************** event_name: stage/sql/Sending data sql_text: select count(emp_no) from employees join salaries using(emp_no) where hire_date = from_date Copyright © 2014, Oracle and/or its affiliates. All rights reserved. | wait_s: 0.8170 1 row in set (0.00 sec)
  • 30. Copyright © 2014, Oracle and/or its affiliates. All rights reserved. | events_stages_* What else is worth attention? • Everything, related to temporary tables ● EVENT_NAME LIKE 'stage/sql/%tmp%' • Everything, related to locks ● EVENT_NAME LIKE 'stage/sql/%lock%' • Everything in state «Waiting for» ● EVENT_NAME LIKE 'stage/%/Waiting for%' • Frequently met issues (from our experience in MySQL Support Team) ● EVENT_NAME='stage/sql/end' ● EVENT_NAME='stage/sql/freeing items' ● EVENT_NAME='stage/sql/Sending data' ● EVENT_NAME='stage/sql/cleaning up' ● EVENT_NAME='stage/sql/closing tables'
  • 31. What happens inside the MySQL server? Copyright © 2014, Oracle and/or its affiliates. All rights reserved. |
  • 32. Performance Schema contains a lot of information about what is going on inside • Only information, available in 5.5 • Hard to understand – If you are not C programmer – If you don't know MySQL source code by heart • We will teach you – How you can use of this information –Where you can find more human-readable details Copyright © 2014, Oracle and/or its affiliates. All rights reserved. |
  • 33. Copyright © 2014, Oracle and/or its affiliates. All rights reserved. | Example 4. Prepare test mysql> create database sbtest; Query OK, 1 row affected (0.07 sec) $sysbench ­­mysql­user= root ­­mysql­password= oracle ­­test= oltp ­­oltp­table­size= 1000000 ­­db­driver= mysql prepare mysql> update performance_schema.setup_instruments set enabled='yes', timed='yes' where name like 'wait/%'; Query OK, 229 rows affected (0.02 sec) Rows matched: 277 Changed: 229 Warnings: 0 mysql> truncate performance_schema.events_waits_summary_global_by_event_name; Query OK, 0 rows affected (0.00 sec)
  • 34. Copyright © 2014, Oracle and/or its affiliates. All rights reserved. | Run some load $ sysbench ­­mysql­user= root ­­mysql­password= oracle ­­test= oltp ­­num­threads= 16 ­­db­driver= mysql run sysbench 0.4.12: multi­threaded system evaluation benchmark ... Threads started! … Threads fairness: events (avg/stddev): 626.2500/3.23 execution time (avg/stddev): 62.5864/0.03 $
  • 35. Copyright © 2014, Oracle and/or its affiliates. All rights reserved. | See what happened mysql> select EVENT_NAME, COUNT_STAR, AVG_TIMER_WAIT from performance_schema.events_waits_summary_global_by_event_name where count_star>0 order by count_star desc; +­­­­­­­­­­­­­­­­­­­­­­­­­­­­­­­­­­­­­­­­­+ ­­­­­­­­­­­­+ ­­­­­­­­­­­­­­­­+ | EVENT_NAME | COUNT_STAR | AVG_TIMER_WAIT | +­­­­­­­­­­­­­­­­­­­­­­­­­­­­­­­­­­­­­­­­­+ ­­­­­­­­­­­­+ ­­­­­­­­­­­­­­­­+ | wait/io/table/sql/handler | 4250176 | 9792048 | | wait/synch/mutex/sql/THD::LOCK_thd_data | 1214516 | 149382 | | wait/io/socket/sql/client_connection | 421690 | 20091686 | | wait/lock/table/sql/handler | 380912 | 497554 | | idle | 200081 | 10359000000 | | wait/synch/mutex/innodb/trx_mutex | 96441 | 84534 | | wait/synch/mutex/innodb/trx_undo_mutex | 50120 | 79130 | | wait/io/file/innodb/innodb_data_file | 3534 | 3486992374 | | wait/io/file/innodb/innodb_log_file | 2565 | 22204344288 | | wait/synch/rwlock/sql/MDL_lock::rwlock | 1 | 534224 | +­­­­­­­­­­­­­­­­­­­­­­­­­­­­­­­­­­­­­­­­­+ ­­­­­­­­­­­­+ ­­­­­­­­­­­­­­­­+ 10 rows in set (0.02 sec)
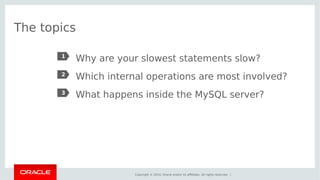
  • 36. Copyright © 2014, Oracle and/or its affiliates. All rights reserved. | What does it mean? mysql> select source from performance_schema.events_waits_current where event_name='wait/io/file/innodb/innodb_log_file'; +­­­­­­­­­­­­­­­­­+ | source | +­­­­­­­­­­­­­­­­­+ | fil0fil.cc:5886 | | fil0fil.cc:5692 | +­­­­­­­­­­­­­­­­­+ 2 rows in set (0.00 sec)
  • 37. Copyright © 2014, Oracle and/or its affiliates. All rights reserved. | What does it mean? $ cd $HOME/HOL/sample­data/ mysql­5.6.20 $ cat ­n storage/innobase/fil/fil0fil.cc | grep ­E "588[[:digit:]]" 5880 ut_a(node­> open); 5881 file = node­> handle; 5882 node­> n_pending_flushes++; 5883 5884 mutex_exit(&fil_system­> mutex); 5885 5886 os_file_flush(file); 5887 5888 mutex_enter(&fil_system­> mutex); IO
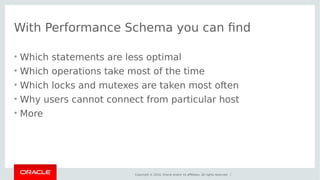
  • 38. Copyright © 2014, Oracle and/or its affiliates. All rights reserved. | What does it mean? $ cat ­n storage/innobase/fil/fil0fil.cc | grep ­E "569[[:digit:]]" 5690 /* Queue the aio request */ 5691 ret = os_aio(type, mode | wake_later, node­> name, node­> handle, buf, 5692 offset, len, node, message); 5693 #endif /* UNIV_HOTBACKUP */ 5694 ut_a(ret); IO 5695 5696 if (mode == OS_AIO_SYNC) { 5697 /* The i/o operation is already completed when we return from 5698 os_aio: */
  • 39. Copyright © 2014, Oracle and/or its affiliates. All rights reserved. | Example 5. One more test mysql> CALL sys.ps_truncate_all_tables(false); +­­­­­­­­­­­­­­­­­­­­­+ | summary | +­­­­­­­­­­­­­­­­­­­­­+ | Truncated 31 tables | +­­­­­­­­­­­­­­­­­­­­­+ 1 row in set (0.02 sec) Query OK, 0 rows affected (0.02 sec)
  • 40. Copyright © 2014, Oracle and/or its affiliates. All rights reserved. | One more test mysql> use sbtest Reading table information for completion of table and column names You can turn off this feature to get a quicker startup with ­A Database changed mysql> alter table sbtest add key(c,pad); ...
  • 41. In parallel terminal window $ sysbench ­­mysql­user= root ­­mysql­password= oracle ­­test= oltp ­­num­threads= 16 ­­db­driver= mysql run sysbench 0.4.12: multi­threaded system evaluation benchmark ... Threads started! … Threads fairness: events (avg/stddev): 625.7500/3.27 execution time (avg/stddev): 141.6036/0.02 Copyright © 2014, Oracle and/or its affiliates. All rights reserved. | $
  • 42. Compare with previous result mysql> select EVENT_NAME, COUNT_STAR, AVG_TIMER_WAIT from performance_schema.events_waits_summary_global_by_event_name where count_star>0 order by avg_timer_wait desc, count_star desc; +­­­­­­­­­­­­­­­­­­­­­­­­­­­­­­­­­­­­­­­­­­­­­­­­­­­­­+ ­­­­­­­­­­­­+ ­­­­­­­­­­­­­­­­+ | EVENT_NAME | COUNT_STAR | AVG_TIMER_WAIT | +­­­­­­­­­­­­­­­­­­­­­­­­­­­­­­­­­­­­­­­­­­­­­­­­­­­­­+ ­­­­­­­­­­­­+ ­­­­­­­­­­­­­­­­+ | wait/synch/cond/sql/MDL_context::COND_wait_status | 17 | 453990564188 | | idle | 198053 | 56658000000 | | wait/io/file/innodb/innodb_log_file | 2876 | 45177967662 | | wait/io/file/innodb/innodb_temp_file | 3196 | 13644966830 | | wait/io/file/innodb/innodb_data_file | 32694 | 2927208612 | | wait/io/file/sql/FRM | 153 | 751453606 | | wait/synch/rwlock/innodb/index_tree_rw_lock | 1369436 | 83586370 | ... Copyright © 2014, Oracle and/or its affiliates. All rights reserved. |
  • 43. Even more information! mysql> select file, count_write, total_written from sys.io_global_by_file_by_bytes where count_write>0 order by count_write desc; +­­­­­­­­­­­­­­­­­­­­­­­­­­­­­­­­­­­­­­­­+ ­­­­­­­­­­­­­+ ­­­­­­­­­­­­­­­+ | file | count_write | total_written | +­­­­­­­­­­­­­­­­­­­­­­­­­­­­­­­­­­­­­­­­+ ­­­­­­­­­­­­­+ ­­­­­­­­­­­­­­­+ | @@datadir/sbtest/sbtest.ibd | 16830 | 479.53 MiB | | @@datadir/ibdata1 | 4072 | 372.44 MiB | | @@datadir/Innodb Merge Temp File | 1595 | 1.56 GiB | | @@datadir/ib_logfile0 | 1299 | 48.63 MiB | | @@datadir/ib_logfile1 | 140 | 2.79 MiB | | @@datadir/sbtest/#sql­1f8a_ 27af.frm | 23 | 4.79 KiB | | @@datadir/mysql/innodb_index_stats.ibd | 1 | 16.00 KiB | | @@datadir/mysql/innodb_table_stats.ibd | 1 | 16.00 KiB | +­­­­­­­­­­­­­­­­­­­­­­­­­­­­­­­­­­­­­­­­+ ­­­­­­­­­­­­­+ ­­­­­­­­­­­­­­­+ 8 rows in set (0.00 sec) Explains why ALTER is expensive Copyright © 2014, Oracle and/or its affiliates. All rights reserved. |
  • 44. Copyright © 2014, Oracle and/or its affiliates. All rights reserved. | Further studying
  • 45. Performance Schema in MySQL 5.7 • MDL locks hunting – Not only information about transaction, waiting the lock, but also Copyright © 2014, Oracle and/or its affiliates. All rights reserved. | about one, holding the lock • Replication information • Information about transactions –Includes server-level • Memory usage –Database sys • More
  • 46. MDL hunting before 5.7 Only information about transaction waiting the lock: mysql> select processlist_id, mi.name, locked_by_thread_id from mutex_instances mi join threads on(locked_by_thread_id=thread_id) where locked_by_thread_id is not nullG ******************* 1. row ******************* Copyright © 2014, Oracle and/or its affiliates. All rights reserved. | processlist_id: 4 name: wait/synch/mutex/sql/MDL_wait::LOCK_wait_status locked_by_thread_id: 20 1 row in set (0.02 sec)
  • 47. MDL hunting before 5.7 Can also be found in PROCESSLIST: mysql> select id, state, info from information_schema.processlistG ******************** 1. row ******************** Copyright © 2014, Oracle and/or its affiliates. All rights reserved. | id: 4 state: Waiting for table metadata lock info: alter table titles add column f1 int ******************** 2. row ******************** id: 2 state: executing info: select id, state, info from information_schema.processlist
  • 48. Copyright © 2014, Oracle and/or its affiliates. All rights reserved. | MDL hunting in 5.7 mysql> select processlist_id, object_type, lock_type, lock_status, source from metadata_locks join threads on (owner_thread_id=thread_id) where object_schema='employees' and object_name='titles'G *************************** 1. row *************************** processlist_id: 4 object_type: TABLE lock_type: EXCLUSIVE lock_status: PENDING source: mdl.cc:3263 *************************** 2. row *************************** processlist_id: 5 object_type: TABLE lock_type: SHARED_READ lock_status: GRANTED source: sql_parse.cc:5707
  • 49. PERFORMANCE_SCHEMA.REPLICATION_% tables Last_SQL_Error: Error 'Unknown table 'test.t1'' on query. Default database: 'test'. ... mysql> select SERVICE_STATE, RECEIVED_TRANSACTION_SET, LAST_ERROR_NUMBER from replication_connection_statusG ************************ 1. row ************************ Copyright © 2014, Oracle and/or its affiliates. All rights reserved. | SERVICE_STATE: ON RECEIVED_TRANSACTION_SET: 9fa18fb7­d6f2­11e3­bc7e­a088b4923078: 1­12 LAST_ERROR_NUMBER: 0 1 row in set (0.00 sec) mysql> select * from replication_execute_statusG ************************ 1. row ************************ SERVICE_STATE: OFF REMAINING_DELAY: NULL 1 row in set (0.00 sec)
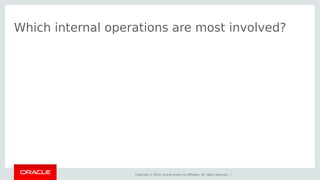
  • 50. MySQL Central sessions • MySQL’s Performance Schema: New Features in 5.6 and 5.7 [CON2222] • The MySQL sys Schema [CON3751] • MySQL 5.7: Performance and Scalability Benchmarks [CON5066] • Evolving the MySQL Server Architecture [CON2387] • Using MySQL Workbench Performance Tools [HOL9237] • MySQL Query Patterns, Optimized [CON5346] • MySQL Replication: What’s New in 5.7 and Beyond [CON5071] Copyright © 2014, Oracle and/or its affiliates. All rights reserved. |
  • 51. You will find more information at • In the full version of these slides • http://marcalff.blogspot.ru • http://www.markleith.co.uk/ps_helper/ • http://dimitrik.free.fr/blog/ • http://www.slideshare.net/SvetaSmirnova/performance-schema-for-mysql-troubleshooting • http://dev.mysql.com/doc/refman/5.6/en/performance-schema.html Copyright © 2014, Oracle and/or its affiliates. All rights reserved. |
  • 52. You will find authors of this Lab at • https://twitter.com/svetsmirnova • https://blogs.oracle.com/svetasmirnova/ • https://twitter.com/lig Copyright © 2014, Oracle and/or its affiliates. All rights reserved. |
  • 53. Copyright © 2014, Oracle and/or its affiliates. All rights reserved. | Thank you!
  • 54. Copyright © 2014, Oracle and/or its affiliates. All rights reserved. |