SlideShare a Scribd company logo
1
UNIT-I
INTRODUCTION TO DATA
SCIENCE
Prepared by
A.R.Sivanesh M.E.,(Ph.D)
Assistant Professor,
Department of Mechanical Engineering,
Sri Ranganathar Institute of Engineering and
Technology, Coimbatore.
OCS353 DATA SCIENCE FUNDAMENTALS
Prepared by A.R.Sivanesh M.E., (Ph.D)
2
SYLLABUS
• UNIT I INTRODUCTION
• Data Science: Benefits and uses – facets of data - Data
Science Process: Overview – Defining research goals –
Retrieving data – data preparation - Exploratory Data
analysis – build the model –presenting findings and
building applications - Data Mining - Data Warehousing
– Basic statistical descriptions of Data
Prepared by A.R.Sivanesh M.E., (Ph.D)
3
COURSE OBJECTIVES:
• Familiarize students with the data science process.
Prepared by A.R.Sivanesh M.E., (Ph.D)
4
COURSE OUTCOMES:
• At the end of this course, the students will be able to:
CO1: Gain knowledge on data science process.
Prepared by A.R.Sivanesh M.E., (Ph.D)
5
WHAT IS DATA SCIENCE?
• Data Science is an interdisciplinary field that combines
knowledge from statistics, computer science,
mathematics, and domain-specific expertise to extract
insights and knowledge from both structured and
unstructured data. The goal is to use these insights to
make informed decisions, predict future outcomes, and
improve processes.
Prepared by A.R.Sivanesh M.E., (Ph.D)
6
GOAL OF DATA SCIENCE
• Informed decision-making
• Predict future outcomes
• Improve processes
Prepared by A.R.Sivanesh M.E., (Ph.D)
7
KEY COMPONENTS OF
DATA SCIENCE
• Data Collection – Acquiring raw data from different sources like
sensors, web servers, databases, or surveys.
• Data Cleaning – Removing errors, handling missing values,
correcting inconsistent entries.
• Data Analysis – Summarizing and examining data patterns.
• Visualization – Representing data using charts, graphs, and
plots to make patterns visible.
• Statistical Modeling – Applying statistical tools to model
relationships.
• Machine Learning – Building predictive models using algorithms.
• Communication – Presenting insights clearly to stakeholders
using reports or dashboards.
Prepared by A.R.Sivanesh M.E., (Ph.D)
8
BENEFITS OF DATA
SCIENCE
• Enables data-driven decision-making.
• Detects patterns and anomalies.
• Enhances automation through AI/ML models.
• Improves efficiency in engineering processes.
• Provides predictive capabilities (e.g., predicting tool
wear).
Prepared by A.R.Sivanesh M.E., (Ph.D)
9
MECHANICAL ENGINEERING
APPLICATIONS
• Predicting machine failures using IoT sensor data.
• Optimizing cutting tool parameters based on past
performance.
• Monitoring and improving fuel efficiency in IC engines.
• Quality inspection using data analytics and image
processing.
Prepared by A.R.Sivanesh M.E., (Ph.D)
10
INTRODUCTION TO
FACETS OF DATA
• The term "facets of data" refers to different
characteristics or dimensions that define modern data,
especially in large-scale, real-world contexts. The most
accepted model is the 5Vs of Big Data, which includes
Volume, Velocity, Variety, Veracity, and Value.
Prepared by A.R.Sivanesh M.E., (Ph.D)
11
VOLUME
• Meaning: Refers to the amount or size of data.
• Context: Data is being generated in massive amounts.
Even a single machine could generate gigabytes of
data in a few days.
• Example: A CNC machine that logs RPM, vibration,
temperature, and cutting force every second for 30
days can produce millions of records.
Prepared by A.R.Sivanesh M.E., (Ph.D)
12
VELOCITY
• Meaning: Refers to the speed at which data is
generated and processed.
• Context: Sensors, mobile apps, and online systems
continuously stream data.
• Example: Real-time monitoring of a furnace’s
temperature or vibration patterns every millisecond.
• Why It Matters: Decision-making must sometimes
happen in real-time (e.g., triggering alarms in
machinery).
Prepared by A.R.Sivanesh M.E., (Ph.D)
13
VARIETY
• Meaning: Refers to the different forms of data.
• Types:
• Structured: Tables with rows and columns (e.g., Excel
sheets).
• Semi-structured: XML, JSON (e.g., logs from a sensor in
JSON format).
• Unstructured: Images, videos, audio, PDFs.
• Mechanical Example: A defect detection system may
use:
• Sensor logs (structured)
• Maintenance reports (semi-structured)
• Camera images of faulty parts (unstructured)
Prepared by A.R.Sivanesh M.E., (Ph.D)
14
VERACITY
• Meaning: Refers to the trustworthiness or quality of
data.
• Problem: Real-world data may have errors, be
incomplete, or contain noise.
• Example: If a temperature sensor in a machine is
miscalibrated, it may record 900°C when it’s only 90°C.
• Solution: Apply filters, validations, or statistical checks to
improve quality.
Prepared by A.R.Sivanesh M.E., (Ph.D)
15
VALUE
• Meaning: It’s not enough to just collect data; it must be
used to extract meaningful insights.
• Example: A sensor system that collects cutting tool
vibrations is valuable only if the data helps prevent
failure.
Prepared by A.R.Sivanesh M.E., (Ph.D)
16
FACETS OF DATA
SUMMARY TABLE
Facet Meaning Example
Volume Amount of data
1 million readings
from a furnace
sensor
Velocity
Speed of data
generation
Vibration logged
every second
Variety Types of data
JSON logs, sensor
data, image feeds
Veracity
Trustworthiness of
data
Sensor calibration,
data noise
Value Usefulness of insights
Predicting failure
before it happens
Prepared by A.R.Sivanesh M.E., (Ph.D)
17
DATA SCIENCE LIFE
CYCLE
• The Data Science Life Cycle outlines the entire journey
from a business problem to a data-driven solution.
Understanding this workflow helps students approach
problems methodically.
Prepared by A.R.Sivanesh M.E., (Ph.D)
18
STEP 1: DEFINE GOALS
• Why Important: Clear goals guide the entire project.
• Example: “Predict when a lathe machine’s spindle will
fail.”
• Deliverables: Well-defined problem, objectives, KPIs
(e.g., accuracy of prediction).
Prepared by A.R.Sivanesh M.E., (Ph.D)
19
STEP 2: DATA
COLLECTION
• Sources:
• Machine logs
• Excel sheets
• Sensors (temperature, pressure)
• SQL databases
• APIs
• Example: Collect temperature readings every 5 minutes
from 10 machines.
Prepared by A.R.Sivanesh M.E., (Ph.D)
20
STEP 3: DATA
PREPARATION
• Sub-steps:
• Cleaning: Remove or fix missing and incorrect data.
• Integration: Combine data from multiple sources.
• Transformation: Normalize (bring values to same scale),
encode (convert text to numbers).
• Tools: Pandas (Python), Excel
• Example: Convert all temperatures to Celsius; fill missing
readings using interpolation.
Prepared by A.R.Sivanesh M.E., (Ph.D)
21
STEP 4: EXPLORATORY
DATA ANALYSIS
• Goal: Understand patterns, relationships, and
anomalies in the data.
• Tools:
• Visualization: Histograms, box plots, scatter plots
• Statistics: Mean, median, standard deviation
• Example: Plot machine temperature over time to see if
it’s rising abnormally before failure.
Prepared by A.R.Sivanesh M.E., (Ph.D)
22
STEP 5: MODEL BUILDING
• Goal: Use algorithms to build predictive or classification
models.
• Common Models:
• Linear regression: Predict a value (e.g., temperature after
2 hours)
• Decision tree: Predict categories (e.g., failure: yes or no)
• Clustering: Group similar data (e.g., machine usage
patterns)
• Steps: Split dataset (train/test), train model, validate
accuracy.
Prepared by A.R.Sivanesh M.E., (Ph.D)
23
STEP 6: PRESENT FINDINGS
• Tools:
• Dashboards (Power BI, Tableau)
• Charts and summaries (Python’s Matplotlib, Seaborn)
• Goal: Explain to decision-makers what the model
discovered.
• Example: Show that if vibration > X and load > Y, failure
is 80% likely.
Prepared by A.R.Sivanesh M.E., (Ph.D)
24
STEP 7: DEPLOYMENT
• What It Means: Deploy the model into a real-time
environment.
• Examples:
• Integrate predictive model with maintenance
dashboard.
• Auto-generate alerts based on predictions.
Prepared by A.R.Sivanesh M.E., (Ph.D)
25
LIFE CYCLE SUMMARY
TABLE
• Goal - Predict failure
• Data - Sensor logs
• Prep - Fill NA, scale
• EDA - Temp trend
• Model - Regression
• Present - Dashboard
• Deploy - Alerts
Prepared by A.R.Sivanesh M.E., (Ph.D)
26
DATA MINING VS DATA
WAREHOUSING
Step Purpose Example
Define Goal Set objective Predict machine failure
Retrieve Data Collect from sources Readings from sensors
Prepare Data
Clean, integrate,
transform
Fill missing values, scale
RPM
EDA Visual analysis
Temperature vs time
plot
Build Model Use algorithm Train a regression model
Present Results Show insights Dashboard or report
Deploy Use in real-time
Send alerts via
dashboard
Prepared by A.R.Sivanesh M.E., (Ph.D)
27
DATA WAREHOUSING
• A data warehouse is a centralized repository that collects
data from multiple sources (production, marketing,
finance, machines, sensors, etc.).
• It follows the ETL process:
• Extract data from different sources (e.g., sensors, Excel
sheets).
• Transform it (clean, standardize, remove duplicates).
• Load it into a central database (warehouse).
• Warehouses are optimized for querying and reporting,
not real-time use.
• Example: You store all the CNC machine logs from 2013–
2023 for analysis.
Prepared by A.R.Sivanesh M.E., (Ph.D)
28
DATA MINING
• Once data is available in a warehouse or other storage, data
mining is used to find hidden patterns, trends, or relationships.
• Common techniques include:
• Clustering: Grouping similar data (e.g., group parts with similar
wear characteristics).
• Classification: Predicting categories (e.g., defective or non-
defective).
• Association Rules: "If this, then that" rules (e.g., If speed > X and
vibration > Y, then failure is likely).
• Data mining often involves machine learning.
• Example: Find that machines operating above 2500 rpm at
high temperature have a 60% chance of failure in the next 7
days.
Prepared by A.R.Sivanesh M.E., (Ph.D)
29
DATA MINING VS DATA
WAREHOUSING
Feature Data Mining Data Warehousing
Purpose
Discover patterns,
relationships in data
Central storage for large
datasets from various sources
Focus
Analysis and decision-
making
Data integration,
organization, and querying
Techniques Used
Clustering, Classification,
Association Rules, Neural
Networks
ETL (Extract, Transform, Load),
OLAP (Online Analytical
Processing)
Nature
Analytical, predictive,
dynamic
Static, structured, historical
Data Type
Raw and semi-processed
data
Cleaned, structured, and
historical data
Example
Detecting reasons behind
machine failure trends
Storing 10 years of sensor logs
from a factory floor
Prepared by A.R.Sivanesh M.E., (Ph.D)
30
BASIC STATISTICAL
DESCRIPTIONS OF DATA
• Statistics is the foundation of data analysis. These are
the most fundamental statistical tools used in EDA:
Mean (Arithmetic Average)
Median:
Mode:
Standard Deviation (SD)
Variance
Range
Skewness and Kurtosis
Prepared by A.R.Sivanesh M.E., (Ph.D)
31
MEAN
• Definition: The average value.
• Formula:
• Interpretation: Gives the central value of a dataset.
• Mechanical Example: Calculate the average temperature of a
furnace over 10 hours.
Prepared by A.R.Sivanesh M.E., (Ph.D)
32
MEDIAN
• Definition: The middle value in an ordered dataset.
• How to Find:
• Sort the data.
• If the number of values is odd, the middle one is the
median.
• If even, the median is the average of the two middle
values.
• Use: Robust to outliers. E.g., if one temperature reading
is mistakenly 1000°C, median is not affected as much
as the mean.
Prepared by A.R.Sivanesh M.E., (Ph.D)
33
MEDIAN FORMULA
Prepared by A.R.Sivanesh M.E., (Ph.D)
34
MODE
• Definition: The most frequent value in the dataset.
• Use Case:
• Mode is helpful in identifying frequent defects or events.
Prepared by A.R.Sivanesh M.E., (Ph.D)
35
STANDARD DEVIATION
• Definition: It tells how much the data deviates from the
mean.
• Formula:
Prepared by A.R.Sivanesh M.E., (Ph.D)
36
STANDARD DEVIATION
• Interpretation:
• Low SD: Data is closely clustered around the mean.
• High SD: Data is widely spread.
Prepared by A.R.Sivanesh M.E., (Ph.D)
37
VARIANCE
• Definition: It is the square of the standard deviation.
• Formula:
Prepared by A.R.Sivanesh M.E., (Ph.D)
38
VARIANCE
Prepared by A.R.Sivanesh M.E., (Ph.D)
39
RANGE
• Definition: Difference between the maximum and
minimum values.
• Formula: Range=Maximum value−Minimum value
• Use: You measure the RPM of a spindle under load:
Readings: 2550, 2600, 2700, 2500, 2650 rpm
Max RPM = 2700
Min RPM = 2500
Range = 2700 − 2500 = 200 rpm
Prepared by A.R.Sivanesh M.E., (Ph.D)
40
SKEWNESS AND KURTOSIS
• Skewness: Measures asymmetry of data. If
skewness > 0, it’s right-skewed; < 0, left-skewed.
Prepared by A.R.Sivanesh M.E., (Ph.D)
41
SKEWNESS AND KURTOSIS
• Kurtosis: Measures how sharp or flat a distribution
is. High kurtosis = sharp peak; low = flat peak.
42
PYTHON EXAMPLE -
CODE
import pandas as pd
import matplotlib.pyplot as plt
data = {'Time': [1, 2, 3, 4, 5],
'Temp': [60, 62, 61, 65, 63]}
df = pd.DataFrame(data)
print("Mean Temp:", df['Temp'].mean())
print("Std Dev:", df['Temp'].std())
plt.plot(df['Time'], df['Temp'], marker='o')
plt.title("Machine Temperature Over Time")
plt.xlabel("Time (Hours)")
plt.ylabel("Temperature (°C)")
plt.grid(True)
plt.show()
Prepared by A.R.Sivanesh M.E., (Ph.D)
43
THANK YOU

More Related Content

Recently uploaded (20)

PPTX
Distribution reservoir and service storage pptx
dhanashree78
 
PDF
Artificial intelligence,WHAT IS AI ALL ABOUT AI....pdf
Himani271945
 
PPTX
Introduction to Internal Combustion Engines - Types, Working and Camparison.pptx
UtkarshPatil98
 
PPTX
UNIT 1 - INTRODUCTION TO AI and AI tools and basic concept
gokuld13012005
 
PDF
Pictorial Guide To Checks On Tankers' IG system
Mahmoud Moghtaderi
 
PDF
WD2(I)-RFQ-GW-1415_ Shifting and Filling of Sand in the Pond at the WD5 Area_...
ShahadathHossain23
 
PPT
Footbinding.pptmnmkjkjkknmnnjkkkkkkkkkkkkkk
mamadoundiaye42742
 
PDF
13th International Conference of Security, Privacy and Trust Management (SPTM...
ijcisjournal
 
PDF
bs-en-12390-3 testing hardened concrete.pdf
ADVANCEDCONSTRUCTION
 
PPTX
L300 Technical Slide Library_Feb 2025 microsoft purview
macarenabenitez6
 
PDF
NTPC PATRATU Summer internship report.pdf
hemant03701
 
PDF
Artificial Neural Network-Types,Perceptron,Problems
Sharmila Chidaravalli
 
DOCX
Engineering Geology Field Report to Malekhu .docx
justprashant567
 
PPTX
Engineering Quiz ShowEngineering Quiz Show
CalvinLabial
 
PDF
William Stallings - Foundations of Modern Networking_ SDN, NFV, QoE, IoT, and...
lavanya896395
 
PPTX
Diabetes diabetes diabetes diabetes jsnsmxndm
130SaniyaAbduNasir
 
PPTX
Fundamentals of Quantitative Design and Analysis.pptx
aliali240367
 
PDF
this idjfk sgfdhgdhgdbhgbgrbdrwhrgbbhtgdt
WaleedAziz7
 
PPTX
Engineering Quiz ShowEngineering Quiz Show
CalvinLabial
 
PDF
Module - 5 Machine Learning-22ISE62.pdf
Dr. Shivashankar
 
Distribution reservoir and service storage pptx
dhanashree78
 
Artificial intelligence,WHAT IS AI ALL ABOUT AI....pdf
Himani271945
 
Introduction to Internal Combustion Engines - Types, Working and Camparison.pptx
UtkarshPatil98
 
UNIT 1 - INTRODUCTION TO AI and AI tools and basic concept
gokuld13012005
 
Pictorial Guide To Checks On Tankers' IG system
Mahmoud Moghtaderi
 
WD2(I)-RFQ-GW-1415_ Shifting and Filling of Sand in the Pond at the WD5 Area_...
ShahadathHossain23
 
Footbinding.pptmnmkjkjkknmnnjkkkkkkkkkkkkkk
mamadoundiaye42742
 
13th International Conference of Security, Privacy and Trust Management (SPTM...
ijcisjournal
 
bs-en-12390-3 testing hardened concrete.pdf
ADVANCEDCONSTRUCTION
 
L300 Technical Slide Library_Feb 2025 microsoft purview
macarenabenitez6
 
NTPC PATRATU Summer internship report.pdf
hemant03701
 
Artificial Neural Network-Types,Perceptron,Problems
Sharmila Chidaravalli
 
Engineering Geology Field Report to Malekhu .docx
justprashant567
 
Engineering Quiz ShowEngineering Quiz Show
CalvinLabial
 
William Stallings - Foundations of Modern Networking_ SDN, NFV, QoE, IoT, and...
lavanya896395
 
Diabetes diabetes diabetes diabetes jsnsmxndm
130SaniyaAbduNasir
 
Fundamentals of Quantitative Design and Analysis.pptx
aliali240367
 
this idjfk sgfdhgdhgdbhgbgrbdrwhrgbbhtgdt
WaleedAziz7
 
Engineering Quiz ShowEngineering Quiz Show
CalvinLabial
 
Module - 5 Machine Learning-22ISE62.pdf
Dr. Shivashankar
 

Featured (20)

PDF
Storytelling For The Web: Integrate Storytelling in your Design Process
Chiara Aliotta
 
PDF
Artificial Intelligence, Data and Competition – SCHREPEL – June 2024 OECD dis...
OECD Directorate for Financial and Enterprise Affairs
 
PDF
How to Leverage AI to Boost Employee Wellness - Lydia Di Francesco - SocialHR...
SocialHRCamp
 
PDF
2024 State of Marketing Report – by Hubspot
Marius Sescu
 
PDF
Everything You Need To Know About ChatGPT
Expeed Software
 
PDF
Product Design Trends in 2024 | Teenage Engineerings
Pixeldarts
 
PDF
How Race, Age and Gender Shape Attitudes Towards Mental Health
ThinkNow
 
PDF
AI Trends in Creative Operations 2024 by Artwork Flow.pdf
marketingartwork
 
PDF
Skeleton Culture Code
Skeleton Technologies
 
PDF
PEPSICO Presentation to CAGNY Conference Feb 2024
Neil Kimberley
 
PDF
Content Methodology: A Best Practices Report (Webinar)
contently
 
PPTX
How to Prepare For a Successful Job Search for 2024
Albert Qian
 
PDF
Social Media Marketing Trends 2024 // The Global Indie Insights
Kurio // The Social Media Age(ncy)
 
PDF
Trends In Paid Search: Navigating The Digital Landscape In 2024
Search Engine Journal
 
PDF
5 Public speaking tips from TED - Visualized summary
SpeakerHub
 
PDF
ChatGPT and the Future of Work - Clark Boyd
Clark Boyd
 
PDF
Getting into the tech field. what next
Tessa Mero
 
PDF
Google's Just Not That Into You: Understanding Core Updates & Search Intent
Lily Ray
 
PDF
How to have difficult conversations
Rajiv Jayarajah, MAppComm, ACC
 
PDF
Introduction to Data Science
Christy Abraham Joy
 
Storytelling For The Web: Integrate Storytelling in your Design Process
Chiara Aliotta
 
Artificial Intelligence, Data and Competition – SCHREPEL – June 2024 OECD dis...
OECD Directorate for Financial and Enterprise Affairs
 
How to Leverage AI to Boost Employee Wellness - Lydia Di Francesco - SocialHR...
SocialHRCamp
 
2024 State of Marketing Report – by Hubspot
Marius Sescu
 
Everything You Need To Know About ChatGPT
Expeed Software
 
Product Design Trends in 2024 | Teenage Engineerings
Pixeldarts
 
How Race, Age and Gender Shape Attitudes Towards Mental Health
ThinkNow
 
AI Trends in Creative Operations 2024 by Artwork Flow.pdf
marketingartwork
 
Skeleton Culture Code
Skeleton Technologies
 
PEPSICO Presentation to CAGNY Conference Feb 2024
Neil Kimberley
 
Content Methodology: A Best Practices Report (Webinar)
contently
 
How to Prepare For a Successful Job Search for 2024
Albert Qian
 
Social Media Marketing Trends 2024 // The Global Indie Insights
Kurio // The Social Media Age(ncy)
 
Trends In Paid Search: Navigating The Digital Landscape In 2024
Search Engine Journal
 
5 Public speaking tips from TED - Visualized summary
SpeakerHub
 
ChatGPT and the Future of Work - Clark Boyd
Clark Boyd
 
Getting into the tech field. what next
Tessa Mero
 
Google's Just Not That Into You: Understanding Core Updates & Search Intent
Lily Ray
 
How to have difficult conversations
Rajiv Jayarajah, MAppComm, ACC
 
Introduction to Data Science
Christy Abraham Joy
 
Ad

OCS353 DATA SCIENCE FUNDAMENTALS- Unit 1 Introduction to Data Science

  • 1. 1 UNIT-I INTRODUCTION TO DATA SCIENCE Prepared by A.R.Sivanesh M.E.,(Ph.D) Assistant Professor, Department of Mechanical Engineering, Sri Ranganathar Institute of Engineering and Technology, Coimbatore. OCS353 DATA SCIENCE FUNDAMENTALS
  • 2. Prepared by A.R.Sivanesh M.E., (Ph.D) 2 SYLLABUS • UNIT I INTRODUCTION • Data Science: Benefits and uses – facets of data - Data Science Process: Overview – Defining research goals – Retrieving data – data preparation - Exploratory Data analysis – build the model –presenting findings and building applications - Data Mining - Data Warehousing – Basic statistical descriptions of Data
  • 3. Prepared by A.R.Sivanesh M.E., (Ph.D) 3 COURSE OBJECTIVES: • Familiarize students with the data science process.
  • 4. Prepared by A.R.Sivanesh M.E., (Ph.D) 4 COURSE OUTCOMES: • At the end of this course, the students will be able to: CO1: Gain knowledge on data science process.
  • 5. Prepared by A.R.Sivanesh M.E., (Ph.D) 5 WHAT IS DATA SCIENCE? • Data Science is an interdisciplinary field that combines knowledge from statistics, computer science, mathematics, and domain-specific expertise to extract insights and knowledge from both structured and unstructured data. The goal is to use these insights to make informed decisions, predict future outcomes, and improve processes.
  • 6. Prepared by A.R.Sivanesh M.E., (Ph.D) 6 GOAL OF DATA SCIENCE • Informed decision-making • Predict future outcomes • Improve processes
  • 7. Prepared by A.R.Sivanesh M.E., (Ph.D) 7 KEY COMPONENTS OF DATA SCIENCE • Data Collection – Acquiring raw data from different sources like sensors, web servers, databases, or surveys. • Data Cleaning – Removing errors, handling missing values, correcting inconsistent entries. • Data Analysis – Summarizing and examining data patterns. • Visualization – Representing data using charts, graphs, and plots to make patterns visible. • Statistical Modeling – Applying statistical tools to model relationships. • Machine Learning – Building predictive models using algorithms. • Communication – Presenting insights clearly to stakeholders using reports or dashboards.
  • 8. Prepared by A.R.Sivanesh M.E., (Ph.D) 8 BENEFITS OF DATA SCIENCE • Enables data-driven decision-making. • Detects patterns and anomalies. • Enhances automation through AI/ML models. • Improves efficiency in engineering processes. • Provides predictive capabilities (e.g., predicting tool wear).
  • 9. Prepared by A.R.Sivanesh M.E., (Ph.D) 9 MECHANICAL ENGINEERING APPLICATIONS • Predicting machine failures using IoT sensor data. • Optimizing cutting tool parameters based on past performance. • Monitoring and improving fuel efficiency in IC engines. • Quality inspection using data analytics and image processing.
  • 10. Prepared by A.R.Sivanesh M.E., (Ph.D) 10 INTRODUCTION TO FACETS OF DATA • The term "facets of data" refers to different characteristics or dimensions that define modern data, especially in large-scale, real-world contexts. The most accepted model is the 5Vs of Big Data, which includes Volume, Velocity, Variety, Veracity, and Value.
  • 11. Prepared by A.R.Sivanesh M.E., (Ph.D) 11 VOLUME • Meaning: Refers to the amount or size of data. • Context: Data is being generated in massive amounts. Even a single machine could generate gigabytes of data in a few days. • Example: A CNC machine that logs RPM, vibration, temperature, and cutting force every second for 30 days can produce millions of records.
  • 12. Prepared by A.R.Sivanesh M.E., (Ph.D) 12 VELOCITY • Meaning: Refers to the speed at which data is generated and processed. • Context: Sensors, mobile apps, and online systems continuously stream data. • Example: Real-time monitoring of a furnace’s temperature or vibration patterns every millisecond. • Why It Matters: Decision-making must sometimes happen in real-time (e.g., triggering alarms in machinery).
  • 13. Prepared by A.R.Sivanesh M.E., (Ph.D) 13 VARIETY • Meaning: Refers to the different forms of data. • Types: • Structured: Tables with rows and columns (e.g., Excel sheets). • Semi-structured: XML, JSON (e.g., logs from a sensor in JSON format). • Unstructured: Images, videos, audio, PDFs. • Mechanical Example: A defect detection system may use: • Sensor logs (structured) • Maintenance reports (semi-structured) • Camera images of faulty parts (unstructured)
  • 14. Prepared by A.R.Sivanesh M.E., (Ph.D) 14 VERACITY • Meaning: Refers to the trustworthiness or quality of data. • Problem: Real-world data may have errors, be incomplete, or contain noise. • Example: If a temperature sensor in a machine is miscalibrated, it may record 900°C when it’s only 90°C. • Solution: Apply filters, validations, or statistical checks to improve quality.
  • 15. Prepared by A.R.Sivanesh M.E., (Ph.D) 15 VALUE • Meaning: It’s not enough to just collect data; it must be used to extract meaningful insights. • Example: A sensor system that collects cutting tool vibrations is valuable only if the data helps prevent failure.
  • 16. Prepared by A.R.Sivanesh M.E., (Ph.D) 16 FACETS OF DATA SUMMARY TABLE Facet Meaning Example Volume Amount of data 1 million readings from a furnace sensor Velocity Speed of data generation Vibration logged every second Variety Types of data JSON logs, sensor data, image feeds Veracity Trustworthiness of data Sensor calibration, data noise Value Usefulness of insights Predicting failure before it happens
  • 17. Prepared by A.R.Sivanesh M.E., (Ph.D) 17 DATA SCIENCE LIFE CYCLE • The Data Science Life Cycle outlines the entire journey from a business problem to a data-driven solution. Understanding this workflow helps students approach problems methodically.
  • 18. Prepared by A.R.Sivanesh M.E., (Ph.D) 18 STEP 1: DEFINE GOALS • Why Important: Clear goals guide the entire project. • Example: “Predict when a lathe machine’s spindle will fail.” • Deliverables: Well-defined problem, objectives, KPIs (e.g., accuracy of prediction).
  • 19. Prepared by A.R.Sivanesh M.E., (Ph.D) 19 STEP 2: DATA COLLECTION • Sources: • Machine logs • Excel sheets • Sensors (temperature, pressure) • SQL databases • APIs • Example: Collect temperature readings every 5 minutes from 10 machines.
  • 20. Prepared by A.R.Sivanesh M.E., (Ph.D) 20 STEP 3: DATA PREPARATION • Sub-steps: • Cleaning: Remove or fix missing and incorrect data. • Integration: Combine data from multiple sources. • Transformation: Normalize (bring values to same scale), encode (convert text to numbers). • Tools: Pandas (Python), Excel • Example: Convert all temperatures to Celsius; fill missing readings using interpolation.
  • 21. Prepared by A.R.Sivanesh M.E., (Ph.D) 21 STEP 4: EXPLORATORY DATA ANALYSIS • Goal: Understand patterns, relationships, and anomalies in the data. • Tools: • Visualization: Histograms, box plots, scatter plots • Statistics: Mean, median, standard deviation • Example: Plot machine temperature over time to see if it’s rising abnormally before failure.
  • 22. Prepared by A.R.Sivanesh M.E., (Ph.D) 22 STEP 5: MODEL BUILDING • Goal: Use algorithms to build predictive or classification models. • Common Models: • Linear regression: Predict a value (e.g., temperature after 2 hours) • Decision tree: Predict categories (e.g., failure: yes or no) • Clustering: Group similar data (e.g., machine usage patterns) • Steps: Split dataset (train/test), train model, validate accuracy.
  • 23. Prepared by A.R.Sivanesh M.E., (Ph.D) 23 STEP 6: PRESENT FINDINGS • Tools: • Dashboards (Power BI, Tableau) • Charts and summaries (Python’s Matplotlib, Seaborn) • Goal: Explain to decision-makers what the model discovered. • Example: Show that if vibration > X and load > Y, failure is 80% likely.
  • 24. Prepared by A.R.Sivanesh M.E., (Ph.D) 24 STEP 7: DEPLOYMENT • What It Means: Deploy the model into a real-time environment. • Examples: • Integrate predictive model with maintenance dashboard. • Auto-generate alerts based on predictions.
  • 25. Prepared by A.R.Sivanesh M.E., (Ph.D) 25 LIFE CYCLE SUMMARY TABLE • Goal - Predict failure • Data - Sensor logs • Prep - Fill NA, scale • EDA - Temp trend • Model - Regression • Present - Dashboard • Deploy - Alerts
  • 26. Prepared by A.R.Sivanesh M.E., (Ph.D) 26 DATA MINING VS DATA WAREHOUSING Step Purpose Example Define Goal Set objective Predict machine failure Retrieve Data Collect from sources Readings from sensors Prepare Data Clean, integrate, transform Fill missing values, scale RPM EDA Visual analysis Temperature vs time plot Build Model Use algorithm Train a regression model Present Results Show insights Dashboard or report Deploy Use in real-time Send alerts via dashboard
  • 27. Prepared by A.R.Sivanesh M.E., (Ph.D) 27 DATA WAREHOUSING • A data warehouse is a centralized repository that collects data from multiple sources (production, marketing, finance, machines, sensors, etc.). • It follows the ETL process: • Extract data from different sources (e.g., sensors, Excel sheets). • Transform it (clean, standardize, remove duplicates). • Load it into a central database (warehouse). • Warehouses are optimized for querying and reporting, not real-time use. • Example: You store all the CNC machine logs from 2013– 2023 for analysis.
  • 28. Prepared by A.R.Sivanesh M.E., (Ph.D) 28 DATA MINING • Once data is available in a warehouse or other storage, data mining is used to find hidden patterns, trends, or relationships. • Common techniques include: • Clustering: Grouping similar data (e.g., group parts with similar wear characteristics). • Classification: Predicting categories (e.g., defective or non- defective). • Association Rules: "If this, then that" rules (e.g., If speed > X and vibration > Y, then failure is likely). • Data mining often involves machine learning. • Example: Find that machines operating above 2500 rpm at high temperature have a 60% chance of failure in the next 7 days.
  • 29. Prepared by A.R.Sivanesh M.E., (Ph.D) 29 DATA MINING VS DATA WAREHOUSING Feature Data Mining Data Warehousing Purpose Discover patterns, relationships in data Central storage for large datasets from various sources Focus Analysis and decision- making Data integration, organization, and querying Techniques Used Clustering, Classification, Association Rules, Neural Networks ETL (Extract, Transform, Load), OLAP (Online Analytical Processing) Nature Analytical, predictive, dynamic Static, structured, historical Data Type Raw and semi-processed data Cleaned, structured, and historical data Example Detecting reasons behind machine failure trends Storing 10 years of sensor logs from a factory floor
  • 30. Prepared by A.R.Sivanesh M.E., (Ph.D) 30 BASIC STATISTICAL DESCRIPTIONS OF DATA • Statistics is the foundation of data analysis. These are the most fundamental statistical tools used in EDA: Mean (Arithmetic Average) Median: Mode: Standard Deviation (SD) Variance Range Skewness and Kurtosis
  • 31. Prepared by A.R.Sivanesh M.E., (Ph.D) 31 MEAN • Definition: The average value. • Formula: • Interpretation: Gives the central value of a dataset. • Mechanical Example: Calculate the average temperature of a furnace over 10 hours.
  • 32. Prepared by A.R.Sivanesh M.E., (Ph.D) 32 MEDIAN • Definition: The middle value in an ordered dataset. • How to Find: • Sort the data. • If the number of values is odd, the middle one is the median. • If even, the median is the average of the two middle values. • Use: Robust to outliers. E.g., if one temperature reading is mistakenly 1000°C, median is not affected as much as the mean.
  • 33. Prepared by A.R.Sivanesh M.E., (Ph.D) 33 MEDIAN FORMULA
  • 34. Prepared by A.R.Sivanesh M.E., (Ph.D) 34 MODE • Definition: The most frequent value in the dataset. • Use Case: • Mode is helpful in identifying frequent defects or events.
  • 35. Prepared by A.R.Sivanesh M.E., (Ph.D) 35 STANDARD DEVIATION • Definition: It tells how much the data deviates from the mean. • Formula:
  • 36. Prepared by A.R.Sivanesh M.E., (Ph.D) 36 STANDARD DEVIATION • Interpretation: • Low SD: Data is closely clustered around the mean. • High SD: Data is widely spread.
  • 37. Prepared by A.R.Sivanesh M.E., (Ph.D) 37 VARIANCE • Definition: It is the square of the standard deviation. • Formula:
  • 38. Prepared by A.R.Sivanesh M.E., (Ph.D) 38 VARIANCE
  • 39. Prepared by A.R.Sivanesh M.E., (Ph.D) 39 RANGE • Definition: Difference between the maximum and minimum values. • Formula: Range=Maximum value−Minimum value • Use: You measure the RPM of a spindle under load: Readings: 2550, 2600, 2700, 2500, 2650 rpm Max RPM = 2700 Min RPM = 2500 Range = 2700 − 2500 = 200 rpm
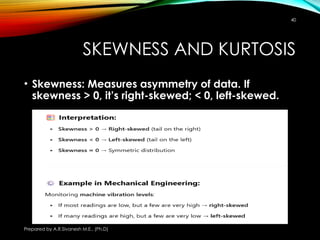
  • 40. Prepared by A.R.Sivanesh M.E., (Ph.D) 40 SKEWNESS AND KURTOSIS • Skewness: Measures asymmetry of data. If skewness > 0, it’s right-skewed; < 0, left-skewed.
  • 41. Prepared by A.R.Sivanesh M.E., (Ph.D) 41 SKEWNESS AND KURTOSIS • Kurtosis: Measures how sharp or flat a distribution is. High kurtosis = sharp peak; low = flat peak.
  • 42. 42 PYTHON EXAMPLE - CODE import pandas as pd import matplotlib.pyplot as plt data = {'Time': [1, 2, 3, 4, 5], 'Temp': [60, 62, 61, 65, 63]} df = pd.DataFrame(data) print("Mean Temp:", df['Temp'].mean()) print("Std Dev:", df['Temp'].std()) plt.plot(df['Time'], df['Temp'], marker='o') plt.title("Machine Temperature Over Time") plt.xlabel("Time (Hours)") plt.ylabel("Temperature (°C)") plt.grid(True) plt.show() Prepared by A.R.Sivanesh M.E., (Ph.D)
  • 43. Prepared by A.R.Sivanesh M.E., (Ph.D) 43 THANK YOU