- The document discusses using CircleCI for DataOps workflows, including building pipelines for data preparation, ingestion, and portal development.
- Key aspects of the pipelines include using Terraform for infrastructure as code, Docker/ECR for containerization, and CircleCI for continuous integration and delivery.
- Challenges include getting approval from Dev, Ops, and security teams, and choosing the right tools for infrastructure definition, secrets management, and deployment.
Cloud Native 오픈소스 서비스 소개 및 Serverless로 실제 게임 개발하기Jinwoong Kim
1. Cloud Native computing focuses on running containerized microservices at scale through technologies like Kubernetes. The Cloud Native Computing Foundation promotes this approach.
2. Games can benefit from a Cloud Native approach by running in-game and out-game processes as microservices on Kubernetes, including matchmaking, shops, rankings, and more.
3. Serverless computing through Functions as a Service (FaaS) allows code to be executed in response to events, reducing costs and speeds up development cycles for game processes like item purchases or notifications. Cloud Z's FaaS platform demonstrates running game functions.
Build a Complex, Realtime Data Management App with Postgres 14!Jonathan Katz
Congratulations: you've been selected to build an application that will manage reservations for rooms!
On the surface, this sounds simple, but you are building a system for managing a high traffic reservation web page, so we know that a lot of people will be accessing the system. Therefore, we need to ensure that the system can handle all of the eager users that will be flooding the website checking to see what availability each room has.
Fortunately, PostgreSQL is prepared for this! And even better, we will be using Postgres 14 to make the problem even easier!
We will explore the following PostgreSQL features:
* Data types and their functionality, such as:
* Data/Time types
* Ranges / Multirnages
Indexes such as:
* GiST
* Common Table Expressions and Recursion (though multiranges will make things easier!)
* Set generating functions and LATERAL queries
* Functions and the PL/PGSQL
* Triggers
* Logical decoding and streaming
We will be writing our application primary with SQL, though we will sneak in a little bit of Python and using Kafka to demonstrate the power of logical decoding.
At the end of the presentation, we will have a working application, and you will be happy knowing that you provided a wonderful user experience for all users made possible by the innovation of PostgreSQL!
[OpenInfra Days Korea 2018] Day 2 - E6 - OpenInfra monitoring with PrometheusOpenStack Korea Community
This document discusses using Prometheus for open infrastructure and cloud monitoring. It introduces Prometheus as a time series database and monitoring tool. Key features covered include metrics collection, service discovery, graphing, and alerting. The architecture of Prometheus is explained, including scrapping metrics directly or via exporters. A demo of Prometheus and Grafana is proposed to monitor Kubernetes clusters and visualize CPU usage. Alerting configuration and routes in Prometheus and Alertmanager are also summarized.
Anatomy of the libvirt virtualization library
http://www.ibm.com/developerworks/library/l-libvirt/
libvirt
http://libvirt.org/index.html
Scheduling
http://docs.openstack.org/icehouse/config-reference/content/section_compute-scheduler.html
Openstack Zoning – Region/Availability Zone/Host Aggregate
https://kimizhang.wordpress.com/2013/08/26/openstack-zoning-regionavailability-zonehost-aggregate/
Availability Zones and Host Aggregates in OpenStack Compute (Nova)
http://blog.russellbryant.net/2013/05/21/availability-zones-and-host-aggregates-in-openstack-compute-nova/
An Introduction to Droplet Metadata
https://www.digitalocean.com/community/tutorials/an-introduction-to-droplet-metadata
HOW WE USE CLOUDINIT IN OPENSTACK HEAT
http://sdake.io/2013/03/03/how-we-use-cloudinit-in-openstack-heat/
How to inject file/meta/ssh key/root password/userdata/config drive to a VM during nova boot
https://kimizhang.wordpress.com/2014/03/18/how-to-inject-filemetassh-keyroot-passworduserdataconfig-drive-to-a-vm-during-nova-boot/
Cloud-init
https://cloudinit.readthedocs.org/en/latest/
Kubernetes can orchestrate and manage container workloads through components like Pods, Deployments, DaemonSets, and StatefulSets. It schedules containers across a cluster based on resource needs and availability. Services enable discovery and network access to Pods, while ConfigMaps and Secrets allow injecting configuration and credentials into applications.
KubeCon Prometheus Salon -- Kubernetes metrics deep diveBob Cotton
The document discusses sources of metrics in Kubernetes including from nodes, containers, the Kubernetes API, etcd, and derived metrics. It covers the new Kubernetes metrics server and how it is used for scheduling and autoscaling. The presentation explains how Prometheus relabels metrics to add Kubernetes metadata and how recording rules can derive new metrics. It also discusses aggregating core metrics across the Kubernetes hierarchy.
[OpenInfra Days Korea 2018] (Track 3) - CephFS with OpenStack Manila based on...OpenStack Korea Community
This document discusses CephFS with OpenStack Manila based on Bluestore and erasure coding. It provides an overview of CephFS and its support in OpenStack Manila for shared file systems. It also describes how Bluestore is the default storage backend in Ceph and supports erasure coding. The benefits of erasure coding over replication for storage are outlined. Finally, it dives deeper into concepts like MDS architecture and high availability in CephFS.
Kubernetes monitoring and alerting can be done using Elasticsearch. Metricbeat and Filebeat can be used to collect Kubernetes metrics and logs from nodes, pods, and containers and send them to Elasticsearch. Watcher in Elasticsearch or Elastalert can then be used to define alerts and notifications based on metrics and logs.
This document provides an overview of using Prometheus for monitoring and alerting. It discusses using Node Exporters and other exporters to collect metrics, storing metrics in Prometheus, querying metrics using PromQL, and configuring alert rules and the Alertmanager for notifications. Key aspects covered include scraping configs, common exporters, data types and selectors in PromQL, operations and functions, and setting up alerts and the Alertmanager for routing alerts.
Kubernetes Basis: Pods, Deployments, and ServicesJian-Kai Wang
Kubernetes is a container management platform and empowers the scalability to the container. In this repository, we address the issues of how to use Kubernetes with real cases. We start from the basic objects in Kubernetes, Pods, deployments, and Services. This repository is also a tutorial for those with advanced containerization skills trying to step into the Kubernetes. We also provide several YAML examples for those looking for quickly deploying services. Please enjoy it and let's start the journey to Kubernetes.
A look at some of the ways available to deploy Postgres in a Kubernetes cloud environment, either in small scale using simple configurations, or in larger scale using tools such as Helm charts and the Crunchy PostgreSQL Operator. A short introduction to Kubernetes will be given to explain the concepts involved, followed by examples from each deployment method and observations on the key differences.
- What is NOVA ?
- NOVA architecture
- How instance are spawned in Openstack ?
- Interaction of nova with other openstack projects like neutron, glance and cinder.
Automated Application Management with SaltStackinovex GmbH
Arnold Bechtoldt gave a presentation on using SaltStack for automated application management and orchestration. He began by defining orchestration and what is needed for true orchestration. SaltStack meets these needs through its state modules, remote execution, pillars, returners, reactors and other components. He demonstrated how to use SaltStack to automate the deployment of a multi-tier application, installing software and configuring servers at each stage and responding to events to reconfigure load balancers.
This document outlines the agenda for Season 2 Episode 2 of an event. The episode will include:
1. Lightning talks on various Reactive and Rx topics from different speakers
2. Guest speakers Jake Wharton from Square, Matt Ingenthron from Couchbase, and Will Sargent from Typesafe
3. More details on RxJava and composable reactive functions
Microservices @ Work - A Practice Report of Developing MicroservicesQAware GmbH
Cloud Native Night October 2016, Mainz: Talk by Simon Bäumler (Technical Chief Designer at QAware).
Join our Meetup: www.meetup.com/cloud-native-night
Abstract: This talk takes a practice oriented approach to examine microservice oriented architecture. It will show two real systems, one build from scratch in a microservice architecture, the other migrated from a monolithic system to a microservice architecture.
With the example of these two systems the pittfalls, advantages and lessons learned using microservice oriented architectures will be discussed.
While both systems use the java stack, including spring boot and spring cloud many topics will be kept general and will be of interest for all developers.
Kubernetes security involves authentication and authorization of users and service accounts, network policies to control ingress and egress traffic, security contexts to configure permissions and capabilities, and best practices like container image scanning, resource quotas, and network segmentation. The document outlines these Kubernetes security features and provides examples of how to implement authentication, define roles and permissions, set security contexts, and configure network policies and quotas. It recommends limiting direct access to nodes, regularly updating container images, and building a log cluster to analyze logs.
Kubernetes is a container cluster manager that aims to provide a platform for automating deployment, scaling, and operations of application containers across clusters of machines. It uses pods as the basic building block, which are groups of application containers that share storage and networking resources. Kubernetes includes control planes for replication, scheduling, and services to expose applications. It supports deployment of multi-tier applications through replication controllers, services, labels, and pod templates.
EFK Stack이란 ElasticSearch, Fluentd, Kibana라는 오픈소스의 조합으로, 방대한 양의 데이터를 신속하고 실시간으로 수집/저장/분석/시각화 할 수 있는 솔루션입니다. 특히 컨테이너 환경에서 로그 수집을 위해 주로 사용되는 기술 스택입니다.
Elasitc Stack에 대한 소개와 EFK Stack 설치 방법에 대해 설명합니다.
Kubernetes advanced sheduling
- Taint and tolerant
- Affinity (Node & inter pod)
Learn how to place Pod like (same or different) node, rack, zone, region
This document provides an overview of Kubernetes and its components. It discusses the Go programming language features used in Kubernetes. It also describes how Kubernetes is architected, including the kube-apiserver, kube-scheduler, Kubelet, reconciliation process, and networking with Flannel. The presenter is Anseungkyu who worked on OpenStack private clouds and is now the deputy representative for OpenStack Korea.
Introduction to ZooKeeper - TriHUG May 22, 2012mumrah
Presentation given at TriHUG (Triangle Hadoop User Group) on May 22, 2012. Gives a basic overview of Apache ZooKeeper as well as some common use cases, 3rd party libraries, and "gotchas"
Demo code available at https://github.com/mumrah/trihug-zookeeper-demo
The document discusses upgrading OpenStack from Grizzly to Havana. It provides instructions on removing old packages, installing new packages, migrating databases, and upgrading components individually to minimize downtime. The process involves updating packages on control, network, and compute nodes, migrating the database, and some clean-up steps.
Powering Microservices with Docker, Kubernetes, Kafka, & MongoDBMongoDB
This session introduced technologies such as Docker, Kubernetes, and Kafka, which are driving the microservices revolution. Learn about containers and orchestration – and most importantly, how to exploit them for stateful services such as MongoDB.
What You Will Learn:
* Why organizations are choosing to use microservice architectures, what benefits they deliver, and when they should – or shouldn't – be used.
* Technologies that are used to build microservices – including containers, orchestration, and messaging systems.
* Why MongoDB is a good fit for microservices and what special steps need to be taken to make them work well together.
Challenges in a Microservices Age: Monitoring, Logging and Tracing on Red Hat...Martin Etmajer
Until recently, applications ran on a handful of carefully curated technologies for years to come, deployments were static and teams siloed. In the microservices age, teams are cross-functional, pick the technologies they consider to work best for them, and are held accountable for what they produce. Application deployments are fine-grained, frequent, scalable and fully automated. What a shift and what a challenge for monitoring such environments! In this presentation, you'll learn how to obtain insights from your OpenShift environment by exploring various open-source monitoring, logging, and tracing technologies, including Elasticsearch, Fluentd, Hawkular, Heapster, Jolokia, Kibana, OpenTracing, Prometheus and ZipKin.
Slides from the Utah Software Architecture Meetup April 6, 2017
https://www.meetup.com/Utah-Software-Architecture-Meetup/events/238365117/
Our cloud-native environments are more complex than ever before! So how can we ensure that the applications we’re deploying to them are behaving as we intended them to? This is where effective observability is crucial. It enables us to monitor our applications in real-time and analyse and diagnose their behaviour in the cloud. However, until recently, we were lacking the standardization to ensure our observability solutions were applicable across different platforms and technologies. In this session, we’ll delve into what effective observability really means, exploring open source technologies and specifications, like OpenTelemetry, that can help us to achieve this while ensuring our applications remain flexible and portable.
This document discusses monitoring applications running in Kubernetes clusters with Prometheus. It summarizes deploying Prometheus in Weave Cloud, scraping and labeling metrics, storing metrics locally and remotely, querying metrics, creating alerts, and using dashboards. It also introduces Weave Cortex as a highly available and scalable Prometheus deployment built on Prometheus APIs.
Monitoring in Big Data Platform - Albert Lewandowski, GetInDataGetInData
Did you like it? Check out our blog to stay up to date: https://getindata.com/blog
The webinar was organized by GetinData on 2020. During the webinar we explaned the concept of monitoring and observability with focus on data analytics platforms.
Watch more here: https://www.youtube.com/watch?v=qSOlEN5XBQc
Whitepaper - Monitoring ang Observability for Data Platform: https://getindata.com/blog/white-paper-big-data-monitoring-observability-data-platform/
Speaker: Albert Lewandowski
Linkedin: https://www.linkedin.com/in/albert-lewandowski/
___
Getindata is a company founded in 2014 by ex-Spotify data engineers. From day one our focus has been on Big Data projects. We bring together a group of best and most experienced experts in Poland, working with cloud and open-source Big Data technologies to help companies build scalable data architectures and implement advanced analytics over large data sets.
Our experts have vast production experience in implementing Big Data projects for Polish as well as foreign companies including i.a. Spotify, Play, Truecaller, Kcell, Acast, Allegro, ING, Agora, Synerise, StepStone, iZettle and many others from the pharmaceutical, media, finance and FMCG industries.
https://getindata.com
OpenSource API Server based on Node.js API framework built on supported Node.js platform with Tooling and DevOps. Use cases are Omni-channel API Server, Mobile Backend as a Service (mBaaS) or Next Generation Enterprise Service Bus. Key functionality include built in enterprise connectors, ORM, Offline Sync, Mobile and JS SDKs, Isomorphic JavaScript and Graphical API creation tool.
In this Java Hibernate Training session, you will learn Integrating Struts with Hibernate. Topics covered in this session are:
• Struts 2
• Struts Action Class
• Validation
• Control Tags
• Data Tags
For more information, visit this link:
https://www.mindsmapped.com/courses/software-development/learn-hibernate-fundamentals-from-scratch/
This presentation on "Monitoring on Kubernetes using Prometheus" was made by Chandresh Pancholi on 9th June Cloud Native meetup in Bridgei2i Analytics in Bangalore
This document discusses using Prometheus to monitor Kubernetes clusters. It provides background on Kubernetes and Prometheus architectures. It then describes challenges with the previous monitoring setup and proposes using the Prometheus operator to more easily monitor Kubernetes and application metrics. The Prometheus operator allows automatically generating target configurations based on Kubernetes labels and provides Custom Resource Definitions for Prometheus and Service Monitors.
This document discusses Dapr, an open source runtime that makes it easy to build distributed applications on Kubernetes. It provides concise summaries of Dapr components like state management, publish/subscribe, secrets management, and more. Code samples show how to use Dapr building blocks like state stores and service invocation from Python, Node.js, and .NET applications on Kubernetes and standalone.
The document discusses OWASP Zed Attack Proxy (ZAP), a free and open source web application security scanner. It can be used by pentesters, developers, and testers to detect vulnerabilities. ZAP passively and actively scans applications to find issues. It can be integrated into CI/CD pipelines and automated with APIs, command line tools, and programming libraries. The document provides examples of using ZAP to perform passive scanning, active scanning, and automation for testers.
Kubernetes for java developers - Tutorial at Oracle Code One 2018Anthony Dahanne
You’re a Java developer? Already familiar with Docker? Want to know more about Kubernetes and its ecosystem for developers? During this session, you’ll get familiar with core Kubernetes concepts (pods, deployments, services, volumes, and so on) before seeing the most-popular and most-productive Kubernetes tools in action, with a special focus on Java development. By the end of the session, you’ll have a better understanding of how you can leverage Kubernetes to speed up your Java deployments on-premises or to any cloud.
SpaceONE is an open-source multi-cloud management platform consisting of microservices including frontend, backend, and plugins. The backend and plugins have a common software framework and use gRPC APIs and python-core libraries. SpaceONE uses a microservices architecture with components like identity, inventory, monitoring, and billing that can scale independently. It also has a plugin mechanism to extend the capabilities of core services like inventory to support multiple cloud providers.
Build cloud native solution using open source Nitesh Jadhav
Build cloud native solution using open source. I have tried to give a high level overview on How to build Cloud Native using CNCF graduated software's which are tested, proven and having many reference case studies and partner support for deployment
OSCON 2014 - API Ecosystem with Scala, Scalatra, and Swagger at NetflixManish Pandit
This document discusses Netflix's API ecosystem built using Scala, Scalatra, and Swagger. It summarizes Netflix's use of these technologies to build APIs that power their consumer electronics partner portal and enable certification of Netflix ready devices. It describes how the APIs provide a single source of truth for all device data at Netflix and correlate streaming quality metrics. It then discusses aspects of the architecture including the manager layer containing business logic, HTTP layer for handling requests/responses, and use of Scala, Scalatra, Swagger, and deployment process including immutable infrastructure.
In this session you will learn:
1. Introduction to Struts Framework
2. Features
3. Evolution
4. Struts Demo
5. Declarative validation
6. Architecture
7. Validators
8. Interceptors
This document provides an introduction to Node.js, a framework for building scalable server-side applications with asynchronous JavaScript. It discusses what Node.js is, how it uses non-blocking I/O and events to avoid wasting CPU cycles, and how external Node modules help create a full JavaScript stack. Examples are given of using Node modules like Express for building RESTful APIs and Socket.IO for implementing real-time features like chat. Best practices, limitations, debugging techniques and references are also covered.
MeetUp Monitoring with Prometheus and Grafana (September 2018)Lucas Jellema
This presentation introduces the concept of monitoring - focusing on why and how and finally on the tools to use. It introduces Prometheus (metrics gathering, processing, alerting), application instrumentation and Prometheus exporters and finally it introduces Grafana as a common companion for dashboarding, alerting and notifications. This presentations also introduces the handson workshop - for which materials are available from https://github.com/lucasjellema/monitoring-workshop-prometheus-grafana
Vert.x is a general purpose application platform for building asynchronous and reactive applications. It uses an event-driven architecture with non-blocking APIs to build distributed applications that can be composed of components written in different programming languages. Vert.x provides tools like an event bus for communication between components, as well as HTTP/TCP clients and servers that allow building reactive web and microservices applications. It aims to simplify concurrency while leveraging existing Java libraries and allowing applications to scale across multiple machines.
Exploring the Final Frontier of Data Center Orchestration: Network Elements -...Puppet
The document discusses network element automation using Puppet. It provides context on the challenges of manual network configuration including lack of agility, reliability issues from errors, and time spent on basic tasks. Puppet can automate network elements similar to how it automates servers, reducing errors and improving speed/productivity. The Cisco Nexus platform and NXAPI enable programmatic access for automation using Puppet through technologies like onePK and LXC containers running on the switch.
This document summarizes a presentation about Spinnaker on Kubernetes. It introduces Spinnaker as an open source multi-cloud continuous delivery platform initially developed by Netflix. It describes how Spinnaker can be used to manage Kubernetes clusters and deployments through concepts like accounts, server groups, load balancers and pipelines. The document also compares Spinnaker to alternatives like Jenkins and discusses best practices for productionizing Spinnaker on Kubernetes.
Cloud Z 의 오픈소스 서비스 소개 및 Serverless로 게임 개발하기Jinwoong Kim
This document discusses Kubernetes and how it has become very popular for container orchestration. It notes that Kubernetes is open source and was originally developed at Google. It then shows logarithmic graphs of GitHub activity for Kubernetes and several related technologies to demonstrate Kubernetes' high level of development activity in recent years.
Continuous Delivery with Spinnaker on K8s(kubernetes) Cluster Jinwoong Kim
This document discusses access control and authentication for a system. It covers setting up user accounts with different permissions, including setting permissions for specific directories and files. Authentication is discussed, including using passwords and ensuring they meet strength requirements. Auditing is also mentioned to log access and changes to files and directories. The document provides guidance on setting up and configuring this access control and authentication system.
What is Model Context Protocol(MCP) - The new technology for communication bw...Vishnu Singh Chundawat
The MCP (Model Context Protocol) is a framework designed to manage context and interaction within complex systems. This SlideShare presentation will provide a detailed overview of the MCP Model, its applications, and how it plays a crucial role in improving communication and decision-making in distributed systems. We will explore the key concepts behind the protocol, including the importance of context, data management, and how this model enhances system adaptability and responsiveness. Ideal for software developers, system architects, and IT professionals, this presentation will offer valuable insights into how the MCP Model can streamline workflows, improve efficiency, and create more intuitive systems for a wide range of use cases.
DevOpsDays Atlanta 2025 - Building 10x Development Organizations.pptxJustin Reock
Building 10x Organizations with Modern Productivity Metrics
10x developers may be a myth, but 10x organizations are very real, as proven by the influential study performed in the 1980s, ‘The Coding War Games.’
Right now, here in early 2025, we seem to be experiencing YAPP (Yet Another Productivity Philosophy), and that philosophy is converging on developer experience. It seems that with every new method we invent for the delivery of products, whether physical or virtual, we reinvent productivity philosophies to go alongside them.
But which of these approaches actually work? DORA? SPACE? DevEx? What should we invest in and create urgency behind today, so that we don’t find ourselves having the same discussion again in a decade?
Technology Trends in 2025: AI and Big Data AnalyticsInData Labs
At InData Labs, we have been keeping an ear to the ground, looking out for AI-enabled digital transformation trends coming our way in 2025. Our report will provide a look into the technology landscape of the future, including:
-Artificial Intelligence Market Overview
-Strategies for AI Adoption in 2025
-Anticipated drivers of AI adoption and transformative technologies
-Benefits of AI and Big data for your business
-Tips on how to prepare your business for innovation
-AI and data privacy: Strategies for securing data privacy in AI models, etc.
Download your free copy nowand implement the key findings to improve your business.
AI and Data Privacy in 2025: Global TrendsInData Labs
In this infographic, we explore how businesses can implement effective governance frameworks to address AI data privacy. Understanding it is crucial for developing effective strategies that ensure compliance, safeguard customer trust, and leverage AI responsibly. Equip yourself with insights that can drive informed decision-making and position your organization for success in the future of data privacy.
This infographic contains:
-AI and data privacy: Key findings
-Statistics on AI data privacy in the today’s world
-Tips on how to overcome data privacy challenges
-Benefits of AI data security investments.
Keep up-to-date on how AI is reshaping privacy standards and what this entails for both individuals and organizations.
The Evolution of Meme Coins A New Era for Digital Currency ppt.pdfAbi john
Analyze the growth of meme coins from mere online jokes to potential assets in the digital economy. Explore the community, culture, and utility as they elevate themselves to a new era in cryptocurrency.
Semantic Cultivators : The Critical Future Role to Enable AIartmondano
By 2026, AI agents will consume 10x more enterprise data than humans, but with none of the contextual understanding that prevents catastrophic misinterpretations.
Linux Support for SMARC: How Toradex Empowers Embedded DevelopersToradex
Toradex brings robust Linux support to SMARC (Smart Mobility Architecture), ensuring high performance and long-term reliability for embedded applications. Here’s how:
• Optimized Torizon OS & Yocto Support – Toradex provides Torizon OS, a Debian-based easy-to-use platform, and Yocto BSPs for customized Linux images on SMARC modules.
• Seamless Integration with i.MX 8M Plus and i.MX 95 – Toradex SMARC solutions leverage NXP’s i.MX 8 M Plus and i.MX 95 SoCs, delivering power efficiency and AI-ready performance.
• Secure and Reliable – With Secure Boot, over-the-air (OTA) updates, and LTS kernel support, Toradex ensures industrial-grade security and longevity.
• Containerized Workflows for AI & IoT – Support for Docker, ROS, and real-time Linux enables scalable AI, ML, and IoT applications.
• Strong Ecosystem & Developer Support – Toradex offers comprehensive documentation, developer tools, and dedicated support, accelerating time-to-market.
With Toradex’s Linux support for SMARC, developers get a scalable, secure, and high-performance solution for industrial, medical, and AI-driven applications.
Do you have a specific project or application in mind where you're considering SMARC? We can help with Free Compatibility Check and help you with quick time-to-market
For more information: https://www.toradex.com/computer-on-modules/smarc-arm-family
Massive Power Outage Hits Spain, Portugal, and France: Causes, Impact, and On...Aqusag Technologies
In late April 2025, a significant portion of Europe, particularly Spain, Portugal, and parts of southern France, experienced widespread, rolling power outages that continue to affect millions of residents, businesses, and infrastructure systems.
Enhancing ICU Intelligence: How Our Functional Testing Enabled a Healthcare I...Impelsys Inc.
Impelsys provided a robust testing solution, leveraging a risk-based and requirement-mapped approach to validate ICU Connect and CritiXpert. A well-defined test suite was developed to assess data communication, clinical data collection, transformation, and visualization across integrated devices.
Special Meetup Edition - TDX Bengaluru Meetup #52.pptxshyamraj55
We’re bringing the TDX energy to our community with 2 power-packed sessions:
🛠️ Workshop: MuleSoft for Agentforce
Explore the new version of our hands-on workshop featuring the latest Topic Center and API Catalog updates.
📄 Talk: Power Up Document Processing
Dive into smart automation with MuleSoft IDP, NLP, and Einstein AI for intelligent document workflows.
This is the keynote of the Into the Box conference, highlighting the release of the BoxLang JVM language, its key enhancements, and its vision for the future.
Procurement Insights Cost To Value Guide.pptxJon Hansen
Procurement Insights integrated Historic Procurement Industry Archives, serves as a powerful complement — not a competitor — to other procurement industry firms. It fills critical gaps in depth, agility, and contextual insight that most traditional analyst and association models overlook.
Learn more about this value- driven proprietary service offering here.
Increasing Retail Store Efficiency How can Planograms Save Time and Money.pptxAnoop Ashok
In today's fast-paced retail environment, efficiency is key. Every minute counts, and every penny matters. One tool that can significantly boost your store's efficiency is a well-executed planogram. These visual merchandising blueprints not only enhance store layouts but also save time and money in the process.
2. About Me
김진웅 @ddiiwoong
Cloud Native Platform Architect @SK C&C
Interested in Kubernetes and Serverless(FaaS), Dev(Data)Ops, SRE, ML/DL
3. Who am I and Where am I?
DevOps?
Data Center Virtual Machine Container Serverless
Weeks Minutes Seconds Milliseconds
Evolution
1단계 : Self-manage 2단계 : Managed 3단계 : Fully-Managed
OS설치/운영,
개발플랫폼 패치,
백업 등 직접관리
서버 기반이나
관리형 서비스로 제공
(설정, Scale 관리)
서버관리 없는 서비스
(No-Ops)
4. Complexity is inevitable
Microservices Containerization Orchestration Service Mesh
Bare Metal
Kernel
Network Stack
Cloud Stack
Libraries
Frameworks
Your Codes
7. Metrics
응용 프로그램 및 서비스의 성능과 품질을 측정하는 데 도움이 되는 정량 데이터
• Database, API Latency
• Request content length
• Open file descriptor
• Cache hit/miss
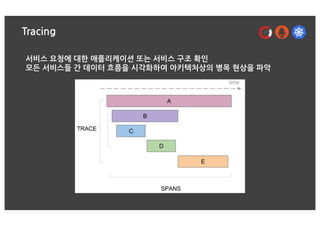
8. Tracing
서비스 요청에 대한 애플리케이션 또는 서비스 구조 확인
모든 서비스들 간 데이터 흐름을 시각화하여 아키텍처상의 병목 현상을 파악
9. OpenCensus
A Stats Collection and Distributed Tracing Framework
backed by Google and Microsoft since Jan. 2018
A single distribution of libraries that
automatically collect traces and metrics
from your app, Display them locally, and
send them to any backend.
(Prometheus, Stackdriver, Zipkin, Jaeger...)
10. VM or Kube Pod
VM or Kube Pod
OpenCensus Libraries
Auth.
service
Catalog
service
Search
service
FrontEnd
service
oc
lib
oc
lib
oc
lib
oc
lib
oc agent
oc agent
metrics +
tracing
backends
oc
collector
13. OpenCensus Agent Benefit
• 단일 exporter 관리
• 배포의 민주화 (Democratizes)
Backend로 보내는 선택은 개발자의 몫
• 최초 Instrumentation 적용후 언제든지 원하는 Backend로 변경가능
Prometheus 에서 Stackdriver로, Zipkin 에서 Jaeger로
• 오버헤드 감소
application 재시작 없이 ocagent 만 재시작
• 관측가능한 signal 통합 (pass-through)
Routing - Zipkin, Jaeger, Prometheus data
polyglot and poly-backend 관리 용이
• 관리 Port 최소화
TCP 55678
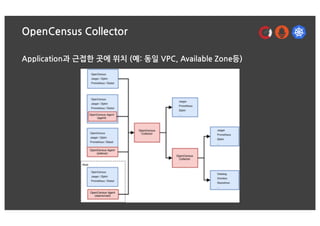
15. OpenCensus Collector Benefit
• 단일 exporter 관리
• 배포의 민주화 (Democratizes)
Backend로 보내는 선택은 개발자의 몫
• 최초 Instrumentation 적용후 언제든지 원하는 Backend로 변경가능
Prometheus 에서 Stackdriver로, Zipkin 에서 Jaeger로
• Egress Point 제한
Application 내 다수의 API Key, TLS관리 일원화
• Backend까지 data 보장
built-in buffering and retry capabilities
• Intelligent Sampling 기능 활용 (percentile, 백분위)
• Annotation
span이 수집되는 동안 metadata 추가 가능
• Tagging 가능
span에 포함된 tag override, remove 가능
16. OpenCensus Collector Performance
• 1 collector (HA 구성) - 24 Cores, 48 GB
• 17.3 billion spans/day (200K spans/second)
• 57 TB data a day (3.3KB per span)
• 0 dropped spans
• https://cloud.withgoogle.com/next/sf/sessions?session=268946-130602
17. Demo - Hipster Shop
Hipster Shop: Cloud-Native Microservices Demo Application
• 상품을 검색 및 구매할 수 있는 웹 기반 이커머스 Application
18. Demo - Hipster Shop
Hipster Shop: Cloud-Native Microservices Demo Application
• 모든 통신은 gRPC, 외부 통신만 HTTP
• Polygot : Go, C#, Node.js, Python, Java
• Istio 구성 가능
• Skaffold 로 배포 (https://skaffold.dev/)
• Backend Embedded
Stackdriver - https://github.com/GoogleCloudPlatform/microservices-demo
Prometheus - https://github.com/census-ecosystem/opencensus-microservices-demo
• Load Generator(Locust) 가 지속적으로 서비스 호출
• 특정 서비스(productcatalog)에서 GetProduct 함수 Latency 지연 발생
• Backend(Prometheus/Jaeger) 도구로 원인 파악 후 코드 수정 및 재배포
31. OpenTracing
Vendor-neutral APIs and instrumentation for distributed tracing.
Open standard for distributed tracing.
Libraries available in 9 languages
(Go, JavaScript, Java, Python, Ruby, PHP,
Objective-C, C++, C#)