OpenTelemetry For Architects
Download as PPTX, PDF•4 likes•1,467 views

The document presents an overview of OpenTelemetry, discussing its importance in addressing shortcomings in current observability patterns, particularly for microservices. It covers foundational concepts of observability, including metrics, tracing, and limitations of previous systems, while also outlining deployment architectures and instrumentation strategies. The emphasis is on the integration of distributed tracing, metrics, and logging, enabling incremental improvements in telemetry collection across applications.


![Kubernetes Deployment - Proof of Concept
service:
pipelines:
traces:
receivers: [otlp]
processors: [memory_limiter, resource, ...]
exporters: [otlp]
metrics:
receivers: [otlp, prometheus]
processors: [memory_limiter, resource, ...]
exporters: [otlp]
service:
pipelines:
traces:
receivers: [otlp]
processors: [memory_limiter, batch, queued_retry]
exporters: [jaeger]
metrics:
receivers: [otlp]
processors: [memory_limiter]
exporters: [prometheus]](https://image.slidesharecdn.com/otelforarchitects-1-201109165601/85/OpenTelemetry-For-Architects-24-320.jpg)
![Kubernetes Deployment - External Backends
service:
pipelines:
traces:
receivers: [otlp, zipkin]
processors: [memory_limiter, resource, ...]
exporters: [otlp]
metrics:
receivers: [otlp, prometheus]
processors: [memory_limiter, resource, ...]
exporters: [otlp]
service:
pipelines:
traces:
receivers: [otlp]
processors: [memory_limiter, batch, queued_retry]
exporters: [commercial...]
metrics:
receivers: [otlp]
processors: [memory_limiter, batch, queued_retry]
exporters: [commercial...]](https://image.slidesharecdn.com/otelforarchitects-1-201109165601/85/OpenTelemetry-For-Architects-25-320.jpg)
![Kubernetes Deployment - Service Mesh
service:
pipelines:
traces:
receivers: [zipkin]
processors: [memory_limiter, resource, ...]
exporters: [otlp]
metrics:
receivers: [statsd, prometheus]
processors: [memory_limiter, resource, ...]
exporters: [otlp]
service:
pipelines:
traces:
receivers: [otlp]
processors: [memory_limiter, batch, queued_retry]
exporters: [commercial...]
metrics:
receivers: [otlp]
processors: [memory_limiter, batch, queued_retry]
exporters: [commercial...]](https://image.slidesharecdn.com/otelforarchitects-1-201109165601/85/OpenTelemetry-For-Architects-26-320.jpg)
![Application Server on VM Deployment
service:
pipelines:
traces:
receivers: [otlp]
processors: [memory_limiter, resource, ...]
exporters: [otlp]
metrics:
receivers: [statsd, otlp]
processors: [memory_limiter, resource, ...]
exporters: [otlp]
service:
pipelines:
traces:
receivers: [otlp]
processors: [memory_limiter, batch, queued_retry]
exporters: [commercial...]
metrics:
receivers: [otlp]
processors: [memory_limiter, batch, queued_retry]
exporters: [commercial...]](https://image.slidesharecdn.com/otelforarchitects-1-201109165601/85/OpenTelemetry-For-Architects-27-320.jpg)


OpenTelemetry For Architects
- 1. OpenTelemetry For Architects Presented by Kevin Brockhoff Apache 2.0 Licensed
- 2. Our Agenda ● Where are current observability patterns falling short? ● Who is OpenTelemetry and why should I care? ● What are some recommended OpenTelemetry deployment architectures? ● How can I use OpenTelemetry to incrementally improve telemetry collection in applications?
- 3. Level Setting ● Have you used ELK stack or other log aggregator? ● Have you used an APM system? ● Have you used distributed tracing before? ● Have you used OpenCensus? ● Have you used OpenTracing?
- 4. Who am I? ● Kevin Brockhoff - Senior Consultant, Daugherty Business Solutions ○ Solving difficult cloud adoption challenges for Daugherty's Fortune 500 clients ○ OpenTelemetry committer since early stages of the project ○ Github: https://github.com/kbrockhoff ○ Linkedin: https://www.linkedin.com/in/kevi n-brockhoff-a557877/
- 6. 6 Why observability? ● Microservices create complex interactions. ● Failures don't exactly repeat. ● Debugging multi-tenancy is painful. ● Monitoring no longer can help us. Cynefin Framework Complex
- 8. 8 Metrics Concepts ● Gauges ○ Instantaneous point-in-time value (e.g. CPU utilization) ● Cumulative counters ○ Cumulative sums of data since process start (e.g. request counts) ● Cumulative histogram ○ Grouped counters for a range of buckets (e.g. 0-10ms, 11-20ms) ● Rates ○ The derivative of a counter, typically. (e.g. requests per second)
- 9. 9 Basic Observability Metrics Methods ● USE - Utilization, Saturation, and Errors ○ Resource-scoped ● RED - Rate, Errors, and Duration ○ Request-scoped
- 10. 10 Tracing Concepts ● Span ○ Represents a single unit of work in a system. ● Trace ○ Defined implicitly by its spans. A trace can be thought of as a directed acyclic graph of spans where the edges between spans are defined as parent/child relationships. ● Distributed Context ○ Contains the tracing identifiers, tags, and options that are propagated from parent to child spans.
- 11. 11 Observability 1.0 Limitations ● Data ends up in 3 different datastores. ● Different types of data not correlated with each other. ● Observability is not necessarily insight.
- 12. 12 Operational Complexity Growth 2010 2020 Circuit Breaker Homegrown w/ 3 configs Resilience4J w/ 14 configs Retries End user clicks submit again Resilience4J w/ 7 configs Health Check HTTP server and DB are live Kubernetes liveness, readiness, and startup probes with 5 timing configs per probe Alerts Unread count on circuit breaker opened email folder ???
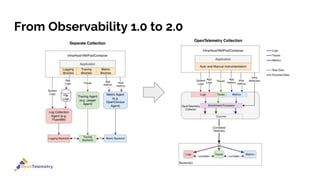
- 13. From Observability 1.0 to 2.0
- 14. 14 Observability 2.0 - PoC ● Deep Linking Metrics and Traces with OpenTelemetry, OpenMetrics and M3 - Rob Skillington (Presentation @ KubeCon North America 2019) ○ Click on point in metrics graph to get representative traces ○ Click on trace span to get system metrics from server that produced the span ○ Click on trace span to get all application logs emitted during span
- 16. OpenCensus + OpenTracing = OpenTelemetry ● OpenCensus: ○ Provides APIs and instrumentation that allow you to collect application metrics and distributed tracing. ○ Provides oc-service and oc-agent middleware. ● OpenTracing: ○ Provides APIs for distributed tracing with implementations provided by tracing backend vendors. ● OpenTelemetry: ○ An effort to combine distributed tracing, metrics and logging into a single set of system components and language-specific libraries.
- 17. 17 OpenTelemetry Project ● Specification ○ API (for application developers) ○ SDK Implementations ○ Transport Protocol (Protobuf - gRPC) ● Collector (middleware) ● SDK’s (various stages of maturity) ○ C++ ○ C# (Auto-instrument/Manual) ○ Erlang ○ Go ○ JavaScript (Browser/Node) ○ Java (Auto-instrument/Manual) ■ Android compatibility ○ PHP ○ Python (Auto-instrument/Manual) ○ Ruby ○ Rust ○ Swift
- 18. Open Source Observability Platforms Supported
- 19. Contributors
- 20. 20 W3C Distributed Tracing Working Group ● Trace Context – Level 1 - Recommendation ● Propagation format for distributed trace context: Baggage (rec-track) ● Trace Context: AMQP protocol (rec- track) ● Trace Context: MQTT protocol (rec- track) ● Trace Response Headers (rec-track) ● Trace Context Protocols Registry – Group Note ● Trace Context: binary protocol (rec- track) ● Trace Interchange Format (rec-track) ● Trace State Ids Registry (note)
- 21. 21 Trace Context HTTP Headers traceparent: 00-0af7651916cd43dd8448eb211c80319c-00f067aa0ba902b7-01 tracestate: rojo=00f067aa0ba902b7,congo=t61rcWkgMzE version trace-id (128 bit) parent-id (64 bit) trace-flags (8 bit) vendor-specific key/value pairs Baggage: userId=sergey,serverNode=DF:28,isProduction=false Draft Baggage header specification
- 22. Architecture
- 24. Kubernetes Deployment - Proof of Concept service: pipelines: traces: receivers: [otlp] processors: [memory_limiter, resource, ...] exporters: [otlp] metrics: receivers: [otlp, prometheus] processors: [memory_limiter, resource, ...] exporters: [otlp] service: pipelines: traces: receivers: [otlp] processors: [memory_limiter, batch, queued_retry] exporters: [jaeger] metrics: receivers: [otlp] processors: [memory_limiter] exporters: [prometheus]
- 25. Kubernetes Deployment - External Backends service: pipelines: traces: receivers: [otlp, zipkin] processors: [memory_limiter, resource, ...] exporters: [otlp] metrics: receivers: [otlp, prometheus] processors: [memory_limiter, resource, ...] exporters: [otlp] service: pipelines: traces: receivers: [otlp] processors: [memory_limiter, batch, queued_retry] exporters: [commercial...] metrics: receivers: [otlp] processors: [memory_limiter, batch, queued_retry] exporters: [commercial...]
- 26. Kubernetes Deployment - Service Mesh service: pipelines: traces: receivers: [zipkin] processors: [memory_limiter, resource, ...] exporters: [otlp] metrics: receivers: [statsd, prometheus] processors: [memory_limiter, resource, ...] exporters: [otlp] service: pipelines: traces: receivers: [otlp] processors: [memory_limiter, batch, queued_retry] exporters: [commercial...] metrics: receivers: [otlp] processors: [memory_limiter, batch, queued_retry] exporters: [commercial...]
- 27. Application Server on VM Deployment service: pipelines: traces: receivers: [otlp] processors: [memory_limiter, resource, ...] exporters: [otlp] metrics: receivers: [statsd, otlp] processors: [memory_limiter, resource, ...] exporters: [otlp] service: pipelines: traces: receivers: [otlp] processors: [memory_limiter, batch, queued_retry] exporters: [commercial...] metrics: receivers: [otlp] processors: [memory_limiter, batch, queued_retry] exporters: [commercial...]
- 29. 29 Greenfield Project Evolution ● Proof of Concept Demos ○ Sample App w/auto-instrumentation & direct exporters -> Jaeger & Prometheus ● Initial Development ○ Application libraries w/manual instrumentation -> In-memory and/or logging exporter ● Deployments during Development ○ Application w/SDK -> Collector (OTLP receiver) -> Cloud platform native monitoring ● Production ○ Applications w/SDK on hybrid cloud -> Collector (OTLP receiver) -> Latest and greatest enterprise-wide observability platform
- 30. 30 Already Instrumented Applications ● OpenCensus ○ Application -> Collector (OpenCensus receiver) -> Backend ● OpenTracing ○ Application w/OT + OpenTracing shim + SDK -> Collector (OTLP receiver) -> Backend ● Spring Boot ○ Application w/Micrometer -> Collector (Prometheus receiver) -> Backend ○ Application w/Spring Cloud Sleuth -> Collector (Zipkin receiver) -> Backend ● AWS ○ Application w/X-Ray SDK -> Collector (X-Ray receiver) -> Backend(s)
- 31. 31 Non-instrumented Applications ● Java ○ Launch with OpenTelemetry Java Agent (support for 61 widely-used frameworks and libraries) ● Javascript/Typescript ○ Add handlers/wrappers at key places or Node auto-instrumentation ● Microservice in any language ○ Deploy Envoy proxy as sidecar ● Infrastructure ○ Move to public cloud. AWS, Azure, GCP are all incorporating the OpenTelemety collector in their infrastructure
- 32. 32 Thank you!
Editor's Notes
- #2: Copyright 2020, The OpenTelemetry Authors Licensed under the Apache License, Version 2.0 (the "License"); you may not use this file except in compliance with the License. You may obtain a copy of the License at http://www.apache.org/licenses/LICENSE-2.0 Unless required by applicable law or agreed to in writing, software distributed under the License is distributed on an "AS IS" BASIS, WITHOUT WARRANTIES OR CONDITIONS OF ANY KIND, either express or implied. See the License for the specific language governing permissions and limitations under the License.