SlideShare a Scribd company logo
Manage your network smarter, with
OpManager v12
Network Management Software
in 1
What’s unique about OpManager 12?
Increased Visibility Great Control
Network &
Server
Monitoring
Bandwidth
Analysis
Firewall Log
Analysis
Configuration
Management
IP Address &
Switch Port
Management
1. Network
Management
Monitor 100+ performance
metrics such as CPU, Memory,
Errors & Discards, Buffer Hits &
Misses, & more.
Monitor the availability, response
time, and packet loss of the
device 24/7.
View the port status and
configuration changes.
Pull out detailed reports on the
metrics to analyze the trend.
Out-of-the-box templates for
1000+ Cisco, Juniper, Palo-alto,
Huawei, HP, Foundry, Aruba,
Netgear, Nortel & other network
devices.
Router/Switch Performance Monitoring
ADVANCED
Identify top bandwidth
consuming users and
applications via NetFlow, sFlow,
jFlow, IP FIX, and much more.
Apply QoS policies to regulate
bandwidth for business critical
apps.
BASIC
Monitor Tx/Rx traffic, errors,
discards and utilization via
SNMP.
Administratively UP/Down an
interface.
Interface Monitoring
Get a summary on your network
traffic and identify the top
conversations, applications,
protocols, and QoS by
bandwidth.
Find out detailed reports on
applications by IN & OUT traffic.
Know the top sources &
destinations by IN & OUT traffic.
Monitor bandwidth by app-wise
and shape traffic.
Carryout network forensics and
security analysis.
Bandwidth Monitoring
Monitor the bandwidth
consumed by BYOD.
Track the bandwidth usage by
apps accessed by the end-
users.
Identify the access points
connected by end-users.
End-user Centric Bandwidth Monitoring
Centrally collect, analyze and
archive firewall logs for security
and compliance.
Automate compliance audits
with reports for PCI DSS, ISO
27001, SANS, & more.
Manage shadow IT.
Track all changes done on
firewall configurations. Get
notified by Email and SMS.
Manage firewall policies to
enhance performance &
security.
Search raw log files and find out
security activity in minutes.
Firewall Log Management
Manage device configurations,
maintain history, compare
versions, and upload changes
from the web client itself.
Get notified for unauthorized
configuration changes via email
and SMS.
Revert faulty configurations.
Define policies and check
configurations for compliance.
Acts as centralized repository for
all your device configurations. All
the configurations are encrypted
and stored in the database.
Configuration Management
Scan IPv4 & IPv6 subnets to
identify available and used IPs
View full history of an IP address
to know which devices were
associated with it.
Receive alerts when IP address
state is changed, DNS revers
and forward lookup fails, and
more.
Schedule scanning via SNMP,
Ping, DNS, etc. at regular
intervals.
IP Address Management
Periodically discover the devices
connected to each port of a
switch.
Identify the port to which a
device is connected from GUI
itself.
Gain visibility into the IP, MAC,
VLAN, Status, and Availability of
ports.
Receive notifications for
changes in the port status.
Know all the MAC addresses
connected to a port.
Generate reports on port usage,
port speed, and port type.
Switch Port Management
2. Server
Monitoring
Monitor CPU, Memory & Disk
Utilization of Windows and Linux
servers via WMI and SNMP/CLI.
Monitor Windows processes and
services, and TCP services.
Monitor Windows events with
the event ID.
Monitor Files and Folders for
size, existence, count, and
modification.
Out-of-the-box includes
templates with monitors for all
leading server operating
systems.
Windows/Linux Server Monitoring
Monitor Host and VM
performance via vCenter APIs,
WMI, and Xen APIs.
Monitor performance metrics
such as CPU ready, Memory
Swap, Disk I/O Usage, Disk
Read Requests, Datastore Write
Requests, and 50 more.
Out-of the-box supports
vMotion, Live Migration and Xen
Motion.
Map VM-Host relationship for
better understanding.
Manage VM sprawl.
VMware, Hyper-V & Xen Monitoring
3. Fault
Management
OpManager creates alarms and
events to indicate the fault found
by it.
View all alarms and events by
severity.
Get notified by faults via Email,
SMS.
Trigger Workflow Automation to
automatically remediate faults.
Acknowledge/unacknowledge
alarms.
Add notes to alarms for more
information.
Escalate alarms if not resolved
in time.
Alarms & Notifications
Create notification profiles to
alert the respective
teams/admins.
Out-of-the-box offers alert
profiles such as Email, SMS,
Log a Ticket, & more.
Create escalation rules to
escalate alarms that are not
cleared or acknowledged in
specified time interval.
Notification Profiles
Multiple thresholds help receive
notification of faults at various
levels.
Alarms are also classified
accordingly when they get
generated.
Multi-level Thresholds
If-else condition based
workflows to automate L1 & L2
troubleshooting activities and
repeated IT tasks.
Allows you to revert
configurations, power off/on a
VM, start & stop a process or
service, and more.
Out-of-the-box offers over 70
actions.
Allows you to execute scripts.
Schedule workflows for repeated
tasks.
WorkFlow Automation
OpManager collects traps and
syslogs to detect faults in the
network.
Create profiles to filter traps and
syslogs that contain information
about network faults and raise
alarms.
Forward traps and syslogs to
another receiver.
Traps & Syslogs
Gather more information and
analyze the fault with the
diagnostic tools.
Carry out actions such as Ping,
SNMP Ping, Proxy Ping, Trace
Router and WMI Query.
Tools
Discuss IT issues on a
Facebook-like collaboration wall.
Share articles, troubleshooting
tips, KBs, and more.
Post comments and like the
posts and comments made by
peers.
Group Discussion
4.
Visualization
View the performance of your
entire network at-a-glance.
Find out all the operational
status of your network with 230+
out-of-the-box widgets.
Create multiple dashboards and
embed on your NOC screens.
Pull out top 10 data across sites
by CPU, Memory, Availability,
Traffic, Recent Configurations,
and more.
Navigate from widget to
snapshot page for detailed
analysis.
Dashboards & Widgets
Create logical views of your
network and view its
performance collectively.
Drill down to snapshot pages of
devices and interfaces to view
its detailed performance, in just
a click.
Identify the performance of the
devices and links using color
codes.
Embed on NOC screens for the
viewing the performance at-a-
glance.
Business Views
Visualize the network
geographically with Google
maps.
Provide the latitude and
longitude details to keep the
devices on their exact location.
Google Maps
Visualize your L2 topology.
Discover network devices via
seed device or core router.
Rediscover network to
automatically add or remove
devices from the map.
Export map to Visio and PDF.
Layer 2 Maps
Create mock view of racks in
your data center with the
devices mounted on them.
Create data center floor views
with the racks.
Monitor the health of the rack
and data center floor.
View the performance of the
devices using color codes.
Data Center Builder
5. Reports
Out-of-the-box offers 108
performance reports.
Schedule and email reports.
Create custom reports with data
of your choice.
Export reports to XLS and PDF.
Print reports from GUI.
Easy-to-use Report Builder
6. Deployment
Install OpManager in less than
10 minutes.
Bundles PQSQL database.
Support MSSQL also.
No additional components
required when installing.
Easy Installation
Discover all devices in your
network via SNMP, CLI and WMI
protocols.
Discover interfaces along with
devices, if needed.
Automatically map all devices
under respective categories and
start monitoring with the help of
1000+ templates bundled.
Schedule discovery to add or
remove devices.
Ultrafast Discovery Engine
Automatically configure
monitors, notification profiles to
newly added devices.
Rule Engine assigns monitors
and notification profiles if the
rules defined matches.
Schedule rule engine or run on-
demand.
Discovery Rule Engine
Monitor devices efficiently with
templates.
Out-of-the-box offers 1157
device templates and
232 interface templates.
Add or remove monitors to
templates and apply on the
devices, in bulk.
Create custom templates using
MIBs.
Share templates and import
shared templates from
ManageEngine community.
Device & Interface Templates
Apply, edit and remove
configurations, in bulk.
Helps you setup OpManager
quickly.
Quick Configuration Wizard
7. Other
Highlights
Enterprise Edition
for Distributed
Monitoring
Monitor geographically
distributed sites from a
centralized location with a
Probe-Central architecture.
Highly Scalable
Monitor 1 million interfaces
or 50,000 devices from a
single server
Failover
Offers hot-standby
secondary server support
for high availability of
OpManager.
Mobile Apps
Know the performance your
IT from anywhere, at
anytime with the iOS and
Android apps.
Affordable
Buy licenses for the no. of
devices that you wish to
manage! Starts @ $595 for
25 devices.
Thank you
bharanikumar@manageengine.com
To know more, visit www.OpManager.com

More Related Content

What's hot (20)

PPTX
Cisco Identity Services Engine (ISE)
Anwesh Dixit
 
PPTX
Overview OpManager
Fanky Christian
 
PDF
Tracking Noisy Behavior and Risk-Based Alerting with ATT&CK
MITRE ATT&CK
 
PPT
Fortinet
Petre-doru Dragus
 
PPTX
Best Network Performance Monitoring Tool
Joe Shestak
 
PDF
Cisco Digital Network Architecture - Introducing the Network Intuitive
Cisco Canada
 
PDF
Microsoft Azure Security Overview
Alert Logic
 
PPTX
Microsoft Defender for Endpoint
Cheah Eng Soon
 
PPTX
C2 Matrix A Comparison of Command and Control Frameworks
Jorge Orchilles
 
PPTX
Access Management with Aruba ClearPass
Aruba, a Hewlett Packard Enterprise company
 
PDF
Mapping to MITRE ATT&CK: Enhancing Operations Through the Tracking of Interac...
MITRE ATT&CK
 
PPTX
Azure Security Overview
Allen Brokken
 
PPTX
Introduction to SDN and NFV
Basim Aly (JNCIP-SP, JNCIP-ENT)
 
PPTX
Exchange server.pptx
Vignesh kumar
 
PDF
State of the ATTACK
MITRE - ATT&CKcon
 
PDF
Fortigate Firewall How to - DLP
IPMAX s.r.l.
 
PDF
Helping Small Companies Leverage CTI with an Open Source Threat Mapping
MITRE - ATT&CKcon
 
PPTX
SD-WAN PROTOCOLS
bilal anjum
 
PPT
Fortigate Training
NCS Computech Ltd.
 
PDF
EVPN for Cloud Builders
Juniper Networks (日本)
 
Cisco Identity Services Engine (ISE)
Anwesh Dixit
 
Overview OpManager
Fanky Christian
 
Tracking Noisy Behavior and Risk-Based Alerting with ATT&CK
MITRE ATT&CK
 
Best Network Performance Monitoring Tool
Joe Shestak
 
Cisco Digital Network Architecture - Introducing the Network Intuitive
Cisco Canada
 
Microsoft Azure Security Overview
Alert Logic
 
Microsoft Defender for Endpoint
Cheah Eng Soon
 
C2 Matrix A Comparison of Command and Control Frameworks
Jorge Orchilles
 
Access Management with Aruba ClearPass
Aruba, a Hewlett Packard Enterprise company
 
Mapping to MITRE ATT&CK: Enhancing Operations Through the Tracking of Interac...
MITRE ATT&CK
 
Azure Security Overview
Allen Brokken
 
Introduction to SDN and NFV
Basim Aly (JNCIP-SP, JNCIP-ENT)
 
Exchange server.pptx
Vignesh kumar
 
State of the ATTACK
MITRE - ATT&CKcon
 
Fortigate Firewall How to - DLP
IPMAX s.r.l.
 
Helping Small Companies Leverage CTI with an Open Source Threat Mapping
MITRE - ATT&CKcon
 
SD-WAN PROTOCOLS
bilal anjum
 
Fortigate Training
NCS Computech Ltd.
 
EVPN for Cloud Builders
Juniper Networks (日本)
 

Viewers also liked (6)

PPT
OpManager Major Features
tecanody
 
PPTX
The Who, What, and How of Health Outcome Measures
Health Catalyst
 
PDF
Achieving Agility and Scale for Your Data Lake - Talend
Talend
 
PPTX
Landmark Review of Population Health Management
Health Catalyst
 
PPTX
How to survive cms's most recent 3% hospital readmissions penalties increase
Health Catalyst
 
PPTX
cloud computing ppt
himanshuawasthi2109
 
OpManager Major Features
tecanody
 
The Who, What, and How of Health Outcome Measures
Health Catalyst
 
Achieving Agility and Scale for Your Data Lake - Talend
Talend
 
Landmark Review of Population Health Management
Health Catalyst
 
How to survive cms's most recent 3% hospital readmissions penalties increase
Health Catalyst
 
cloud computing ppt
himanshuawasthi2109
 
Ad

Similar to OpManager Technical Overview (20)

PPTX
New OpManager v12
Inuit AB
 
PPTX
Opmanager technical overview
ManageEngine, Zoho Corporation
 
PPTX
5 ways you can benefit from OpManager Plus
ManageEngine, Zoho Corporation
 
PDF
OpManager-Overview-30-9-14.pdf
ssusera181ef
 
PPT
Vincent Haynes(Cis516 Assignment Week 9)
vhaynes
 
PPTX
Simplifying IT operations manament with OpManager
ManageEngine, Zoho Corporation
 
PPT
OpManager Review
guesta265a9
 
PDF
Manage engine OpManager Analyst Review
GetApp
 
PPTX
Opmanager Workshop - Middle East
ManageEngine, Zoho Corporation
 
PPT
Irizarry M Cis516 Week7
logic_5
 
PPT
Week 9 Assignment Op Manager
leeharris
 
PPTX
Leading Indian IT Services Company uses OpManager
ManageEngine, Zoho Corporation
 
PPTX
Network and server performance monitoring training
ManageEngine, Zoho Corporation
 
PPTX
Free OpManager training_Part 1- Discovery & classification
ManageEngine, Zoho Corporation
 
PPT
Cis516 Week 7
guestc7ca10
 
PPT
O P Manager
blakka
 
PPT
Op Manager
ahawkins
 
PPTX
Topic on DCIM - ManageEngine | OpManager
Rex Antony Peter
 
PPTX
Gulf Chemicals & Metallurgy manages 1700 interfaces with OpManager
ManageEngine, Zoho Corporation
 
PPT
Role of OpManager in event and fault management
ManageEngine
 
New OpManager v12
Inuit AB
 
Opmanager technical overview
ManageEngine, Zoho Corporation
 
5 ways you can benefit from OpManager Plus
ManageEngine, Zoho Corporation
 
OpManager-Overview-30-9-14.pdf
ssusera181ef
 
Vincent Haynes(Cis516 Assignment Week 9)
vhaynes
 
Simplifying IT operations manament with OpManager
ManageEngine, Zoho Corporation
 
OpManager Review
guesta265a9
 
Manage engine OpManager Analyst Review
GetApp
 
Opmanager Workshop - Middle East
ManageEngine, Zoho Corporation
 
Irizarry M Cis516 Week7
logic_5
 
Week 9 Assignment Op Manager
leeharris
 
Leading Indian IT Services Company uses OpManager
ManageEngine, Zoho Corporation
 
Network and server performance monitoring training
ManageEngine, Zoho Corporation
 
Free OpManager training_Part 1- Discovery & classification
ManageEngine, Zoho Corporation
 
Cis516 Week 7
guestc7ca10
 
O P Manager
blakka
 
Op Manager
ahawkins
 
Topic on DCIM - ManageEngine | OpManager
Rex Antony Peter
 
Gulf Chemicals & Metallurgy manages 1700 interfaces with OpManager
ManageEngine, Zoho Corporation
 
Role of OpManager in event and fault management
ManageEngine
 
Ad

More from ManageEngine, Zoho Corporation (20)

PPTX
Create seamless customer experiences
ManageEngine, Zoho Corporation
 
PDF
From web interface to database: Monitor what matters
ManageEngine, Zoho Corporation
 
PDF
NetFlow Analyzer Free Training Series Part I - May 2020
ManageEngine, Zoho Corporation
 
PDF
Overcome real-time server and VM monitoring challenges
ManageEngine, Zoho Corporation
 
PPTX
Modernizing Cloud and Hyperconverged Infrastructure monitoring
ManageEngine, Zoho Corporation
 
PPTX
Deliver seamless digital experience
ManageEngine, Zoho Corporation
 
PDF
Free NetFlow Analyzer training Season 1 Part 2 - Feb 2020
ManageEngine, Zoho Corporation
 
PPTX
From web interface to the database:Monitor all that matters
ManageEngine, Zoho Corporation
 
PDF
NetFlow Analyzer Training Season 1 Part 1 - Feb 2020 - EST
ManageEngine, Zoho Corporation
 
PDF
NetFlow Analyzer Training Season 1 Part 1 - Feb 2020 - GMT
ManageEngine, Zoho Corporation
 
PDF
NetFlow Analyzer Product Overview
ManageEngine, Zoho Corporation
 
PPTX
Monitoring cloud applications and hyperconverged infrastructure
ManageEngine, Zoho Corporation
 
PPTX
Building the right website monitoring strategy
ManageEngine, Zoho Corporation
 
PPTX
Unlock the value of your big data infrastructure
ManageEngine, Zoho Corporation
 
PPTX
Key to optimal end user experience
ManageEngine, Zoho Corporation
 
PPTX
Monitoring cloud applications and containers
ManageEngine, Zoho Corporation
 
PPTX
implementing the right website monitoring strategy
ManageEngine, Zoho Corporation
 
PPTX
Big data and non relational database
ManageEngine, Zoho Corporation
 
PPTX
Visibility-from web application interface to the database
ManageEngine, Zoho Corporation
 
PPTX
Free OpManager training Part 4 - Monitoring Network Performance and Network Maps
ManageEngine, Zoho Corporation
 
Create seamless customer experiences
ManageEngine, Zoho Corporation
 
From web interface to database: Monitor what matters
ManageEngine, Zoho Corporation
 
NetFlow Analyzer Free Training Series Part I - May 2020
ManageEngine, Zoho Corporation
 
Overcome real-time server and VM monitoring challenges
ManageEngine, Zoho Corporation
 
Modernizing Cloud and Hyperconverged Infrastructure monitoring
ManageEngine, Zoho Corporation
 
Deliver seamless digital experience
ManageEngine, Zoho Corporation
 
Free NetFlow Analyzer training Season 1 Part 2 - Feb 2020
ManageEngine, Zoho Corporation
 
From web interface to the database:Monitor all that matters
ManageEngine, Zoho Corporation
 
NetFlow Analyzer Training Season 1 Part 1 - Feb 2020 - EST
ManageEngine, Zoho Corporation
 
NetFlow Analyzer Training Season 1 Part 1 - Feb 2020 - GMT
ManageEngine, Zoho Corporation
 
NetFlow Analyzer Product Overview
ManageEngine, Zoho Corporation
 
Monitoring cloud applications and hyperconverged infrastructure
ManageEngine, Zoho Corporation
 
Building the right website monitoring strategy
ManageEngine, Zoho Corporation
 
Unlock the value of your big data infrastructure
ManageEngine, Zoho Corporation
 
Key to optimal end user experience
ManageEngine, Zoho Corporation
 
Monitoring cloud applications and containers
ManageEngine, Zoho Corporation
 
implementing the right website monitoring strategy
ManageEngine, Zoho Corporation
 
Big data and non relational database
ManageEngine, Zoho Corporation
 
Visibility-from web application interface to the database
ManageEngine, Zoho Corporation
 
Free OpManager training Part 4 - Monitoring Network Performance and Network Maps
ManageEngine, Zoho Corporation
 

Recently uploaded (20)

PDF
Peak of Data & AI Encore - Real-Time Insights & Scalable Editing with ArcGIS
Safe Software
 
PDF
introduction to computer hardware and sofeware
chauhanshraddha2007
 
PPTX
Dev Dives: Automate, test, and deploy in one place—with Unified Developer Exp...
AndreeaTom
 
PDF
State-Dependent Conformal Perception Bounds for Neuro-Symbolic Verification
Ivan Ruchkin
 
PDF
NewMind AI Weekly Chronicles – July’25, Week III
NewMind AI
 
PDF
Per Axbom: The spectacular lies of maps
Nexer Digital
 
PPTX
Agile Chennai 18-19 July 2025 | Workshop - Enhancing Agile Collaboration with...
AgileNetwork
 
PPTX
The Future of AI & Machine Learning.pptx
pritsen4700
 
PDF
MASTERDECK GRAPHSUMMIT SYDNEY (Public).pdf
Neo4j
 
PDF
Market Insight : ETH Dominance Returns
CIFDAQ
 
PDF
OFFOFFBOX™ – A New Era for African Film | Startup Presentation
ambaicciwalkerbrian
 
PDF
Responsible AI and AI Ethics - By Sylvester Ebhonu
Sylvester Ebhonu
 
PPTX
Farrell_Programming Logic and Design slides_10e_ch02_PowerPoint.pptx
bashnahara11
 
PDF
Research-Fundamentals-and-Topic-Development.pdf
ayesha butalia
 
PDF
RAT Builders - How to Catch Them All [DeepSec 2024]
malmoeb
 
PPTX
Agile Chennai 18-19 July 2025 Ideathon | AI Powered Microfinance Literacy Gui...
AgileNetwork
 
PDF
Researching The Best Chat SDK Providers in 2025
Ray Fields
 
PDF
Build with AI and GDG Cloud Bydgoszcz- ADK .pdf
jaroslawgajewski1
 
PDF
A Strategic Analysis of the MVNO Wave in Emerging Markets.pdf
IPLOOK Networks
 
PDF
The Future of Mobile Is Context-Aware—Are You Ready?
iProgrammer Solutions Private Limited
 
Peak of Data & AI Encore - Real-Time Insights & Scalable Editing with ArcGIS
Safe Software
 
introduction to computer hardware and sofeware
chauhanshraddha2007
 
Dev Dives: Automate, test, and deploy in one place—with Unified Developer Exp...
AndreeaTom
 
State-Dependent Conformal Perception Bounds for Neuro-Symbolic Verification
Ivan Ruchkin
 
NewMind AI Weekly Chronicles – July’25, Week III
NewMind AI
 
Per Axbom: The spectacular lies of maps
Nexer Digital
 
Agile Chennai 18-19 July 2025 | Workshop - Enhancing Agile Collaboration with...
AgileNetwork
 
The Future of AI & Machine Learning.pptx
pritsen4700
 
MASTERDECK GRAPHSUMMIT SYDNEY (Public).pdf
Neo4j
 
Market Insight : ETH Dominance Returns
CIFDAQ
 
OFFOFFBOX™ – A New Era for African Film | Startup Presentation
ambaicciwalkerbrian
 
Responsible AI and AI Ethics - By Sylvester Ebhonu
Sylvester Ebhonu
 
Farrell_Programming Logic and Design slides_10e_ch02_PowerPoint.pptx
bashnahara11
 
Research-Fundamentals-and-Topic-Development.pdf
ayesha butalia
 
RAT Builders - How to Catch Them All [DeepSec 2024]
malmoeb
 
Agile Chennai 18-19 July 2025 Ideathon | AI Powered Microfinance Literacy Gui...
AgileNetwork
 
Researching The Best Chat SDK Providers in 2025
Ray Fields
 
Build with AI and GDG Cloud Bydgoszcz- ADK .pdf
jaroslawgajewski1
 
A Strategic Analysis of the MVNO Wave in Emerging Markets.pdf
IPLOOK Networks
 
The Future of Mobile Is Context-Aware—Are You Ready?
iProgrammer Solutions Private Limited
 

OpManager Technical Overview

  • 1. Manage your network smarter, with OpManager v12 Network Management Software in 1
  • 2. What’s unique about OpManager 12? Increased Visibility Great Control Network & Server Monitoring Bandwidth Analysis Firewall Log Analysis Configuration Management IP Address & Switch Port Management
  • 4. Monitor 100+ performance metrics such as CPU, Memory, Errors & Discards, Buffer Hits & Misses, & more. Monitor the availability, response time, and packet loss of the device 24/7. View the port status and configuration changes. Pull out detailed reports on the metrics to analyze the trend. Out-of-the-box templates for 1000+ Cisco, Juniper, Palo-alto, Huawei, HP, Foundry, Aruba, Netgear, Nortel & other network devices. Router/Switch Performance Monitoring
  • 5. ADVANCED Identify top bandwidth consuming users and applications via NetFlow, sFlow, jFlow, IP FIX, and much more. Apply QoS policies to regulate bandwidth for business critical apps. BASIC Monitor Tx/Rx traffic, errors, discards and utilization via SNMP. Administratively UP/Down an interface. Interface Monitoring
  • 6. Get a summary on your network traffic and identify the top conversations, applications, protocols, and QoS by bandwidth. Find out detailed reports on applications by IN & OUT traffic. Know the top sources & destinations by IN & OUT traffic. Monitor bandwidth by app-wise and shape traffic. Carryout network forensics and security analysis. Bandwidth Monitoring
  • 7. Monitor the bandwidth consumed by BYOD. Track the bandwidth usage by apps accessed by the end- users. Identify the access points connected by end-users. End-user Centric Bandwidth Monitoring
  • 8. Centrally collect, analyze and archive firewall logs for security and compliance. Automate compliance audits with reports for PCI DSS, ISO 27001, SANS, & more. Manage shadow IT. Track all changes done on firewall configurations. Get notified by Email and SMS. Manage firewall policies to enhance performance & security. Search raw log files and find out security activity in minutes. Firewall Log Management
  • 9. Manage device configurations, maintain history, compare versions, and upload changes from the web client itself. Get notified for unauthorized configuration changes via email and SMS. Revert faulty configurations. Define policies and check configurations for compliance. Acts as centralized repository for all your device configurations. All the configurations are encrypted and stored in the database. Configuration Management
  • 10. Scan IPv4 & IPv6 subnets to identify available and used IPs View full history of an IP address to know which devices were associated with it. Receive alerts when IP address state is changed, DNS revers and forward lookup fails, and more. Schedule scanning via SNMP, Ping, DNS, etc. at regular intervals. IP Address Management
  • 11. Periodically discover the devices connected to each port of a switch. Identify the port to which a device is connected from GUI itself. Gain visibility into the IP, MAC, VLAN, Status, and Availability of ports. Receive notifications for changes in the port status. Know all the MAC addresses connected to a port. Generate reports on port usage, port speed, and port type. Switch Port Management
  • 13. Monitor CPU, Memory & Disk Utilization of Windows and Linux servers via WMI and SNMP/CLI. Monitor Windows processes and services, and TCP services. Monitor Windows events with the event ID. Monitor Files and Folders for size, existence, count, and modification. Out-of-the-box includes templates with monitors for all leading server operating systems. Windows/Linux Server Monitoring
  • 14. Monitor Host and VM performance via vCenter APIs, WMI, and Xen APIs. Monitor performance metrics such as CPU ready, Memory Swap, Disk I/O Usage, Disk Read Requests, Datastore Write Requests, and 50 more. Out-of the-box supports vMotion, Live Migration and Xen Motion. Map VM-Host relationship for better understanding. Manage VM sprawl. VMware, Hyper-V & Xen Monitoring
  • 16. OpManager creates alarms and events to indicate the fault found by it. View all alarms and events by severity. Get notified by faults via Email, SMS. Trigger Workflow Automation to automatically remediate faults. Acknowledge/unacknowledge alarms. Add notes to alarms for more information. Escalate alarms if not resolved in time. Alarms & Notifications
  • 17. Create notification profiles to alert the respective teams/admins. Out-of-the-box offers alert profiles such as Email, SMS, Log a Ticket, & more. Create escalation rules to escalate alarms that are not cleared or acknowledged in specified time interval. Notification Profiles
  • 18. Multiple thresholds help receive notification of faults at various levels. Alarms are also classified accordingly when they get generated. Multi-level Thresholds
  • 19. If-else condition based workflows to automate L1 & L2 troubleshooting activities and repeated IT tasks. Allows you to revert configurations, power off/on a VM, start & stop a process or service, and more. Out-of-the-box offers over 70 actions. Allows you to execute scripts. Schedule workflows for repeated tasks. WorkFlow Automation
  • 20. OpManager collects traps and syslogs to detect faults in the network. Create profiles to filter traps and syslogs that contain information about network faults and raise alarms. Forward traps and syslogs to another receiver. Traps & Syslogs
  • 21. Gather more information and analyze the fault with the diagnostic tools. Carry out actions such as Ping, SNMP Ping, Proxy Ping, Trace Router and WMI Query. Tools
  • 22. Discuss IT issues on a Facebook-like collaboration wall. Share articles, troubleshooting tips, KBs, and more. Post comments and like the posts and comments made by peers. Group Discussion
  • 24. View the performance of your entire network at-a-glance. Find out all the operational status of your network with 230+ out-of-the-box widgets. Create multiple dashboards and embed on your NOC screens. Pull out top 10 data across sites by CPU, Memory, Availability, Traffic, Recent Configurations, and more. Navigate from widget to snapshot page for detailed analysis. Dashboards & Widgets
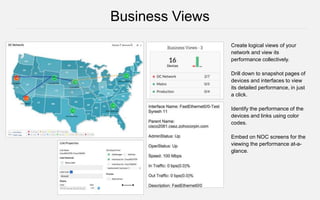
  • 25. Create logical views of your network and view its performance collectively. Drill down to snapshot pages of devices and interfaces to view its detailed performance, in just a click. Identify the performance of the devices and links using color codes. Embed on NOC screens for the viewing the performance at-a- glance. Business Views
  • 26. Visualize the network geographically with Google maps. Provide the latitude and longitude details to keep the devices on their exact location. Google Maps
  • 27. Visualize your L2 topology. Discover network devices via seed device or core router. Rediscover network to automatically add or remove devices from the map. Export map to Visio and PDF. Layer 2 Maps
  • 28. Create mock view of racks in your data center with the devices mounted on them. Create data center floor views with the racks. Monitor the health of the rack and data center floor. View the performance of the devices using color codes. Data Center Builder
  • 30. Out-of-the-box offers 108 performance reports. Schedule and email reports. Create custom reports with data of your choice. Export reports to XLS and PDF. Print reports from GUI. Easy-to-use Report Builder
  • 32. Install OpManager in less than 10 minutes. Bundles PQSQL database. Support MSSQL also. No additional components required when installing. Easy Installation
  • 33. Discover all devices in your network via SNMP, CLI and WMI protocols. Discover interfaces along with devices, if needed. Automatically map all devices under respective categories and start monitoring with the help of 1000+ templates bundled. Schedule discovery to add or remove devices. Ultrafast Discovery Engine
  • 34. Automatically configure monitors, notification profiles to newly added devices. Rule Engine assigns monitors and notification profiles if the rules defined matches. Schedule rule engine or run on- demand. Discovery Rule Engine
  • 35. Monitor devices efficiently with templates. Out-of-the-box offers 1157 device templates and 232 interface templates. Add or remove monitors to templates and apply on the devices, in bulk. Create custom templates using MIBs. Share templates and import shared templates from ManageEngine community. Device & Interface Templates
  • 36. Apply, edit and remove configurations, in bulk. Helps you setup OpManager quickly. Quick Configuration Wizard
  • 38. Enterprise Edition for Distributed Monitoring Monitor geographically distributed sites from a centralized location with a Probe-Central architecture.
  • 39. Highly Scalable Monitor 1 million interfaces or 50,000 devices from a single server
  • 40. Failover Offers hot-standby secondary server support for high availability of OpManager.
  • 41. Mobile Apps Know the performance your IT from anywhere, at anytime with the iOS and Android apps.
  • 42. Affordable Buy licenses for the no. of devices that you wish to manage! Starts @ $595 for 25 devices.
  • 43. Thank you [email protected] To know more, visit www.OpManager.com