SlideShare a Scribd company logo
Linux Performance Profiling
and Monitoring
@wefinet – Werner Fischer,
Thomas-Krenn.AG
Image http://de.freeimages.com/photo/jaguar-xjr-1537119
2
Thomas-Krenn.AG
_ Server manufacturer from Bavaria
_ Well visited knowledge base,
Thomas-Krenn Wiki (parts in English)
3
Agenda
_ Collect Statistics
_ Sysstat Package
_ mpstat, vmstat,
pidstat, iostat
_ dstat, nicstat
_ sar, atop
_ Percona Cacti Template
_ Monitoring Plugins
_ Watch online
_ top
_ iotop
_ iftop
_ Tracing
_ perf_events
_ ftrace
_ perf-tools
_ Flame graphs
_ ADD-ON reg. CPU util
_ what means CPU util.?
_ tiptop
# find / -type f -name statistics
4
From Brendan Gregg, http://www.brendangregg.com/linuxperf.html5
From Brendan Gregg, http://www.brendangregg.com/linuxperf.html6
0
20
7
8
mpstat
_ Reports CPU related statistics (using /proc/stat)
_ Without Interval/Count → since system startup
_ CPU usage per Core (incl. Hyperthreading)
_ Check how well usage is balanced
# mpstat -P ALL
Linux 3.13.0-48-generic (X220) 2015-04-14 _x86_64_ (4 CPU)
14:28:21 CPU %usr %nice %sys %iowait %irq %soft %steal %guest %gnice %idle
14:28:21 all 11,59 0,09 3,62 0,03 0,00 0,04 0,00 0,00 0,00 84,64
14:28:21 0 6,45 0,05 1,87 0,04 0,00 0,07 0,00 0,00 0,00 91,53
14:28:21 1 16,44 0,11 5,56 0,01 0,00 0,00 0,00 0,00 0,00 77,89
14:28:21 2 17,15 0,14 5,55 0,03 0,00 0,05 0,00 0,00 0,00 77,08
14:28:21 3 16,27 0,11 4,89 0,01 0,00 0,02 0,00 0,00 0,00 78,70
# lscpu | grep -E 'core|socket'
Thread(s) per core: 2
Core(s) per socket: 2
9
mpstat
# mpstat -P ALL 1 2
Linux 3.13.0-48-generic (X220) 2015-04-14 _x86_64_ (4 CPU)
15:24:44 CPU %usr %nice %sys %iowait %irq %soft %steal %guest %gnice %idle
15:24:45 all 5,21 0,00 7,12 17,81 0,00 0,27 0,00 0,00 0,00 69,59
15:24:45 0 1,43 0,00 1,43 0,00 0,00 2,86 0,00 0,00 0,00 94,29
15:24:45 1 11,88 0,00 23,76 64,36 0,00 0,00 0,00 0,00 0,00 0,00
15:24:45 2 4,12 0,00 1,03 0,00 0,00 0,00 0,00 0,00 0,00 94,85
15:24:45 3 3,03 0,00 1,01 0,00 0,00 0,00 0,00 0,00 0,00 95,96
15:24:45 CPU %usr %nice %sys %iowait %irq %soft %steal %guest %gnice %idle
15:24:46 all 5,74 0,00 7,10 17,76 0,00 0,55 0,00 0,00 0,00 68,85
15:24:46 0 2,99 0,00 1,49 0,00 0,00 2,99 0,00 0,00 0,00 92,54
15:24:46 1 11,88 0,00 23,76 64,36 0,00 0,00 0,00 0,00 0,00 0,00
15:24:46 2 6,00 0,00 1,00 0,00 0,00 0,00 0,00 0,00 0,00 93,00
15:24:46 3 1,01 0,00 1,01 0,00 0,00 0,00 0,00 0,00 0,00 97,98
Core 1 is not idle
and also deals
with %iowait
10
vmstat
_ High Level Statistics about
_ Virtual memory
_ Swap/Paging
_ I/O statistics
_ System interrupts and context switches
_ CPU statistics
# vmstat 1
procs -----------memory---------- ---swap-- -----io---- -system-- ------cpu-----
r b swpd free buff cache si so bi bo in cs us sy id wa st
3 0 172 371856 137088 3125664 0 0 0 153060 7618 7059 17 9 56 17 0
3 0 172 416596 137096 3125704 0 0 0 163420 8689 7419 11 10 61 17 0
0 0 172 451716 137096 3089916 0 0 0 0 396 1848 3 1 96 0 0
0 0 172 413916 137108 3118796 0 0 0 52 502 2218 9 2 90 0 0
2 0 172 399756 137108 3118860 0 0 284884 0 14830 10941 10 13 66 12 0
1 1 172 364948 137108 3118988 0 0 310792 0 16204 12738 20 13 53 14 0
11
vmstat
_ Memory statistics
_ buff Raw disk blocks like filesystem metadata (superblocks,
inodes)
_ cache Memory used for data -> pages with actual contents
$ vmstat 1
procs -----------memory---------- ---swap-- -----io---- -system-- ------cpu-----
r b swpd free buff cache si so bi bo in cs us sy id wa st
0 0 172 607760 182172 3313684 0 0 159 496 154 222 18 6 76 0 0
0 0 172 607628 182172 3313684 0 0 0 52 387 2008 4 2 95 0 0
0 0 172 607348 182172 3313684 0 0 0 0 397 2034 4 1 95 0 0
0 0 172 606448 182172 3313684 0 0 0 0 378 1896 4 2 94 0 0
$ free
total used free shared buffers cached
Mem: 8056664 7450316 606348 491820 182172 3313684
-/+ buffers/cache: 3954460 4102204
Swap: 1048572 172 1048400
12
vmstat
_ Process related fields
_ r The number of runnable processes (running or waiting for
run time)
_ If high → indicator for CPU saturation
_ b The number of processes in uninterruptible sleep
_ Mostly waiting for I/O
# vmstat 1
procs -----------memory---------- ---swap-- -----io---- -system-- ------cpu-----
r b swpd free buff cache si so bi bo in cs us sy id wa st
[...]
0 1 172 404768 137088 3125664 0 0 0 167524 9029 6955 6 6 70 18 0
0 1 172 399956 137088 3125664 0 0 0 138340 8133 6165 7 7 68 19 0
$ ps -eo ppid,pid,user,stat,pcpu,comm,wchan:32 | grep ext4
[...]
7159 7161 root Ds 3.2 fio ext4_file_write
7159 7162 root Ds 3.2 fio ext4_file_write
7159 7164 root Ds 3.2 fio ext4_file_write
Kernel function process
is sleeping on
Processes doing I/O
can be in waiting state
13
vmstat plots, e.g. gnuplot
https://clusterbuffer.wordpress.com/admin-tools/vmstat-plotter/
Drawing interrupts
and context switches
But we are not satisfied
with summaries and overviews...
14
What is PID 9059 doing?
15
16
pidstat
_ Report statistics for tasks being managed by
kernel
_ CPU bound → identify peak activity
$ top -b -n 1 -d 2 -o %CPU | head
[...]
PID USER PR NI VIRT RES SHR S %CPU %MEM TIME+ COMMAND
9059 wfischer 20 0 47532 21132 2444 R 96,9 0,3 0:02.14 python
1 root 20 0 33880 3256 1500 S 0,0 0,0 0:02.35 init
$ pidstat -p 9059 -u 1 -l
Linux 3.13.0-48-generic (X220) 2015-04-15 _x86_64_ (4 CPU)
10:11:04 UID PID %usr %system %guest %CPU CPU Command
10:11:05 1000 9059 100,00 0,00 0,00 100,00 0 python ijk-matrix.py
-i matrix.in
10:11:06 1000 9059 100,00 0,00 0,00 100,00 0 python ijk-matrix.py
-i matrix.in
10:11:07 1000 9059 100,00 0,00 0,00 100,00 0 python ijk-matrix.py
-i matrix.in
Even check command
line arguments (“-l”) !
17
pidstat
_ I/O bound → device report
# mpstat -P ALL 1
10:25:31 CPU %usr %nice %sys %iowait %irq %soft %steal %guest %gnice %idle
10:25:32 all 14,88 0,00 9,40 13,84 0,00 1,04 0,00 0,00 0,00 60,84
10:25:32 0 22,45 0,00 1,02 0,00 0,00 0,00 0,00 0,00 0,00 76,53
10:25:32 1 13,73 0,00 34,31 51,96 0,00 0,00 0,00 0,00 0,00 0,00
10:25:32 2 17,86 0,00 0,00 0,00 0,00 3,57 0,00 0,00 0,00 78,57
10:25:32 3 6,12 0,00 0,00 0,00 0,00 0,00 0,00 0,00 0,00 93,88
# pidstat -d 1
Linux 3.13.0-48-generic (X220) 2015-04-15 _x86_64_ (4 CPU)
10:26:35 UID PID kB_rd/s kB_wr/s kB_ccwr/s Command
10:26:36 0 9208 0,00 2303,85 0,00 fio
10:26:36 0 9209 0,00 2996,15 0,00 fio
10:26:36 0 9210 0,00 2023,08 0,00 fio
10:26:36 0 9211 0,00 1284,62 0,00 fio
Which process
is causing %iowait?
Device report reveals
command and I/O
18
pidstat
_ How much memory is PID 8461 using?
_ Major page faults require loading memory page from disk
→ more RAM needed!
# pidstat -r -p 8461 1 3
Linux 3.13.0-49-generic (X220) 2015-04-21 _x86_64_ (4 CPU)
10:09:06 UID PID minflt/s majflt/s VSZ RSS %MEM Command
10:09:07 1000 8461 8,00 0,00 2018384 786688 9,76 firefox
10:09:08 1000 8461 11,00 0,00 2018384 786688 9,76 firefox
10:09:09 1000 8461 23,00 0,00 2018448 786892 9,77 firefox
Average: 1000 8461 14,00 0,00 2018405 786756 9,77 firefox
Current used share
of physical memory
Minor and major
page faults
19
iostat
_ I/O subsystem statistics
_ CPU (-c) or device utilization (-d) report
_ Without argument → summary since boot
_ Skip that with -y option
# iostat
Linux 3.13.0-48-generic (X220) 2015-04-15 _x86_64_ (4 CPU)
avg-cpu: %user %nice %system %iowait %steal %idle
16,16 0,09 4,79 0,46 0,00 78,50
Device: tps kB_read/s kB_wrtn/s kB_read kB_wrtn
sda 83,80 41,64 531,43 22375057 285581196
20
iostat
Let's start the
live demo #1
21
iostat
_ CPU util report → %iowait
_ Not really reliable → %iowait is some kind of
%idle time
# taskset 1 fio –rw=randwrite [...] &
# iostat -y -c 1 3
[…]
avg-cpu: %user %nice %system %iowait %steal %idle
17,32 0,00 6,56 13,65 0,00 62,47
# taskset 1 sh -c "while true; do true; done" &
# iostat -y -c 1 3
avg-cpu: %user %nice %system %iowait %steal %idle
35,59 0,00 7,02 0,00 0,00 57,39
http://www.percona.com/blog/2014/06/03/trust-vmstat-iowait-numbers/
22
iostat
_ Extended device util report (“-x”) → %util
_ man iostat → … for devices serving request serially, for parallel
processing (RAID arrays and SSDs), this number does not reflect their
performance limits.
_ In theory
_ 94,4% util
→ 23032 IOPS
_ 99,6% util
→ 24300 IOPS
23
iostat
# iostat -y -d -x 1 3
Linux 3.13.0-48-generic (X220) 2015-04-15 _x86_64_ (4 CPU)
Device: rrqm/s wrqm/s r/s w/s rkB/s wkB/s avgrq-sz avgqu-sz await
r_await w_await svctm %util
sda 0,00 2,00 0,00 23032,00 0,00 92136,00 8,00 2,90 0,13
0,00 0,13 0,04 94,40
# iostat -y -d -x 1 3
Linux 3.13.0-48-generic (X220) 2015-04-15 _x86_64_ (4 CPU)
Device: rrqm/s wrqm/s r/s w/s rkB/s wkB/s avgrq-sz avgqu-sz await
r_await w_await svctm %util
sda 0,00 2917,00 0,00 43175,00 0,00 184500,00 8,55 135,75 3,15
0,00 3,15 0,02 99,60
Only 5% util increase,
but IOPS nearly doubled!
24
https://www.thomas-krenn.com/de/wiki/Linux_Storage_Stack_Diagramm
25
iostat -cx / -dx
_ avgqu-sz Avg. queue length of requests issued
_ (delta[time_in_queue] / interval) / 1000.0
_ time_in_queue Requets waiting for device, effected by in_flight
_ await Avg. time requests being served
_ delta[read_ticks + write_ticks] / delta[read_IOs +
write_Ios]
_ ticks also effected by in_flight
_ Therefore serving more requests while await is
not increasing, is a good performance indicator
- Monitoring IO Performance using iostat and pt-diskstats
- Block layer statistics
4
20
26
27
dstat
_ Combines several classical tools
_ Replacement for vmstat, iostat, ifstat
_ Prints metrics and uses colors
_ Has a plugin concept
28
nicstat
_ Print network device statistics
_ %Util depends on speed and duplex mode
_ Sat also takes errors into account
# nicstat -l
Int Loopback Mbit/s Duplex State
vboxnet0 No 0 unkn up
eth0 No 1000 full up
lo Yes - unkn up
wlan0 No 0 unkn up
# nicstat -i eth0 1 5
Time Int rKB/s wKB/s rPk/s wPk/s rAvs wAvs %Util Sat
14:52:21 eth0 3.08 0.36 3.13 2.48 1007.6 149.4 0.00 0.05
14:52:22 eth0 19.89 1.23 16.98 17.97 1199.6 70.00 0.02 0.00
14:52:23 eth0 21.42 1.09 21.99 16.00 997.1 70.00 0.02 0.00
# nicstat -i eth0 -t 1 2
14:57:36 InKB OutKB InSeg OutSeg Reset AttF %ReTX InConn OutCon Drops
TCP 0.00 0.00 2.88 2.51 0.02 0.00 0.000 0.00 0.04 0.00
14:57:37 InKB OutKB InSeg OutSeg Reset AttF %ReTX InConn OutCon Drops
TCP 0.00 0.00 0.00 0.00 0.00 0.00 0.000 0.00 0.00 0.00
Check if your network is
saturated, Drops can be
an indicator!
Do you have a history of your
system's performance data?
yes no
29
30
sar (part of sysstat)
_ It's easy with system activity reporter
_ sar, sadc, sa1 and sa2, sadf
http://www.brendangregg.com/Perf/linux_observability_sar.png
31
ksar
_ LC_ALL=POSIX sar -A -f sa10 > ksar.out.txt
Mitigates character encoding
and number format problems
32
Percona Cacti Template
_ Percona Linux Monitoring Template for Cacti
_ generate many graphs easily
https://www.percona.com/doc/percona-monitoring-
plugins/1.1/cacti/linux-templates.html
33
Monitoring Plugins
_ Example:
_ check_cpu.sh
_ There is still work to be
done …
_ e.g. plugins based on sar
34
Agenda
_ Collect Statistics
_ Sysstat Package
_ mpstat, vmstat,
pidstat, iostat
_ dstat, nicstat
_ sar, atop
_ Percona Cacti Template
_ Monitoring Plugins
_ Watch online
_ top
_ iotop
_ iftop
_ Tracing
_ perf_events
_ ftrace
_ perf-tools
_ Flame graphs
35
top
_ System summary at beginning
_ Per process metrics afterwards
_ Default sorted by CPU usage
$ top -b -n 1| head -15
top - 15:33:50 up 3 days, 19:02, 3 users, load average: 0.13, 0.51, 0.59
Tasks: 668 total, 1 running, 667 sleeping, 0 stopped, 0 zombie
Cpu(s): 1.5%us, 0.3%sy, 0.1%ni, 98.1%id, 0.0%wa, 0.0%hi, 0.0%si, 0.0%st
Mem: 132009356k total, 23457172k used, 108552184k free, 1600120k buffers
Swap: 3904444k total, 0k used, 3904444k free, 12682188k cached
PID USER PR NI VIRT RES SHR S %CPU %MEM TIME+ COMMAND
29276 root 20 0 6928 3488 668 S 19 0.0 22:55.72 ossec-syscheckd
1193 gschoenb 20 0 17728 1740 936 R 4 0.0 0:00.02 top
11257 root 20 0 22640 2636 1840 S 4 0.0 70:38.88 openvpn
19907 www-data 20 0 197m 61m 52m S 4 0.0 0:06.18 apache2
775 root 20 0 0 0 0 S 2 0.0 8:03.13 md3_raid10
3712 root 39 19 0 0 0 S 2 0.0 22:45.85 kipmi0
12807 root -3 0 0 0 0 S 2 0.0 6:20.30 drbd2_asender
18653 root 20 0 0 0 0 S 2 0.0 12:40.19 drbd1_receiver
1, 5 and 15 min
load average
36
top
_ Memory usage
_ VIRT The total size of virtual memory for the process
_ Also including e.g. shared libraries, not already mapped heap or
swap
_ how much memory the program is able to access at the moment
_ RES How many blocks are really allocated and mapped to
address space → resident
_ how much actual physical memory a process is consuming
_ SHR
_ how much of the VIRT size is actually sharable
- https://www.linux.com/learn/tutorials/42048-uncover-the-meaning-of-tops-statistics
- http://www.linuxdevcenter.com/pub/a/linux/2006/11/30/linux-out-of-memory.html
37
top
_ Can consume resources on it's own
_ Toggle f and select fields, e.g. SWAP
_ -u let's you see processes from a user
_ Toggle k to kill a PID
_ Toggle r to renice a PID
_ But
_ top can miss short living processes
_ high %CPU → so what?
_ Keep an eye on the tracing part
38
htop
_ „Super advanced“ top
_ Uses colors, views can be customized
39
iotop
_ Simple top like I/O monitor
_ Which process is causing I/O
_ Filtering specific PID is possible
# iotop -o -b
Total DISK READ : 0.00 B/s | Total DISK WRITE : 63.94 M/s
Actual DISK READ: 0.00 B/s | Actual DISK WRITE: 63.90 M/s
TID PRIO USER DISK READ DISK WRITE SWAPIN IO COMMAND
19153 be/4 root 0.00 B/s 63.89 M/s 0.00 % 75.44 % fio --rw=randwrite --name=test
--filename=test.fio --size=300M --direct=1 --bs=4k
17715 be/4 gschoenb 0.00 B/s 46.18 K/s 0.00 % 0.00 % firefox [mozStorage #1]
# iotop -o -b
Total DISK READ : 69.02 M/s | Total DISK WRITE : 65.92 K/s
Actual DISK READ: 69.02 M/s | Actual DISK WRITE: 345.12 K/s
TID PRIO USER DISK READ DISK WRITE SWAPIN IO COMMAND
19176 be/4 root 69.02 M/s 0.00 B/s 0.00 % 88.28 % fio --rw=read --name=test
--filename=test.fio --size=300M --direct=1 --bs=8k
Show writes, reads
and command in
realtime
40
Bandwidth live usage
_ iftop
_ Per interface usage
_ nethogs
_ Per process
NetHogs version 0.8.0
PID USER PROGRAM DEV SENT RECEIVED
17692 gschoenb /usr/lib/firefox/firefox eth0 0.162 0.194 KB/sec
16585 root /usr/bin/ssh eth0 0.000 0.000 KB/sec
16611 gschoenb evolution eth0 0.000 0.000 KB/sec
? root unknown TCP 0.000 0.000 KB/sec
TOTAL 0.162 0.194 KB/sec
13
20
41
42
Agenda
_ Collect Statistics
_ Sysstat Package
_ mpstat, vmstat,
pidstat, iostat
_ dstat, nicstat
_ sar, atop
_ Percona Cacti Template
_ Monitoring Plugins
_ Watch online
_ top
_ iotop
_ iftop
_ Tracing
_ perf_events
_ ftrace
_ perf-tools
_ Flame graphs
# whereis tracing
43
44
Profiling
_ Create profile about usage characteristics
_ Count specific samples/events
_ Count objects
_ Collecting statistics about tracepoints
_ Lines of kernel code with defined event
_ Next slides focus on system profiling
_ ftrace
_ perf_events and perf
45
ftrace
_ Part of the Linux kernel since 2.6.27 (2008)
_ What is going on inside the kernel
_ Common task is to trace events
_ With ftrace configured, only debugfs is
required
# cat /proc/sys/kernel/ftrace_enabled
1
# mount | grep debug
none on /sys/kernel/debug type debugfs (rw)
/sys/kernel/debug/tracing# cat available_tracers
blk mmiotrace function_graph wakeup_rt wakeup function nop
Most widely applicable,
traces kernel function
calls
46
iostat
Let's start the
live demo #2
47
ftrace
_ Interact with files in sys
_ Easier with trace-cmd → interface for sys files
# less /sys/kernel/debug/tracing/trace
#!/bin/bash
DEBUGFS=`grep debugfs /proc/mounts | awk '{ print $2; }'`
echo $$ > $DEBUGFS/tracing/set_ftrace_pid
echo function > $DEBUGFS/tracing/current_tracer
echo 1 > $DEBUGFS/tracing/tracing_on
$*
echo 0 > $DEBUGFS/tracing/tracing_on View the
recorded trace
48
perf_events and perf
_ Used to be called performance counters for
Linux
_ A lot of updates for kernel 4.1
_ https://lkml.org/lkml/2015/4/14/264
_ CPU performance counters, tracepoints,
kprobes and uprobes
_ Per package with linux-tools-common
# which perf
/usr/bin/perf
# dpkg -S /usr/bin/perf
linux-tools-common: /usr/bin/perf
49
perf list
_ perf list
_ Shows supported events
# perf list | wc -l
1779
# perf list | grep Hardware
cpu-cycles OR cycles [Hardware event]
instructions [Hardware event]
cache-references [Hardware event]
cache-misses [Hardware event]
branch-instructions OR branches [Hardware event]
branch-misses [Hardware event]
bus-cycles [Hardware event]
stalled-cycles-frontend OR idle-cycles-frontend [Hardware event]
stalled-cycles-backend OR idle-cycles-backend [Hardware event]
ref-cycles [Hardware event]
L1-dcache-loads [Hardware cache event]
L1-dcache-load-misses [Hardware cache event]
L1-dcache-stores [Hardware cache event]
L1-dcache-store-misses [Hardware cache event]
This also includes
static tracepoints
50
Raw CPU counters
_ Each CPU has it's own raw counters
_ They should be documented by the hardware manufacturer
_ https://download.01.org/perfmon/
_ libpfm4 is a nice way to find raw masks
# perf list | grep rNNN
rNNN [Raw hardware event descriptor]
# git clone git://perfmon2.git.sourceforge.net/gitroot/perfmon2/libpfm4
# cd libpfm4
# make
# cd examples/
# ./showevtinfo | grep LLC | grep MISSES
Name : LLC_MISSES
[...]
# ./check_events LLC_MISSES | grep Codes
Codes : 0x53412e
# perf stat -e r53412e sleep 5
Now we collect last
level cache misses
with the raw mask
51
Tracepoints
_ perf also has trace functionalities
_ Filesystem
_ Block layer
_ Syscalls
# perf list | grep -i trace | wc -l
1716
# perf stat -e 'syscalls:sys_enter_mmap' ./helloWorld.out
Hello world!
Performance counter stats for './helloWorld.out':
8 syscalls:sys_enter_mmap
0,000556961 seconds time elapsed
52
perf stat
_ Get a counter summary
# perf stat python numpy-matrix.py -i matrix.in
Performance counter stats for 'python numpy-matrix.py -i matrix.in':
576,104221 task-clock (msec) # 0,930 CPUs utilized
319 context-switches # 0,554 K/sec
4 cpu-migrations # 0,007 K/sec
9.738 page-faults # 0,017 M/sec
1.743.664.199 cycles # 3,027 GHz [82,63%]
831.364.029 stalled-cycles-frontend # 47,68% frontend cycles idle [83,75%]
458.760.523 stalled-cycles-backend # 26,31% backend cycles idle [67,26%]
2.793.953.303 instructions # 1,60 insns per cycle
# 0,30 stalled cycles per insn [84,28%]
573.342.473 branches # 995,206 M/sec [83,78%]
3.586.249 branch-misses # 0,63% of all branches [82,70%]
0,619482128 seconds time elapsed
A way to compare
performance of
different algorithms
53
perf record
_ Record samples to a file
_ Can be post-processed with perf report
_ -a records on all CPUs
_ -g records call graphs
_ Install debug symbols
# perf record -a -g sleep 5
[ perf record: Woken up 4 times to write data ]
[ perf record: Captured and wrote 2.157 MB perf.data (~94254 samples) ]
-a nice way to record
what's currently
running on all CPUs
-g enables call-graph
54
perf report
_ Displays profile of a record
_ Can be sorted and or filtered
_ Shows all samples
55
# perf report -i perf.data.dd --stdio --showcpuutilization --sort comm,dso
[...]
# Overhead sys usr Command Shared Object
# ........ ........ ........ ....... .................
95.00% 95.00% 0.00% dd [kernel.kallsyms]
|
|--33.22%-- _aesni_enc1
| __ablk_encrypt
| ablk_encrypt
| crypt_scatterlist
| crypt_extent
| ecryptfs_encrypt_page
| ecryptfs_write_end
| generic_file_buffered_write
| __generic_file_aio_write
| generic_file_aio_write
| do_sync_write
| vfs_write
| sys_write
| system_call_fastpath
| __GI___libc_write
| 0x415f65643d524550
|--9.11%-- _cond_resched
| |
| |--57.94%-- ext4_dirty_inode
| | __mark_inode_dirty
| | generic_write_end
| | ext4_da_write_end
| | generic_file_buffered_write
Command and shared object
Traced method
dd writes data
56
perf-tools
_ By Brendan Gregg
_ https://github.com/brendangregg/perf-tools
_ Mostly quick hacks, read Warnings!
_ Using perf_events and ftrace
_ Good examples what can be done with perf and
ftrace
_ iosnoop Shows I/O access for commands, including latency
_ cachestat Linux page cache hit/miss statistics
_ functrace Count kernel functions matching wildcards
Nice, this are simple
bash scripts!
57
perf-tools
Let's start the
live demo #3
19
20
58
# view flamegraph
59
60
Flamegraph
_ Visualization how resources are distributed
among code
Powered by @agentzh, http://agentzh.org/misc/slides/yapc-na-2013-flame-graphs.pdf
61
Let's start the
live demo #4
Flamegraph
62
Flamegraph
# perf record -g dd if=/dev/zero of=test.data count=1 bs=1M
# mv perf.data perf.data.dd
# perf script -i perf.data.dd | ./FlameGraph/stackcollapse-perf.pl > out.dd.folded
# ./FlameGraph/flamegraph.pl out.dd.folded > out.perf.dd.svg
# why is cpu util wrong?
63
http://www.brendangregg.com/blog/2017-05-09/cpu-utilization-is-wrong.html
OSDC 2017 - Werner Fischer - Linux performance profiling and monitoring
67
Other reasons why CPU util
can be misleading
_ Temperature trips stalling the CPU
_ Turboboost
_ Kernel varying the clock rate (Speed Step)
_ Problem with avg: 80% over 1 min → hides
burts of 100%
68
Questions?
Thanks for your attention!
_ wfischer AT thomas-krenn.com
_ @wefinet
TombolaWin a Low EnergyServer / SSD / Laptop bagDrawing tomorrow
afternoon
Ad

More Related Content

What's hot (20)

JomaSoft VDCF - Solaris Private Cloud
JomaSoft VDCF - Solaris Private CloudJomaSoft VDCF - Solaris Private Cloud
JomaSoft VDCF - Solaris Private Cloud
JomaSoft
 
Global counters (ssh log)
Global counters (ssh log)Global counters (ssh log)
Global counters (ssh log)
David Derrej
 
Proxy arp
Proxy arpProxy arp
Proxy arp
Marian Marinov
 
Linux Kernel Crashdump
Linux Kernel CrashdumpLinux Kernel Crashdump
Linux Kernel Crashdump
Marian Marinov
 
Creating "Secure" PHP applications, Part 2, Server Hardening
Creating "Secure" PHP applications, Part 2, Server HardeningCreating "Secure" PHP applications, Part 2, Server Hardening
Creating "Secure" PHP applications, Part 2, Server Hardening
archwisp
 
SOFA Tutorial
SOFA TutorialSOFA Tutorial
SOFA Tutorial
NTU CSIE, Taiwan
 
A deep dive about VIP,HAIP, and SCAN
A deep dive about VIP,HAIP, and SCAN A deep dive about VIP,HAIP, and SCAN
A deep dive about VIP,HAIP, and SCAN
Riyaj Shamsudeen
 
pstack, truss etc to understand deeper issues in Oracle database
pstack, truss etc to understand deeper issues in Oracle databasepstack, truss etc to understand deeper issues in Oracle database
pstack, truss etc to understand deeper issues in Oracle database
Riyaj Shamsudeen
 
Advanced Diagnostics 2
Advanced Diagnostics 2Advanced Diagnostics 2
Advanced Diagnostics 2
Aero Plane
 
LISA2019 Linux Systems Performance
LISA2019 Linux Systems PerformanceLISA2019 Linux Systems Performance
LISA2019 Linux Systems Performance
Brendan Gregg
 
Debugging 2013- Jesper Brouer
Debugging 2013- Jesper BrouerDebugging 2013- Jesper Brouer
Debugging 2013- Jesper Brouer
Mediehuset Ingeniøren Live
 
Catalystの設定シナリオ(メモ段階)
Catalystの設定シナリオ(メモ段階)Catalystの設定シナリオ(メモ段階)
Catalystの設定シナリオ(メモ段階)
78tch
 
HPE ProLiant DL380 Gen9 Server Data Sheet
HPE ProLiant DL380 Gen9 Server Data SheetHPE ProLiant DL380 Gen9 Server Data Sheet
HPE ProLiant DL380 Gen9 Server Data Sheet
美兰 曾
 
Rac introduction
Rac introductionRac introduction
Rac introduction
Riyaj Shamsudeen
 
Percona Live UK 2014 Part III
Percona Live UK 2014  Part IIIPercona Live UK 2014  Part III
Percona Live UK 2014 Part III
Alkin Tezuysal
 
HPE ProLiant DL360 Gen9 Server Data Sheet
HPE ProLiant DL360 Gen9 Server Data SheetHPE ProLiant DL360 Gen9 Server Data Sheet
HPE ProLiant DL360 Gen9 Server Data Sheet
美兰 曾
 
HPE ProLiant DL380 Gen10 Server Data Sheet
HPE ProLiant DL380 Gen10 Server Data SheetHPE ProLiant DL380 Gen10 Server Data Sheet
HPE ProLiant DL380 Gen10 Server Data Sheet
美兰 曾
 
Full PPT Stack
Full PPT StackFull PPT Stack
Full PPT Stack
Wendi Sapp
 
SCADA Strangelove: взлом во имя
SCADA Strangelove: взлом во имяSCADA Strangelove: взлом во имя
SCADA Strangelove: взлом во имя
Ekaterina Melnik
 
Performance analysis in a multitenant cloud environment Using Hadoop Cluster ...
Performance analysis in a multitenant cloud environment Using Hadoop Cluster ...Performance analysis in a multitenant cloud environment Using Hadoop Cluster ...
Performance analysis in a multitenant cloud environment Using Hadoop Cluster ...
Orgad Kimchi
 
JomaSoft VDCF - Solaris Private Cloud
JomaSoft VDCF - Solaris Private CloudJomaSoft VDCF - Solaris Private Cloud
JomaSoft VDCF - Solaris Private Cloud
JomaSoft
 
Global counters (ssh log)
Global counters (ssh log)Global counters (ssh log)
Global counters (ssh log)
David Derrej
 
Linux Kernel Crashdump
Linux Kernel CrashdumpLinux Kernel Crashdump
Linux Kernel Crashdump
Marian Marinov
 
Creating "Secure" PHP applications, Part 2, Server Hardening
Creating "Secure" PHP applications, Part 2, Server HardeningCreating "Secure" PHP applications, Part 2, Server Hardening
Creating "Secure" PHP applications, Part 2, Server Hardening
archwisp
 
A deep dive about VIP,HAIP, and SCAN
A deep dive about VIP,HAIP, and SCAN A deep dive about VIP,HAIP, and SCAN
A deep dive about VIP,HAIP, and SCAN
Riyaj Shamsudeen
 
pstack, truss etc to understand deeper issues in Oracle database
pstack, truss etc to understand deeper issues in Oracle databasepstack, truss etc to understand deeper issues in Oracle database
pstack, truss etc to understand deeper issues in Oracle database
Riyaj Shamsudeen
 
Advanced Diagnostics 2
Advanced Diagnostics 2Advanced Diagnostics 2
Advanced Diagnostics 2
Aero Plane
 
LISA2019 Linux Systems Performance
LISA2019 Linux Systems PerformanceLISA2019 Linux Systems Performance
LISA2019 Linux Systems Performance
Brendan Gregg
 
Catalystの設定シナリオ(メモ段階)
Catalystの設定シナリオ(メモ段階)Catalystの設定シナリオ(メモ段階)
Catalystの設定シナリオ(メモ段階)
78tch
 
HPE ProLiant DL380 Gen9 Server Data Sheet
HPE ProLiant DL380 Gen9 Server Data SheetHPE ProLiant DL380 Gen9 Server Data Sheet
HPE ProLiant DL380 Gen9 Server Data Sheet
美兰 曾
 
Percona Live UK 2014 Part III
Percona Live UK 2014  Part IIIPercona Live UK 2014  Part III
Percona Live UK 2014 Part III
Alkin Tezuysal
 
HPE ProLiant DL360 Gen9 Server Data Sheet
HPE ProLiant DL360 Gen9 Server Data SheetHPE ProLiant DL360 Gen9 Server Data Sheet
HPE ProLiant DL360 Gen9 Server Data Sheet
美兰 曾
 
HPE ProLiant DL380 Gen10 Server Data Sheet
HPE ProLiant DL380 Gen10 Server Data SheetHPE ProLiant DL380 Gen10 Server Data Sheet
HPE ProLiant DL380 Gen10 Server Data Sheet
美兰 曾
 
Full PPT Stack
Full PPT StackFull PPT Stack
Full PPT Stack
Wendi Sapp
 
SCADA Strangelove: взлом во имя
SCADA Strangelove: взлом во имяSCADA Strangelove: взлом во имя
SCADA Strangelove: взлом во имя
Ekaterina Melnik
 
Performance analysis in a multitenant cloud environment Using Hadoop Cluster ...
Performance analysis in a multitenant cloud environment Using Hadoop Cluster ...Performance analysis in a multitenant cloud environment Using Hadoop Cluster ...
Performance analysis in a multitenant cloud environment Using Hadoop Cluster ...
Orgad Kimchi
 

Similar to OSDC 2017 - Werner Fischer - Linux performance profiling and monitoring (20)

OSMC 2015 | Linux Performance Profiling and Monitoring by Werner Fischer
OSMC 2015 | Linux Performance Profiling and Monitoring by Werner FischerOSMC 2015 | Linux Performance Profiling and Monitoring by Werner Fischer
OSMC 2015 | Linux Performance Profiling and Monitoring by Werner Fischer
NETWAYS
 
OSDC 2015: Georg Schönberger | Linux Performance Profiling and Monitoring
OSDC 2015: Georg Schönberger | Linux Performance Profiling and MonitoringOSDC 2015: Georg Schönberger | Linux Performance Profiling and Monitoring
OSDC 2015: Georg Schönberger | Linux Performance Profiling and Monitoring
NETWAYS
 
YOW2020 Linux Systems Performance
YOW2020 Linux Systems PerformanceYOW2020 Linux Systems Performance
YOW2020 Linux Systems Performance
Brendan Gregg
 
Linux Systems Performance 2016
Linux Systems Performance 2016Linux Systems Performance 2016
Linux Systems Performance 2016
Brendan Gregg
 
Как понять, что происходит на сервере? / Александр Крижановский (NatSys Lab.,...
Как понять, что происходит на сервере? / Александр Крижановский (NatSys Lab.,...Как понять, что происходит на сервере? / Александр Крижановский (NatSys Lab.,...
Как понять, что происходит на сервере? / Александр Крижановский (NatSys Lab.,...
Ontico
 
HKG18-TR14 - Postmortem Debugging with Coresight
HKG18-TR14 - Postmortem Debugging with CoresightHKG18-TR14 - Postmortem Debugging with Coresight
HKG18-TR14 - Postmortem Debugging with Coresight
Linaro
 
Debugging Ruby
Debugging RubyDebugging Ruby
Debugging Ruby
Aman Gupta
 
Reverse engineering Swisscom's Centro Grande Modem
Reverse engineering Swisscom's Centro Grande ModemReverse engineering Swisscom's Centro Grande Modem
Reverse engineering Swisscom's Centro Grande Modem
Cyber Security Alliance
 
C&C Botnet Factory
C&C Botnet FactoryC&C Botnet Factory
C&C Botnet Factory
Nullbyte Security Conference
 
44CON London 2015 - Jtagsploitation: 5 wires, 5 ways to root
44CON London 2015 - Jtagsploitation: 5 wires, 5 ways to root44CON London 2015 - Jtagsploitation: 5 wires, 5 ways to root
44CON London 2015 - Jtagsploitation: 5 wires, 5 ways to root
44CON
 
Crash_Report_Mechanism_In_Tizen
Crash_Report_Mechanism_In_TizenCrash_Report_Mechanism_In_Tizen
Crash_Report_Mechanism_In_Tizen
Lex Yu
 
AMDGPU ROCm Tensorflow 1.8 install memo (not support Ubuntu 1804)
AMDGPU ROCm Tensorflow 1.8 install memo (not support Ubuntu 1804)AMDGPU ROCm Tensorflow 1.8 install memo (not support Ubuntu 1804)
AMDGPU ROCm Tensorflow 1.8 install memo (not support Ubuntu 1804)
Naoto MATSUMOTO
 
A close encounter_with_real_world_and_odd_perf_issues
A close encounter_with_real_world_and_odd_perf_issuesA close encounter_with_real_world_and_odd_perf_issues
A close encounter_with_real_world_and_odd_perf_issues
Riyaj Shamsudeen
 
Debugging linux issues with eBPF
Debugging linux issues with eBPFDebugging linux issues with eBPF
Debugging linux issues with eBPF
Ivan Babrou
 
Oracle Basics and Architecture
Oracle Basics and ArchitectureOracle Basics and Architecture
Oracle Basics and Architecture
Sidney Chen
 
Linux 系統管理與安全:進階系統管理系統防駭與資訊安全
Linux 系統管理與安全:進階系統管理系統防駭與資訊安全Linux 系統管理與安全:進階系統管理系統防駭與資訊安全
Linux 系統管理與安全:進階系統管理系統防駭與資訊安全
維泰 蔡
 
200.1,2-Capacity Planning
200.1,2-Capacity Planning200.1,2-Capacity Planning
200.1,2-Capacity Planning
behrad eslamifar
 
hacking-embedded-devices.pptx
hacking-embedded-devices.pptxhacking-embedded-devices.pptx
hacking-embedded-devices.pptx
ssuserfcf43f
 
Troubleshooting Complex Oracle Performance Problems with Tanel Poder
Troubleshooting Complex Oracle Performance Problems with Tanel PoderTroubleshooting Complex Oracle Performance Problems with Tanel Poder
Troubleshooting Complex Oracle Performance Problems with Tanel Poder
Tanel Poder
 
OSSNA 2017 Performance Analysis Superpowers with Linux BPF
OSSNA 2017 Performance Analysis Superpowers with Linux BPFOSSNA 2017 Performance Analysis Superpowers with Linux BPF
OSSNA 2017 Performance Analysis Superpowers with Linux BPF
Brendan Gregg
 
OSMC 2015 | Linux Performance Profiling and Monitoring by Werner Fischer
OSMC 2015 | Linux Performance Profiling and Monitoring by Werner FischerOSMC 2015 | Linux Performance Profiling and Monitoring by Werner Fischer
OSMC 2015 | Linux Performance Profiling and Monitoring by Werner Fischer
NETWAYS
 
OSDC 2015: Georg Schönberger | Linux Performance Profiling and Monitoring
OSDC 2015: Georg Schönberger | Linux Performance Profiling and MonitoringOSDC 2015: Georg Schönberger | Linux Performance Profiling and Monitoring
OSDC 2015: Georg Schönberger | Linux Performance Profiling and Monitoring
NETWAYS
 
YOW2020 Linux Systems Performance
YOW2020 Linux Systems PerformanceYOW2020 Linux Systems Performance
YOW2020 Linux Systems Performance
Brendan Gregg
 
Linux Systems Performance 2016
Linux Systems Performance 2016Linux Systems Performance 2016
Linux Systems Performance 2016
Brendan Gregg
 
Как понять, что происходит на сервере? / Александр Крижановский (NatSys Lab.,...
Как понять, что происходит на сервере? / Александр Крижановский (NatSys Lab.,...Как понять, что происходит на сервере? / Александр Крижановский (NatSys Lab.,...
Как понять, что происходит на сервере? / Александр Крижановский (NatSys Lab.,...
Ontico
 
HKG18-TR14 - Postmortem Debugging with Coresight
HKG18-TR14 - Postmortem Debugging with CoresightHKG18-TR14 - Postmortem Debugging with Coresight
HKG18-TR14 - Postmortem Debugging with Coresight
Linaro
 
Debugging Ruby
Debugging RubyDebugging Ruby
Debugging Ruby
Aman Gupta
 
Reverse engineering Swisscom's Centro Grande Modem
Reverse engineering Swisscom's Centro Grande ModemReverse engineering Swisscom's Centro Grande Modem
Reverse engineering Swisscom's Centro Grande Modem
Cyber Security Alliance
 
44CON London 2015 - Jtagsploitation: 5 wires, 5 ways to root
44CON London 2015 - Jtagsploitation: 5 wires, 5 ways to root44CON London 2015 - Jtagsploitation: 5 wires, 5 ways to root
44CON London 2015 - Jtagsploitation: 5 wires, 5 ways to root
44CON
 
Crash_Report_Mechanism_In_Tizen
Crash_Report_Mechanism_In_TizenCrash_Report_Mechanism_In_Tizen
Crash_Report_Mechanism_In_Tizen
Lex Yu
 
AMDGPU ROCm Tensorflow 1.8 install memo (not support Ubuntu 1804)
AMDGPU ROCm Tensorflow 1.8 install memo (not support Ubuntu 1804)AMDGPU ROCm Tensorflow 1.8 install memo (not support Ubuntu 1804)
AMDGPU ROCm Tensorflow 1.8 install memo (not support Ubuntu 1804)
Naoto MATSUMOTO
 
A close encounter_with_real_world_and_odd_perf_issues
A close encounter_with_real_world_and_odd_perf_issuesA close encounter_with_real_world_and_odd_perf_issues
A close encounter_with_real_world_and_odd_perf_issues
Riyaj Shamsudeen
 
Debugging linux issues with eBPF
Debugging linux issues with eBPFDebugging linux issues with eBPF
Debugging linux issues with eBPF
Ivan Babrou
 
Oracle Basics and Architecture
Oracle Basics and ArchitectureOracle Basics and Architecture
Oracle Basics and Architecture
Sidney Chen
 
Linux 系統管理與安全:進階系統管理系統防駭與資訊安全
Linux 系統管理與安全:進階系統管理系統防駭與資訊安全Linux 系統管理與安全:進階系統管理系統防駭與資訊安全
Linux 系統管理與安全:進階系統管理系統防駭與資訊安全
維泰 蔡
 
hacking-embedded-devices.pptx
hacking-embedded-devices.pptxhacking-embedded-devices.pptx
hacking-embedded-devices.pptx
ssuserfcf43f
 
Troubleshooting Complex Oracle Performance Problems with Tanel Poder
Troubleshooting Complex Oracle Performance Problems with Tanel PoderTroubleshooting Complex Oracle Performance Problems with Tanel Poder
Troubleshooting Complex Oracle Performance Problems with Tanel Poder
Tanel Poder
 
OSSNA 2017 Performance Analysis Superpowers with Linux BPF
OSSNA 2017 Performance Analysis Superpowers with Linux BPFOSSNA 2017 Performance Analysis Superpowers with Linux BPF
OSSNA 2017 Performance Analysis Superpowers with Linux BPF
Brendan Gregg
 
Ad

Recently uploaded (20)

Automation Techniques in RPA - UiPath Certificate
Automation Techniques in RPA - UiPath CertificateAutomation Techniques in RPA - UiPath Certificate
Automation Techniques in RPA - UiPath Certificate
VICTOR MAESTRE RAMIREZ
 
The Significance of Hardware in Information Systems.pdf
The Significance of Hardware in Information Systems.pdfThe Significance of Hardware in Information Systems.pdf
The Significance of Hardware in Information Systems.pdf
drewplanas10
 
Adobe Marketo Engage Champion Deep Dive - SFDC CRM Synch V2 & Usage Dashboards
Adobe Marketo Engage Champion Deep Dive - SFDC CRM Synch V2 & Usage DashboardsAdobe Marketo Engage Champion Deep Dive - SFDC CRM Synch V2 & Usage Dashboards
Adobe Marketo Engage Champion Deep Dive - SFDC CRM Synch V2 & Usage Dashboards
BradBedford3
 
FL Studio Producer Edition Crack 2025 Full Version
FL Studio Producer Edition Crack 2025 Full VersionFL Studio Producer Edition Crack 2025 Full Version
FL Studio Producer Edition Crack 2025 Full Version
tahirabibi60507
 
WinRAR Crack for Windows (100% Working 2025)
WinRAR Crack for Windows (100% Working 2025)WinRAR Crack for Windows (100% Working 2025)
WinRAR Crack for Windows (100% Working 2025)
sh607827
 
Revolutionizing Residential Wi-Fi PPT.pptx
Revolutionizing Residential Wi-Fi PPT.pptxRevolutionizing Residential Wi-Fi PPT.pptx
Revolutionizing Residential Wi-Fi PPT.pptx
nidhisingh691197
 
Exploring Code Comprehension in Scientific Programming: Preliminary Insight...
Exploring Code Comprehension  in Scientific Programming:  Preliminary Insight...Exploring Code Comprehension  in Scientific Programming:  Preliminary Insight...
Exploring Code Comprehension in Scientific Programming: Preliminary Insight...
University of Hawai‘i at Mānoa
 
How can one start with crypto wallet development.pptx
How can one start with crypto wallet development.pptxHow can one start with crypto wallet development.pptx
How can one start with crypto wallet development.pptx
laravinson24
 
EASEUS Partition Master Crack + License Code
EASEUS Partition Master Crack + License CodeEASEUS Partition Master Crack + License Code
EASEUS Partition Master Crack + License Code
aneelaramzan63
 
Microsoft AI Nonprofit Use Cases and Live Demo_2025.04.30.pdf
Microsoft AI Nonprofit Use Cases and Live Demo_2025.04.30.pdfMicrosoft AI Nonprofit Use Cases and Live Demo_2025.04.30.pdf
Microsoft AI Nonprofit Use Cases and Live Demo_2025.04.30.pdf
TechSoup
 
Mastering Fluent Bit: Ultimate Guide to Integrating Telemetry Pipelines with ...
Mastering Fluent Bit: Ultimate Guide to Integrating Telemetry Pipelines with ...Mastering Fluent Bit: Ultimate Guide to Integrating Telemetry Pipelines with ...
Mastering Fluent Bit: Ultimate Guide to Integrating Telemetry Pipelines with ...
Eric D. Schabell
 
Why Orangescrum Is a Game Changer for Construction Companies in 2025
Why Orangescrum Is a Game Changer for Construction Companies in 2025Why Orangescrum Is a Game Changer for Construction Companies in 2025
Why Orangescrum Is a Game Changer for Construction Companies in 2025
Orangescrum
 
Scaling GraphRAG: Efficient Knowledge Retrieval for Enterprise AI
Scaling GraphRAG:  Efficient Knowledge Retrieval for Enterprise AIScaling GraphRAG:  Efficient Knowledge Retrieval for Enterprise AI
Scaling GraphRAG: Efficient Knowledge Retrieval for Enterprise AI
danshalev
 
Adobe Lightroom Classic Crack FREE Latest link 2025
Adobe Lightroom Classic Crack FREE Latest link 2025Adobe Lightroom Classic Crack FREE Latest link 2025
Adobe Lightroom Classic Crack FREE Latest link 2025
kashifyounis067
 
Download Wondershare Filmora Crack [2025] With Latest
Download Wondershare Filmora Crack [2025] With LatestDownload Wondershare Filmora Crack [2025] With Latest
Download Wondershare Filmora Crack [2025] With Latest
tahirabibi60507
 
How Valletta helped healthcare SaaS to transform QA and compliance to grow wi...
How Valletta helped healthcare SaaS to transform QA and compliance to grow wi...How Valletta helped healthcare SaaS to transform QA and compliance to grow wi...
How Valletta helped healthcare SaaS to transform QA and compliance to grow wi...
Egor Kaleynik
 
Douwan Crack 2025 new verson+ License code
Douwan Crack 2025 new verson+ License codeDouwan Crack 2025 new verson+ License code
Douwan Crack 2025 new verson+ License code
aneelaramzan63
 
Download YouTube By Click 2025 Free Full Activated
Download YouTube By Click 2025 Free Full ActivatedDownload YouTube By Click 2025 Free Full Activated
Download YouTube By Click 2025 Free Full Activated
saniamalik72555
 
Designing AI-Powered APIs on Azure: Best Practices& Considerations
Designing AI-Powered APIs on Azure: Best Practices& ConsiderationsDesigning AI-Powered APIs on Azure: Best Practices& Considerations
Designing AI-Powered APIs on Azure: Best Practices& Considerations
Dinusha Kumarasiri
 
Explaining GitHub Actions Failures with Large Language Models Challenges, In...
Explaining GitHub Actions Failures with Large Language Models Challenges, In...Explaining GitHub Actions Failures with Large Language Models Challenges, In...
Explaining GitHub Actions Failures with Large Language Models Challenges, In...
ssuserb14185
 
Automation Techniques in RPA - UiPath Certificate
Automation Techniques in RPA - UiPath CertificateAutomation Techniques in RPA - UiPath Certificate
Automation Techniques in RPA - UiPath Certificate
VICTOR MAESTRE RAMIREZ
 
The Significance of Hardware in Information Systems.pdf
The Significance of Hardware in Information Systems.pdfThe Significance of Hardware in Information Systems.pdf
The Significance of Hardware in Information Systems.pdf
drewplanas10
 
Adobe Marketo Engage Champion Deep Dive - SFDC CRM Synch V2 & Usage Dashboards
Adobe Marketo Engage Champion Deep Dive - SFDC CRM Synch V2 & Usage DashboardsAdobe Marketo Engage Champion Deep Dive - SFDC CRM Synch V2 & Usage Dashboards
Adobe Marketo Engage Champion Deep Dive - SFDC CRM Synch V2 & Usage Dashboards
BradBedford3
 
FL Studio Producer Edition Crack 2025 Full Version
FL Studio Producer Edition Crack 2025 Full VersionFL Studio Producer Edition Crack 2025 Full Version
FL Studio Producer Edition Crack 2025 Full Version
tahirabibi60507
 
WinRAR Crack for Windows (100% Working 2025)
WinRAR Crack for Windows (100% Working 2025)WinRAR Crack for Windows (100% Working 2025)
WinRAR Crack for Windows (100% Working 2025)
sh607827
 
Revolutionizing Residential Wi-Fi PPT.pptx
Revolutionizing Residential Wi-Fi PPT.pptxRevolutionizing Residential Wi-Fi PPT.pptx
Revolutionizing Residential Wi-Fi PPT.pptx
nidhisingh691197
 
Exploring Code Comprehension in Scientific Programming: Preliminary Insight...
Exploring Code Comprehension  in Scientific Programming:  Preliminary Insight...Exploring Code Comprehension  in Scientific Programming:  Preliminary Insight...
Exploring Code Comprehension in Scientific Programming: Preliminary Insight...
University of Hawai‘i at Mānoa
 
How can one start with crypto wallet development.pptx
How can one start with crypto wallet development.pptxHow can one start with crypto wallet development.pptx
How can one start with crypto wallet development.pptx
laravinson24
 
EASEUS Partition Master Crack + License Code
EASEUS Partition Master Crack + License CodeEASEUS Partition Master Crack + License Code
EASEUS Partition Master Crack + License Code
aneelaramzan63
 
Microsoft AI Nonprofit Use Cases and Live Demo_2025.04.30.pdf
Microsoft AI Nonprofit Use Cases and Live Demo_2025.04.30.pdfMicrosoft AI Nonprofit Use Cases and Live Demo_2025.04.30.pdf
Microsoft AI Nonprofit Use Cases and Live Demo_2025.04.30.pdf
TechSoup
 
Mastering Fluent Bit: Ultimate Guide to Integrating Telemetry Pipelines with ...
Mastering Fluent Bit: Ultimate Guide to Integrating Telemetry Pipelines with ...Mastering Fluent Bit: Ultimate Guide to Integrating Telemetry Pipelines with ...
Mastering Fluent Bit: Ultimate Guide to Integrating Telemetry Pipelines with ...
Eric D. Schabell
 
Why Orangescrum Is a Game Changer for Construction Companies in 2025
Why Orangescrum Is a Game Changer for Construction Companies in 2025Why Orangescrum Is a Game Changer for Construction Companies in 2025
Why Orangescrum Is a Game Changer for Construction Companies in 2025
Orangescrum
 
Scaling GraphRAG: Efficient Knowledge Retrieval for Enterprise AI
Scaling GraphRAG:  Efficient Knowledge Retrieval for Enterprise AIScaling GraphRAG:  Efficient Knowledge Retrieval for Enterprise AI
Scaling GraphRAG: Efficient Knowledge Retrieval for Enterprise AI
danshalev
 
Adobe Lightroom Classic Crack FREE Latest link 2025
Adobe Lightroom Classic Crack FREE Latest link 2025Adobe Lightroom Classic Crack FREE Latest link 2025
Adobe Lightroom Classic Crack FREE Latest link 2025
kashifyounis067
 
Download Wondershare Filmora Crack [2025] With Latest
Download Wondershare Filmora Crack [2025] With LatestDownload Wondershare Filmora Crack [2025] With Latest
Download Wondershare Filmora Crack [2025] With Latest
tahirabibi60507
 
How Valletta helped healthcare SaaS to transform QA and compliance to grow wi...
How Valletta helped healthcare SaaS to transform QA and compliance to grow wi...How Valletta helped healthcare SaaS to transform QA and compliance to grow wi...
How Valletta helped healthcare SaaS to transform QA and compliance to grow wi...
Egor Kaleynik
 
Douwan Crack 2025 new verson+ License code
Douwan Crack 2025 new verson+ License codeDouwan Crack 2025 new verson+ License code
Douwan Crack 2025 new verson+ License code
aneelaramzan63
 
Download YouTube By Click 2025 Free Full Activated
Download YouTube By Click 2025 Free Full ActivatedDownload YouTube By Click 2025 Free Full Activated
Download YouTube By Click 2025 Free Full Activated
saniamalik72555
 
Designing AI-Powered APIs on Azure: Best Practices& Considerations
Designing AI-Powered APIs on Azure: Best Practices& ConsiderationsDesigning AI-Powered APIs on Azure: Best Practices& Considerations
Designing AI-Powered APIs on Azure: Best Practices& Considerations
Dinusha Kumarasiri
 
Explaining GitHub Actions Failures with Large Language Models Challenges, In...
Explaining GitHub Actions Failures with Large Language Models Challenges, In...Explaining GitHub Actions Failures with Large Language Models Challenges, In...
Explaining GitHub Actions Failures with Large Language Models Challenges, In...
ssuserb14185
 
Ad

OSDC 2017 - Werner Fischer - Linux performance profiling and monitoring

  • 1. Linux Performance Profiling and Monitoring @wefinet – Werner Fischer, Thomas-Krenn.AG Image http://de.freeimages.com/photo/jaguar-xjr-1537119
  • 2. 2 Thomas-Krenn.AG _ Server manufacturer from Bavaria _ Well visited knowledge base, Thomas-Krenn Wiki (parts in English)
  • 3. 3 Agenda _ Collect Statistics _ Sysstat Package _ mpstat, vmstat, pidstat, iostat _ dstat, nicstat _ sar, atop _ Percona Cacti Template _ Monitoring Plugins _ Watch online _ top _ iotop _ iftop _ Tracing _ perf_events _ ftrace _ perf-tools _ Flame graphs _ ADD-ON reg. CPU util _ what means CPU util.? _ tiptop
  • 4. # find / -type f -name statistics 4
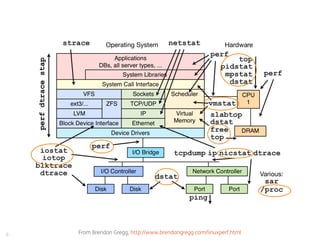
  • 5. From Brendan Gregg, http://www.brendangregg.com/linuxperf.html5
  • 6. From Brendan Gregg, http://www.brendangregg.com/linuxperf.html6
  • 8. 8 mpstat _ Reports CPU related statistics (using /proc/stat) _ Without Interval/Count → since system startup _ CPU usage per Core (incl. Hyperthreading) _ Check how well usage is balanced # mpstat -P ALL Linux 3.13.0-48-generic (X220) 2015-04-14 _x86_64_ (4 CPU) 14:28:21 CPU %usr %nice %sys %iowait %irq %soft %steal %guest %gnice %idle 14:28:21 all 11,59 0,09 3,62 0,03 0,00 0,04 0,00 0,00 0,00 84,64 14:28:21 0 6,45 0,05 1,87 0,04 0,00 0,07 0,00 0,00 0,00 91,53 14:28:21 1 16,44 0,11 5,56 0,01 0,00 0,00 0,00 0,00 0,00 77,89 14:28:21 2 17,15 0,14 5,55 0,03 0,00 0,05 0,00 0,00 0,00 77,08 14:28:21 3 16,27 0,11 4,89 0,01 0,00 0,02 0,00 0,00 0,00 78,70 # lscpu | grep -E 'core|socket' Thread(s) per core: 2 Core(s) per socket: 2
  • 9. 9 mpstat # mpstat -P ALL 1 2 Linux 3.13.0-48-generic (X220) 2015-04-14 _x86_64_ (4 CPU) 15:24:44 CPU %usr %nice %sys %iowait %irq %soft %steal %guest %gnice %idle 15:24:45 all 5,21 0,00 7,12 17,81 0,00 0,27 0,00 0,00 0,00 69,59 15:24:45 0 1,43 0,00 1,43 0,00 0,00 2,86 0,00 0,00 0,00 94,29 15:24:45 1 11,88 0,00 23,76 64,36 0,00 0,00 0,00 0,00 0,00 0,00 15:24:45 2 4,12 0,00 1,03 0,00 0,00 0,00 0,00 0,00 0,00 94,85 15:24:45 3 3,03 0,00 1,01 0,00 0,00 0,00 0,00 0,00 0,00 95,96 15:24:45 CPU %usr %nice %sys %iowait %irq %soft %steal %guest %gnice %idle 15:24:46 all 5,74 0,00 7,10 17,76 0,00 0,55 0,00 0,00 0,00 68,85 15:24:46 0 2,99 0,00 1,49 0,00 0,00 2,99 0,00 0,00 0,00 92,54 15:24:46 1 11,88 0,00 23,76 64,36 0,00 0,00 0,00 0,00 0,00 0,00 15:24:46 2 6,00 0,00 1,00 0,00 0,00 0,00 0,00 0,00 0,00 93,00 15:24:46 3 1,01 0,00 1,01 0,00 0,00 0,00 0,00 0,00 0,00 97,98 Core 1 is not idle and also deals with %iowait
  • 10. 10 vmstat _ High Level Statistics about _ Virtual memory _ Swap/Paging _ I/O statistics _ System interrupts and context switches _ CPU statistics # vmstat 1 procs -----------memory---------- ---swap-- -----io---- -system-- ------cpu----- r b swpd free buff cache si so bi bo in cs us sy id wa st 3 0 172 371856 137088 3125664 0 0 0 153060 7618 7059 17 9 56 17 0 3 0 172 416596 137096 3125704 0 0 0 163420 8689 7419 11 10 61 17 0 0 0 172 451716 137096 3089916 0 0 0 0 396 1848 3 1 96 0 0 0 0 172 413916 137108 3118796 0 0 0 52 502 2218 9 2 90 0 0 2 0 172 399756 137108 3118860 0 0 284884 0 14830 10941 10 13 66 12 0 1 1 172 364948 137108 3118988 0 0 310792 0 16204 12738 20 13 53 14 0
  • 11. 11 vmstat _ Memory statistics _ buff Raw disk blocks like filesystem metadata (superblocks, inodes) _ cache Memory used for data -> pages with actual contents $ vmstat 1 procs -----------memory---------- ---swap-- -----io---- -system-- ------cpu----- r b swpd free buff cache si so bi bo in cs us sy id wa st 0 0 172 607760 182172 3313684 0 0 159 496 154 222 18 6 76 0 0 0 0 172 607628 182172 3313684 0 0 0 52 387 2008 4 2 95 0 0 0 0 172 607348 182172 3313684 0 0 0 0 397 2034 4 1 95 0 0 0 0 172 606448 182172 3313684 0 0 0 0 378 1896 4 2 94 0 0 $ free total used free shared buffers cached Mem: 8056664 7450316 606348 491820 182172 3313684 -/+ buffers/cache: 3954460 4102204 Swap: 1048572 172 1048400
  • 12. 12 vmstat _ Process related fields _ r The number of runnable processes (running or waiting for run time) _ If high → indicator for CPU saturation _ b The number of processes in uninterruptible sleep _ Mostly waiting for I/O # vmstat 1 procs -----------memory---------- ---swap-- -----io---- -system-- ------cpu----- r b swpd free buff cache si so bi bo in cs us sy id wa st [...] 0 1 172 404768 137088 3125664 0 0 0 167524 9029 6955 6 6 70 18 0 0 1 172 399956 137088 3125664 0 0 0 138340 8133 6165 7 7 68 19 0 $ ps -eo ppid,pid,user,stat,pcpu,comm,wchan:32 | grep ext4 [...] 7159 7161 root Ds 3.2 fio ext4_file_write 7159 7162 root Ds 3.2 fio ext4_file_write 7159 7164 root Ds 3.2 fio ext4_file_write Kernel function process is sleeping on Processes doing I/O can be in waiting state
  • 13. 13 vmstat plots, e.g. gnuplot https://clusterbuffer.wordpress.com/admin-tools/vmstat-plotter/ Drawing interrupts and context switches
  • 14. But we are not satisfied with summaries and overviews... 14
  • 15. What is PID 9059 doing? 15
  • 16. 16 pidstat _ Report statistics for tasks being managed by kernel _ CPU bound → identify peak activity $ top -b -n 1 -d 2 -o %CPU | head [...] PID USER PR NI VIRT RES SHR S %CPU %MEM TIME+ COMMAND 9059 wfischer 20 0 47532 21132 2444 R 96,9 0,3 0:02.14 python 1 root 20 0 33880 3256 1500 S 0,0 0,0 0:02.35 init $ pidstat -p 9059 -u 1 -l Linux 3.13.0-48-generic (X220) 2015-04-15 _x86_64_ (4 CPU) 10:11:04 UID PID %usr %system %guest %CPU CPU Command 10:11:05 1000 9059 100,00 0,00 0,00 100,00 0 python ijk-matrix.py -i matrix.in 10:11:06 1000 9059 100,00 0,00 0,00 100,00 0 python ijk-matrix.py -i matrix.in 10:11:07 1000 9059 100,00 0,00 0,00 100,00 0 python ijk-matrix.py -i matrix.in Even check command line arguments (“-l”) !
  • 17. 17 pidstat _ I/O bound → device report # mpstat -P ALL 1 10:25:31 CPU %usr %nice %sys %iowait %irq %soft %steal %guest %gnice %idle 10:25:32 all 14,88 0,00 9,40 13,84 0,00 1,04 0,00 0,00 0,00 60,84 10:25:32 0 22,45 0,00 1,02 0,00 0,00 0,00 0,00 0,00 0,00 76,53 10:25:32 1 13,73 0,00 34,31 51,96 0,00 0,00 0,00 0,00 0,00 0,00 10:25:32 2 17,86 0,00 0,00 0,00 0,00 3,57 0,00 0,00 0,00 78,57 10:25:32 3 6,12 0,00 0,00 0,00 0,00 0,00 0,00 0,00 0,00 93,88 # pidstat -d 1 Linux 3.13.0-48-generic (X220) 2015-04-15 _x86_64_ (4 CPU) 10:26:35 UID PID kB_rd/s kB_wr/s kB_ccwr/s Command 10:26:36 0 9208 0,00 2303,85 0,00 fio 10:26:36 0 9209 0,00 2996,15 0,00 fio 10:26:36 0 9210 0,00 2023,08 0,00 fio 10:26:36 0 9211 0,00 1284,62 0,00 fio Which process is causing %iowait? Device report reveals command and I/O
  • 18. 18 pidstat _ How much memory is PID 8461 using? _ Major page faults require loading memory page from disk → more RAM needed! # pidstat -r -p 8461 1 3 Linux 3.13.0-49-generic (X220) 2015-04-21 _x86_64_ (4 CPU) 10:09:06 UID PID minflt/s majflt/s VSZ RSS %MEM Command 10:09:07 1000 8461 8,00 0,00 2018384 786688 9,76 firefox 10:09:08 1000 8461 11,00 0,00 2018384 786688 9,76 firefox 10:09:09 1000 8461 23,00 0,00 2018448 786892 9,77 firefox Average: 1000 8461 14,00 0,00 2018405 786756 9,77 firefox Current used share of physical memory Minor and major page faults
  • 19. 19 iostat _ I/O subsystem statistics _ CPU (-c) or device utilization (-d) report _ Without argument → summary since boot _ Skip that with -y option # iostat Linux 3.13.0-48-generic (X220) 2015-04-15 _x86_64_ (4 CPU) avg-cpu: %user %nice %system %iowait %steal %idle 16,16 0,09 4,79 0,46 0,00 78,50 Device: tps kB_read/s kB_wrtn/s kB_read kB_wrtn sda 83,80 41,64 531,43 22375057 285581196
  • 21. 21 iostat _ CPU util report → %iowait _ Not really reliable → %iowait is some kind of %idle time # taskset 1 fio –rw=randwrite [...] & # iostat -y -c 1 3 […] avg-cpu: %user %nice %system %iowait %steal %idle 17,32 0,00 6,56 13,65 0,00 62,47 # taskset 1 sh -c "while true; do true; done" & # iostat -y -c 1 3 avg-cpu: %user %nice %system %iowait %steal %idle 35,59 0,00 7,02 0,00 0,00 57,39 http://www.percona.com/blog/2014/06/03/trust-vmstat-iowait-numbers/
  • 22. 22 iostat _ Extended device util report (“-x”) → %util _ man iostat → … for devices serving request serially, for parallel processing (RAID arrays and SSDs), this number does not reflect their performance limits. _ In theory _ 94,4% util → 23032 IOPS _ 99,6% util → 24300 IOPS
  • 23. 23 iostat # iostat -y -d -x 1 3 Linux 3.13.0-48-generic (X220) 2015-04-15 _x86_64_ (4 CPU) Device: rrqm/s wrqm/s r/s w/s rkB/s wkB/s avgrq-sz avgqu-sz await r_await w_await svctm %util sda 0,00 2,00 0,00 23032,00 0,00 92136,00 8,00 2,90 0,13 0,00 0,13 0,04 94,40 # iostat -y -d -x 1 3 Linux 3.13.0-48-generic (X220) 2015-04-15 _x86_64_ (4 CPU) Device: rrqm/s wrqm/s r/s w/s rkB/s wkB/s avgrq-sz avgqu-sz await r_await w_await svctm %util sda 0,00 2917,00 0,00 43175,00 0,00 184500,00 8,55 135,75 3,15 0,00 3,15 0,02 99,60 Only 5% util increase, but IOPS nearly doubled!
  • 25. 25 iostat -cx / -dx _ avgqu-sz Avg. queue length of requests issued _ (delta[time_in_queue] / interval) / 1000.0 _ time_in_queue Requets waiting for device, effected by in_flight _ await Avg. time requests being served _ delta[read_ticks + write_ticks] / delta[read_IOs + write_Ios] _ ticks also effected by in_flight _ Therefore serving more requests while await is not increasing, is a good performance indicator - Monitoring IO Performance using iostat and pt-diskstats - Block layer statistics
  • 27. 27 dstat _ Combines several classical tools _ Replacement for vmstat, iostat, ifstat _ Prints metrics and uses colors _ Has a plugin concept
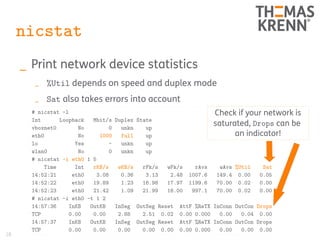
  • 28. 28 nicstat _ Print network device statistics _ %Util depends on speed and duplex mode _ Sat also takes errors into account # nicstat -l Int Loopback Mbit/s Duplex State vboxnet0 No 0 unkn up eth0 No 1000 full up lo Yes - unkn up wlan0 No 0 unkn up # nicstat -i eth0 1 5 Time Int rKB/s wKB/s rPk/s wPk/s rAvs wAvs %Util Sat 14:52:21 eth0 3.08 0.36 3.13 2.48 1007.6 149.4 0.00 0.05 14:52:22 eth0 19.89 1.23 16.98 17.97 1199.6 70.00 0.02 0.00 14:52:23 eth0 21.42 1.09 21.99 16.00 997.1 70.00 0.02 0.00 # nicstat -i eth0 -t 1 2 14:57:36 InKB OutKB InSeg OutSeg Reset AttF %ReTX InConn OutCon Drops TCP 0.00 0.00 2.88 2.51 0.02 0.00 0.000 0.00 0.04 0.00 14:57:37 InKB OutKB InSeg OutSeg Reset AttF %ReTX InConn OutCon Drops TCP 0.00 0.00 0.00 0.00 0.00 0.00 0.000 0.00 0.00 0.00 Check if your network is saturated, Drops can be an indicator!
  • 29. Do you have a history of your system's performance data? yes no 29
  • 30. 30 sar (part of sysstat) _ It's easy with system activity reporter _ sar, sadc, sa1 and sa2, sadf http://www.brendangregg.com/Perf/linux_observability_sar.png
  • 31. 31 ksar _ LC_ALL=POSIX sar -A -f sa10 > ksar.out.txt Mitigates character encoding and number format problems
  • 32. 32 Percona Cacti Template _ Percona Linux Monitoring Template for Cacti _ generate many graphs easily https://www.percona.com/doc/percona-monitoring- plugins/1.1/cacti/linux-templates.html
  • 33. 33 Monitoring Plugins _ Example: _ check_cpu.sh _ There is still work to be done … _ e.g. plugins based on sar
  • 34. 34 Agenda _ Collect Statistics _ Sysstat Package _ mpstat, vmstat, pidstat, iostat _ dstat, nicstat _ sar, atop _ Percona Cacti Template _ Monitoring Plugins _ Watch online _ top _ iotop _ iftop _ Tracing _ perf_events _ ftrace _ perf-tools _ Flame graphs
  • 35. 35 top _ System summary at beginning _ Per process metrics afterwards _ Default sorted by CPU usage $ top -b -n 1| head -15 top - 15:33:50 up 3 days, 19:02, 3 users, load average: 0.13, 0.51, 0.59 Tasks: 668 total, 1 running, 667 sleeping, 0 stopped, 0 zombie Cpu(s): 1.5%us, 0.3%sy, 0.1%ni, 98.1%id, 0.0%wa, 0.0%hi, 0.0%si, 0.0%st Mem: 132009356k total, 23457172k used, 108552184k free, 1600120k buffers Swap: 3904444k total, 0k used, 3904444k free, 12682188k cached PID USER PR NI VIRT RES SHR S %CPU %MEM TIME+ COMMAND 29276 root 20 0 6928 3488 668 S 19 0.0 22:55.72 ossec-syscheckd 1193 gschoenb 20 0 17728 1740 936 R 4 0.0 0:00.02 top 11257 root 20 0 22640 2636 1840 S 4 0.0 70:38.88 openvpn 19907 www-data 20 0 197m 61m 52m S 4 0.0 0:06.18 apache2 775 root 20 0 0 0 0 S 2 0.0 8:03.13 md3_raid10 3712 root 39 19 0 0 0 S 2 0.0 22:45.85 kipmi0 12807 root -3 0 0 0 0 S 2 0.0 6:20.30 drbd2_asender 18653 root 20 0 0 0 0 S 2 0.0 12:40.19 drbd1_receiver 1, 5 and 15 min load average
  • 36. 36 top _ Memory usage _ VIRT The total size of virtual memory for the process _ Also including e.g. shared libraries, not already mapped heap or swap _ how much memory the program is able to access at the moment _ RES How many blocks are really allocated and mapped to address space → resident _ how much actual physical memory a process is consuming _ SHR _ how much of the VIRT size is actually sharable - https://www.linux.com/learn/tutorials/42048-uncover-the-meaning-of-tops-statistics - http://www.linuxdevcenter.com/pub/a/linux/2006/11/30/linux-out-of-memory.html
  • 37. 37 top _ Can consume resources on it's own _ Toggle f and select fields, e.g. SWAP _ -u let's you see processes from a user _ Toggle k to kill a PID _ Toggle r to renice a PID _ But _ top can miss short living processes _ high %CPU → so what? _ Keep an eye on the tracing part
  • 38. 38 htop _ „Super advanced“ top _ Uses colors, views can be customized
  • 39. 39 iotop _ Simple top like I/O monitor _ Which process is causing I/O _ Filtering specific PID is possible # iotop -o -b Total DISK READ : 0.00 B/s | Total DISK WRITE : 63.94 M/s Actual DISK READ: 0.00 B/s | Actual DISK WRITE: 63.90 M/s TID PRIO USER DISK READ DISK WRITE SWAPIN IO COMMAND 19153 be/4 root 0.00 B/s 63.89 M/s 0.00 % 75.44 % fio --rw=randwrite --name=test --filename=test.fio --size=300M --direct=1 --bs=4k 17715 be/4 gschoenb 0.00 B/s 46.18 K/s 0.00 % 0.00 % firefox [mozStorage #1] # iotop -o -b Total DISK READ : 69.02 M/s | Total DISK WRITE : 65.92 K/s Actual DISK READ: 69.02 M/s | Actual DISK WRITE: 345.12 K/s TID PRIO USER DISK READ DISK WRITE SWAPIN IO COMMAND 19176 be/4 root 69.02 M/s 0.00 B/s 0.00 % 88.28 % fio --rw=read --name=test --filename=test.fio --size=300M --direct=1 --bs=8k Show writes, reads and command in realtime
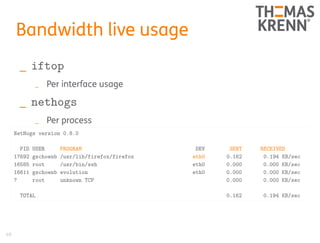
  • 40. 40 Bandwidth live usage _ iftop _ Per interface usage _ nethogs _ Per process NetHogs version 0.8.0 PID USER PROGRAM DEV SENT RECEIVED 17692 gschoenb /usr/lib/firefox/firefox eth0 0.162 0.194 KB/sec 16585 root /usr/bin/ssh eth0 0.000 0.000 KB/sec 16611 gschoenb evolution eth0 0.000 0.000 KB/sec ? root unknown TCP 0.000 0.000 KB/sec TOTAL 0.162 0.194 KB/sec
  • 42. 42 Agenda _ Collect Statistics _ Sysstat Package _ mpstat, vmstat, pidstat, iostat _ dstat, nicstat _ sar, atop _ Percona Cacti Template _ Monitoring Plugins _ Watch online _ top _ iotop _ iftop _ Tracing _ perf_events _ ftrace _ perf-tools _ Flame graphs
  • 44. 44 Profiling _ Create profile about usage characteristics _ Count specific samples/events _ Count objects _ Collecting statistics about tracepoints _ Lines of kernel code with defined event _ Next slides focus on system profiling _ ftrace _ perf_events and perf
  • 45. 45 ftrace _ Part of the Linux kernel since 2.6.27 (2008) _ What is going on inside the kernel _ Common task is to trace events _ With ftrace configured, only debugfs is required # cat /proc/sys/kernel/ftrace_enabled 1 # mount | grep debug none on /sys/kernel/debug type debugfs (rw) /sys/kernel/debug/tracing# cat available_tracers blk mmiotrace function_graph wakeup_rt wakeup function nop Most widely applicable, traces kernel function calls
  • 47. 47 ftrace _ Interact with files in sys _ Easier with trace-cmd → interface for sys files # less /sys/kernel/debug/tracing/trace #!/bin/bash DEBUGFS=`grep debugfs /proc/mounts | awk '{ print $2; }'` echo $$ > $DEBUGFS/tracing/set_ftrace_pid echo function > $DEBUGFS/tracing/current_tracer echo 1 > $DEBUGFS/tracing/tracing_on $* echo 0 > $DEBUGFS/tracing/tracing_on View the recorded trace
  • 48. 48 perf_events and perf _ Used to be called performance counters for Linux _ A lot of updates for kernel 4.1 _ https://lkml.org/lkml/2015/4/14/264 _ CPU performance counters, tracepoints, kprobes and uprobes _ Per package with linux-tools-common # which perf /usr/bin/perf # dpkg -S /usr/bin/perf linux-tools-common: /usr/bin/perf
  • 49. 49 perf list _ perf list _ Shows supported events # perf list | wc -l 1779 # perf list | grep Hardware cpu-cycles OR cycles [Hardware event] instructions [Hardware event] cache-references [Hardware event] cache-misses [Hardware event] branch-instructions OR branches [Hardware event] branch-misses [Hardware event] bus-cycles [Hardware event] stalled-cycles-frontend OR idle-cycles-frontend [Hardware event] stalled-cycles-backend OR idle-cycles-backend [Hardware event] ref-cycles [Hardware event] L1-dcache-loads [Hardware cache event] L1-dcache-load-misses [Hardware cache event] L1-dcache-stores [Hardware cache event] L1-dcache-store-misses [Hardware cache event] This also includes static tracepoints
  • 50. 50 Raw CPU counters _ Each CPU has it's own raw counters _ They should be documented by the hardware manufacturer _ https://download.01.org/perfmon/ _ libpfm4 is a nice way to find raw masks # perf list | grep rNNN rNNN [Raw hardware event descriptor] # git clone git://perfmon2.git.sourceforge.net/gitroot/perfmon2/libpfm4 # cd libpfm4 # make # cd examples/ # ./showevtinfo | grep LLC | grep MISSES Name : LLC_MISSES [...] # ./check_events LLC_MISSES | grep Codes Codes : 0x53412e # perf stat -e r53412e sleep 5 Now we collect last level cache misses with the raw mask
  • 51. 51 Tracepoints _ perf also has trace functionalities _ Filesystem _ Block layer _ Syscalls # perf list | grep -i trace | wc -l 1716 # perf stat -e 'syscalls:sys_enter_mmap' ./helloWorld.out Hello world! Performance counter stats for './helloWorld.out': 8 syscalls:sys_enter_mmap 0,000556961 seconds time elapsed
  • 52. 52 perf stat _ Get a counter summary # perf stat python numpy-matrix.py -i matrix.in Performance counter stats for 'python numpy-matrix.py -i matrix.in': 576,104221 task-clock (msec) # 0,930 CPUs utilized 319 context-switches # 0,554 K/sec 4 cpu-migrations # 0,007 K/sec 9.738 page-faults # 0,017 M/sec 1.743.664.199 cycles # 3,027 GHz [82,63%] 831.364.029 stalled-cycles-frontend # 47,68% frontend cycles idle [83,75%] 458.760.523 stalled-cycles-backend # 26,31% backend cycles idle [67,26%] 2.793.953.303 instructions # 1,60 insns per cycle # 0,30 stalled cycles per insn [84,28%] 573.342.473 branches # 995,206 M/sec [83,78%] 3.586.249 branch-misses # 0,63% of all branches [82,70%] 0,619482128 seconds time elapsed A way to compare performance of different algorithms
  • 53. 53 perf record _ Record samples to a file _ Can be post-processed with perf report _ -a records on all CPUs _ -g records call graphs _ Install debug symbols # perf record -a -g sleep 5 [ perf record: Woken up 4 times to write data ] [ perf record: Captured and wrote 2.157 MB perf.data (~94254 samples) ] -a nice way to record what's currently running on all CPUs -g enables call-graph
  • 54. 54 perf report _ Displays profile of a record _ Can be sorted and or filtered _ Shows all samples
  • 55. 55 # perf report -i perf.data.dd --stdio --showcpuutilization --sort comm,dso [...] # Overhead sys usr Command Shared Object # ........ ........ ........ ....... ................. 95.00% 95.00% 0.00% dd [kernel.kallsyms] | |--33.22%-- _aesni_enc1 | __ablk_encrypt | ablk_encrypt | crypt_scatterlist | crypt_extent | ecryptfs_encrypt_page | ecryptfs_write_end | generic_file_buffered_write | __generic_file_aio_write | generic_file_aio_write | do_sync_write | vfs_write | sys_write | system_call_fastpath | __GI___libc_write | 0x415f65643d524550 |--9.11%-- _cond_resched | | | |--57.94%-- ext4_dirty_inode | | __mark_inode_dirty | | generic_write_end | | ext4_da_write_end | | generic_file_buffered_write Command and shared object Traced method dd writes data
  • 56. 56 perf-tools _ By Brendan Gregg _ https://github.com/brendangregg/perf-tools _ Mostly quick hacks, read Warnings! _ Using perf_events and ftrace _ Good examples what can be done with perf and ftrace _ iosnoop Shows I/O access for commands, including latency _ cachestat Linux page cache hit/miss statistics _ functrace Count kernel functions matching wildcards Nice, this are simple bash scripts!
  • 60. 60 Flamegraph _ Visualization how resources are distributed among code Powered by @agentzh, http://agentzh.org/misc/slides/yapc-na-2013-flame-graphs.pdf
  • 61. 61 Let's start the live demo #4 Flamegraph
  • 62. 62 Flamegraph # perf record -g dd if=/dev/zero of=test.data count=1 bs=1M # mv perf.data perf.data.dd # perf script -i perf.data.dd | ./FlameGraph/stackcollapse-perf.pl > out.dd.folded # ./FlameGraph/flamegraph.pl out.dd.folded > out.perf.dd.svg
  • 63. # why is cpu util wrong? 63
  • 67. 67 Other reasons why CPU util can be misleading _ Temperature trips stalling the CPU _ Turboboost _ Kernel varying the clock rate (Speed Step) _ Problem with avg: 80% over 1 min → hides burts of 100%
  • 69. Thanks for your attention! _ wfischer AT thomas-krenn.com _ @wefinet
  • 70. TombolaWin a Low EnergyServer / SSD / Laptop bagDrawing tomorrow afternoon